- Essentials
- Getting Started
- Datadog
- Datadog Site
- DevSecOps
- Serverless for AWS Lambda
- Agent
- Integrations
- Containers
- Dashboards
- Monitors
- Logs
- APM Tracing
- Profiler
- Tags
- API
- Service Catalog
- Session Replay
- Continuous Testing
- Synthetic Monitoring
- Incident Management
- Database Monitoring
- Cloud Security Management
- Cloud SIEM
- Application Security Management
- Workflow Automation
- CI Visibility
- Test Visibility
- Intelligent Test Runner
- Code Analysis
- Learning Center
- Support
- Glossary
- Standard Attributes
- Guides
- Agent
- Integrations
- OpenTelemetry
- Developers
- Authorization
- DogStatsD
- Custom Checks
- Integrations
- Create an Agent-based Integration
- Create an API Integration
- Create a Log Pipeline
- Integration Assets Reference
- Build a Marketplace Offering
- Create a Tile
- Create an Integration Dashboard
- Create a Recommended Monitor
- Create a Cloud SIEM Detection Rule
- OAuth for Integrations
- Install Agent Integration Developer Tool
- Service Checks
- IDE Plugins
- Community
- Guides
- API
- Datadog Mobile App
- CoScreen
- Cloudcraft
- In The App
- Dashboards
- Notebooks
- DDSQL Editor
- Sheets
- Monitors and Alerting
- Infrastructure
- Metrics
- Watchdog
- Bits AI
- Service Catalog
- API Catalog
- Error Tracking
- Service Management
- Infrastructure
- Application Performance
- APM
- Continuous Profiler
- Database Monitoring
- Data Streams Monitoring
- Data Jobs Monitoring
- Digital Experience
- Real User Monitoring
- Product Analytics
- Synthetic Testing and Monitoring
- Continuous Testing
- Software Delivery
- CI Visibility
- CD Visibility
- Test Visibility
- Intelligent Test Runner
- Code Analysis
- Quality Gates
- DORA Metrics
- Security
- Security Overview
- Cloud SIEM
- Cloud Security Management
- Application Security Management
- AI Observability
- Log Management
- Observability Pipelines
- Log Management
- Administration
Browser Testing Results
Overview
Test runs appear in a test details page after a Synthetic test executes. Sample results correlate to the latest passed and failed test executions over a time interval and in a specific number of locations and devices.
Test properties
In the Properties section, you can see the test ID, test creation and edit date, a list of tags, test priority, and a link to an out-of-the-box Synthetic browser test dashboard.
- Overview
- This section describes the test URL, number of locations, number of devices, test interval, and the number of test steps, including custom steps.
- Monitor
- This section contains the name of the Synthetic test’s monitor and the configured notification message.
- CI/CD Execution
- This section contains a dropdown menu to change the execution rule for this test running as part of a Continuous Testing CI pipeline.
Test history
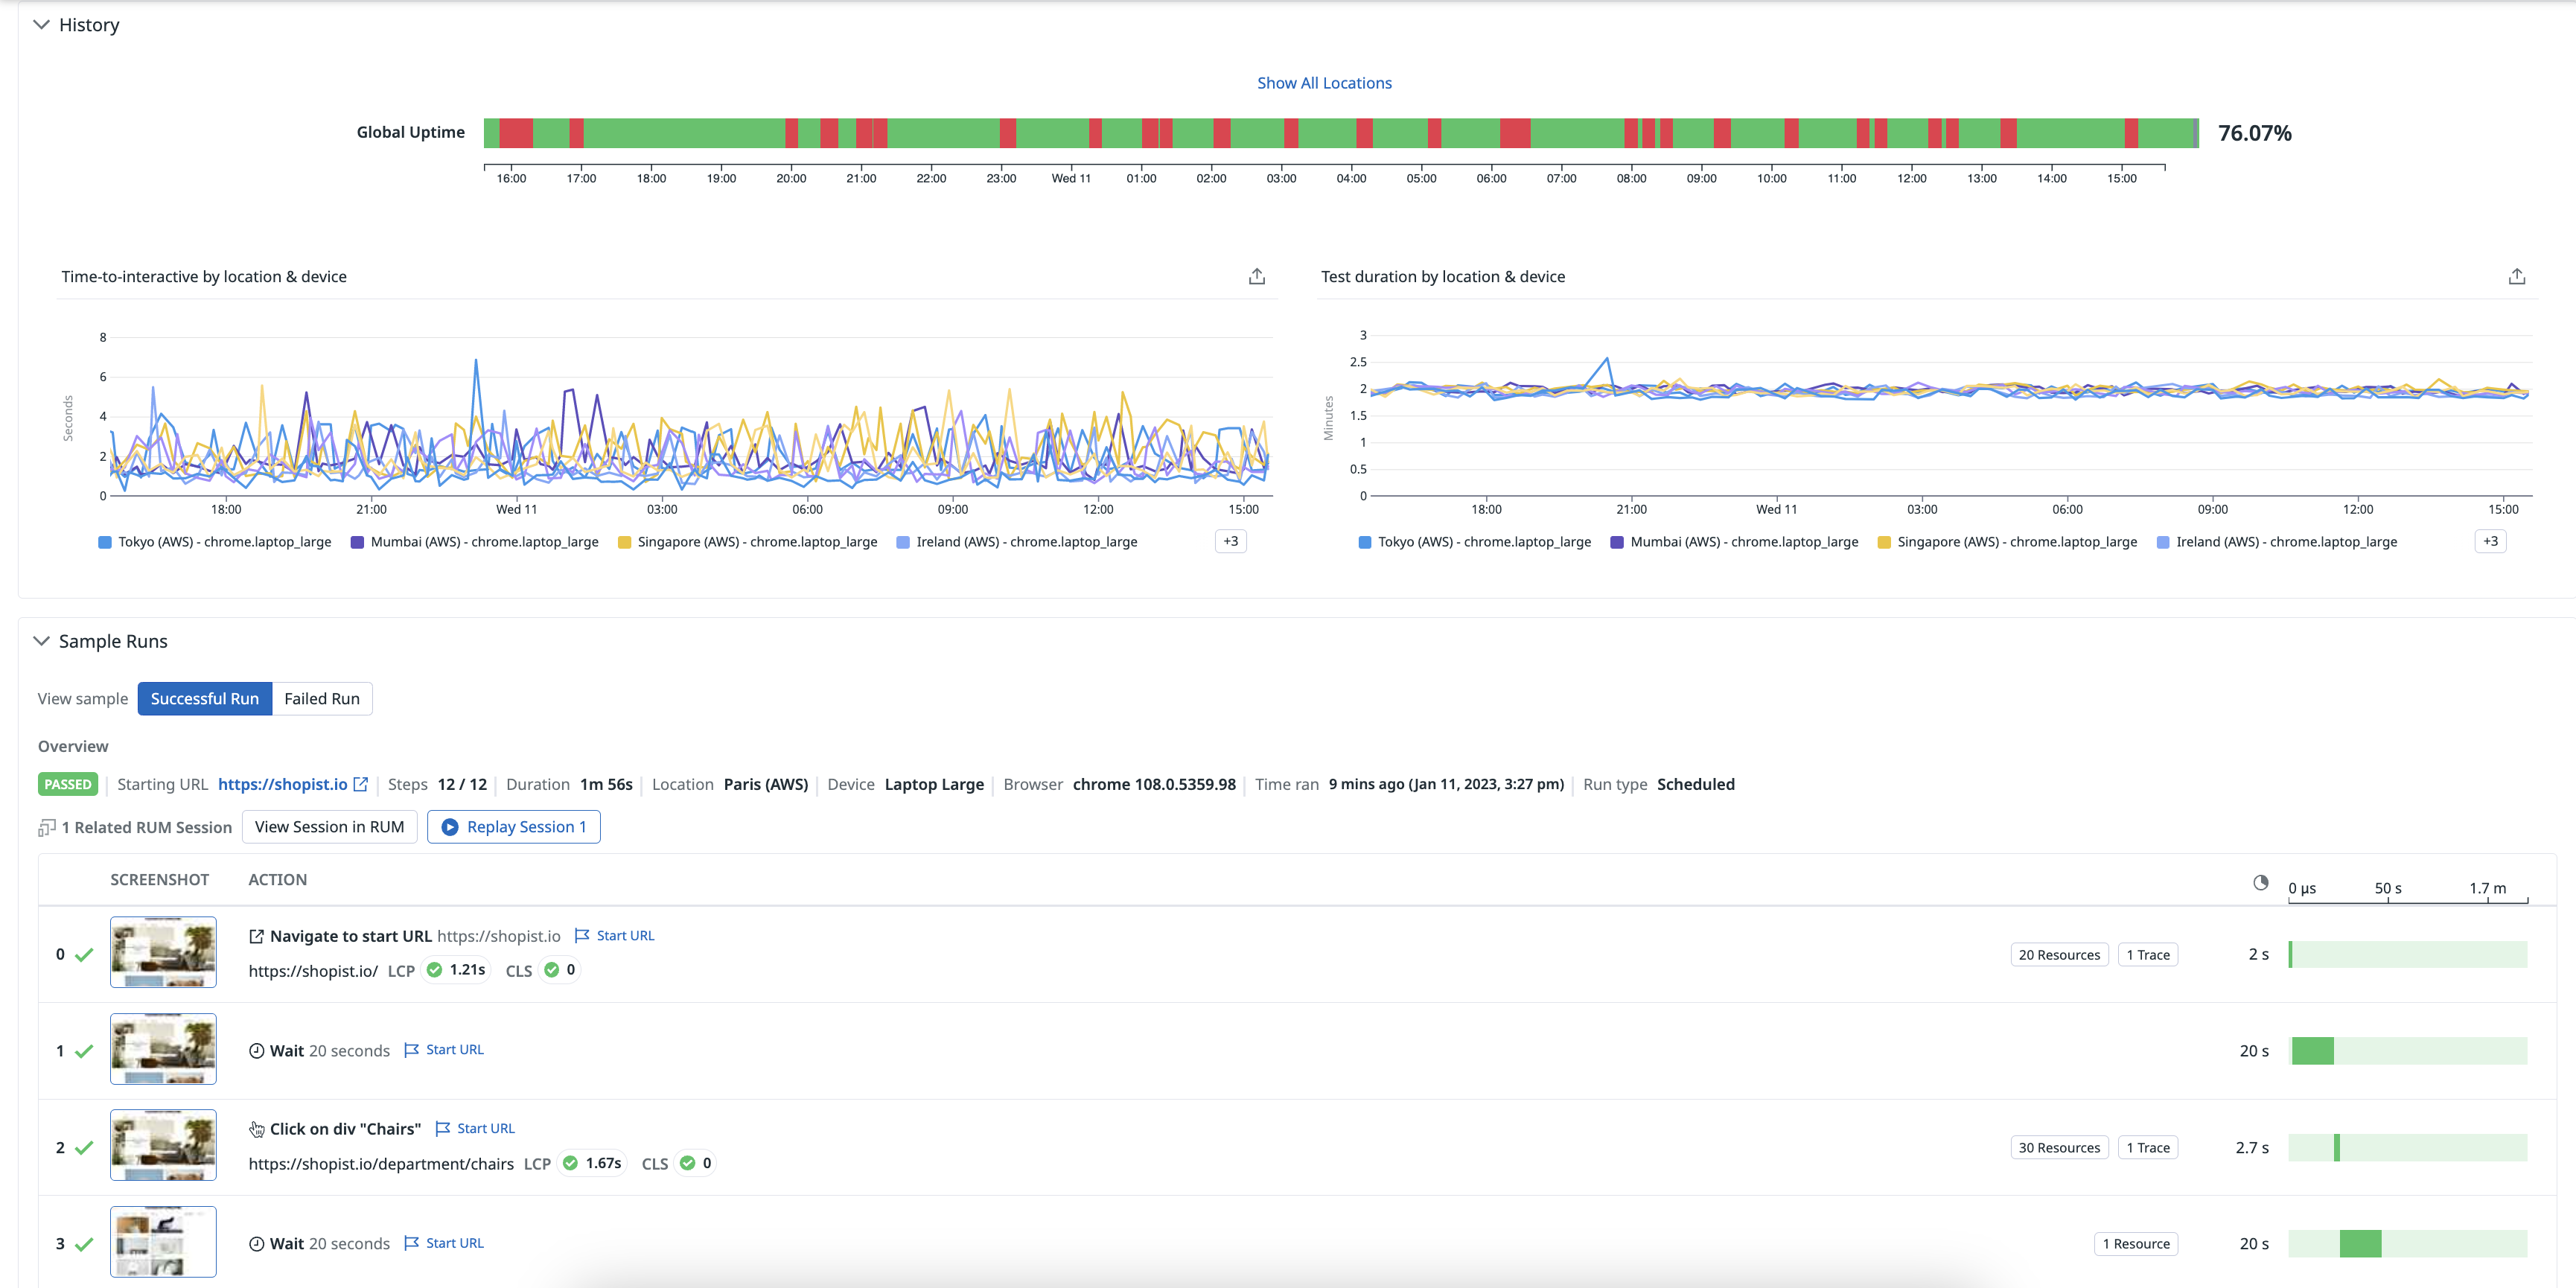
In the History section, you can see three graphs:
- The Global Uptime graph displays the total uptime of all test locations in a given time interval. The global uptime takes into consideration the alert conditions configured for a test.
- The Time-to-interactive by location and device graph displays the amount of time until a page can be interacted with in seconds. For more information about uptime monitoring, see the Website Uptime Monitoring with SLOs guide.
- The Test duration by location and device graph displays the amount of time in minutes each location and device takes to complete in a given time interval.
Sample results
Browser test runs include components such as screenshots, page performance data, errors, resources, and backend traces to help troubleshoot your test failure.
In the Sample Runs section, you can examine the latest failed test runs and compare them to recent successful test runs.
Overview attributes
- Status
- The status of your test run (
PASSEDorFAILED). - Starting URL
- The URL of your browser test scenario.
- Steps
- The number of test steps completed in your sample run.
- Duration
- The amount of time it took your test to run.
- Location
- The managed or private location your test was executed from.
- Device
- The type of device your test was executed from.
- Browser
- The type of browser your test was executed from.
- Time ran
- The amount of time that has passed since your test ran.
- Run type
- The type of test run (CI, fast retry, manually triggered, or scheduled).
RUM sessions
To view related sessions and available replays in the RUM Explorer, click View Session in RUM. To access a user session for a particular action or step in Session Replay, click Replay Session. For more information, see Explore RUM & Session Replay in Synthetics.
Screenshots and actions
Every executed test step contains a screenshot of the step action, a link to the session in Session Replay, the step description, starting URL for a given step, step ID, step duration, and page performance information.
Page performance
Synthetic Monitoring includes two Core Web Vital metrics (Largest Contentful Paint and Cumulative Layout Shift) as lab metrics and displays them as pills to the right of each step URL.
First Input Delay is available as a real metric if you are using Real User Monitoring to collect real user data. For more information, see Monitoring Page Performance.
Errors and warnings
Click the Errors pill to access the Errors & Warnings tab and examine a list of errors separated by error type (js or network) and status (the network status code).
The error type is logged when the browser test interacts with the page. It corresponds to the errors collected between the time the page is opened and the time the page can be interacted with. The maximum number of errors that can be displayed is 8, for example: 2 network + 6 js errors.
Resources
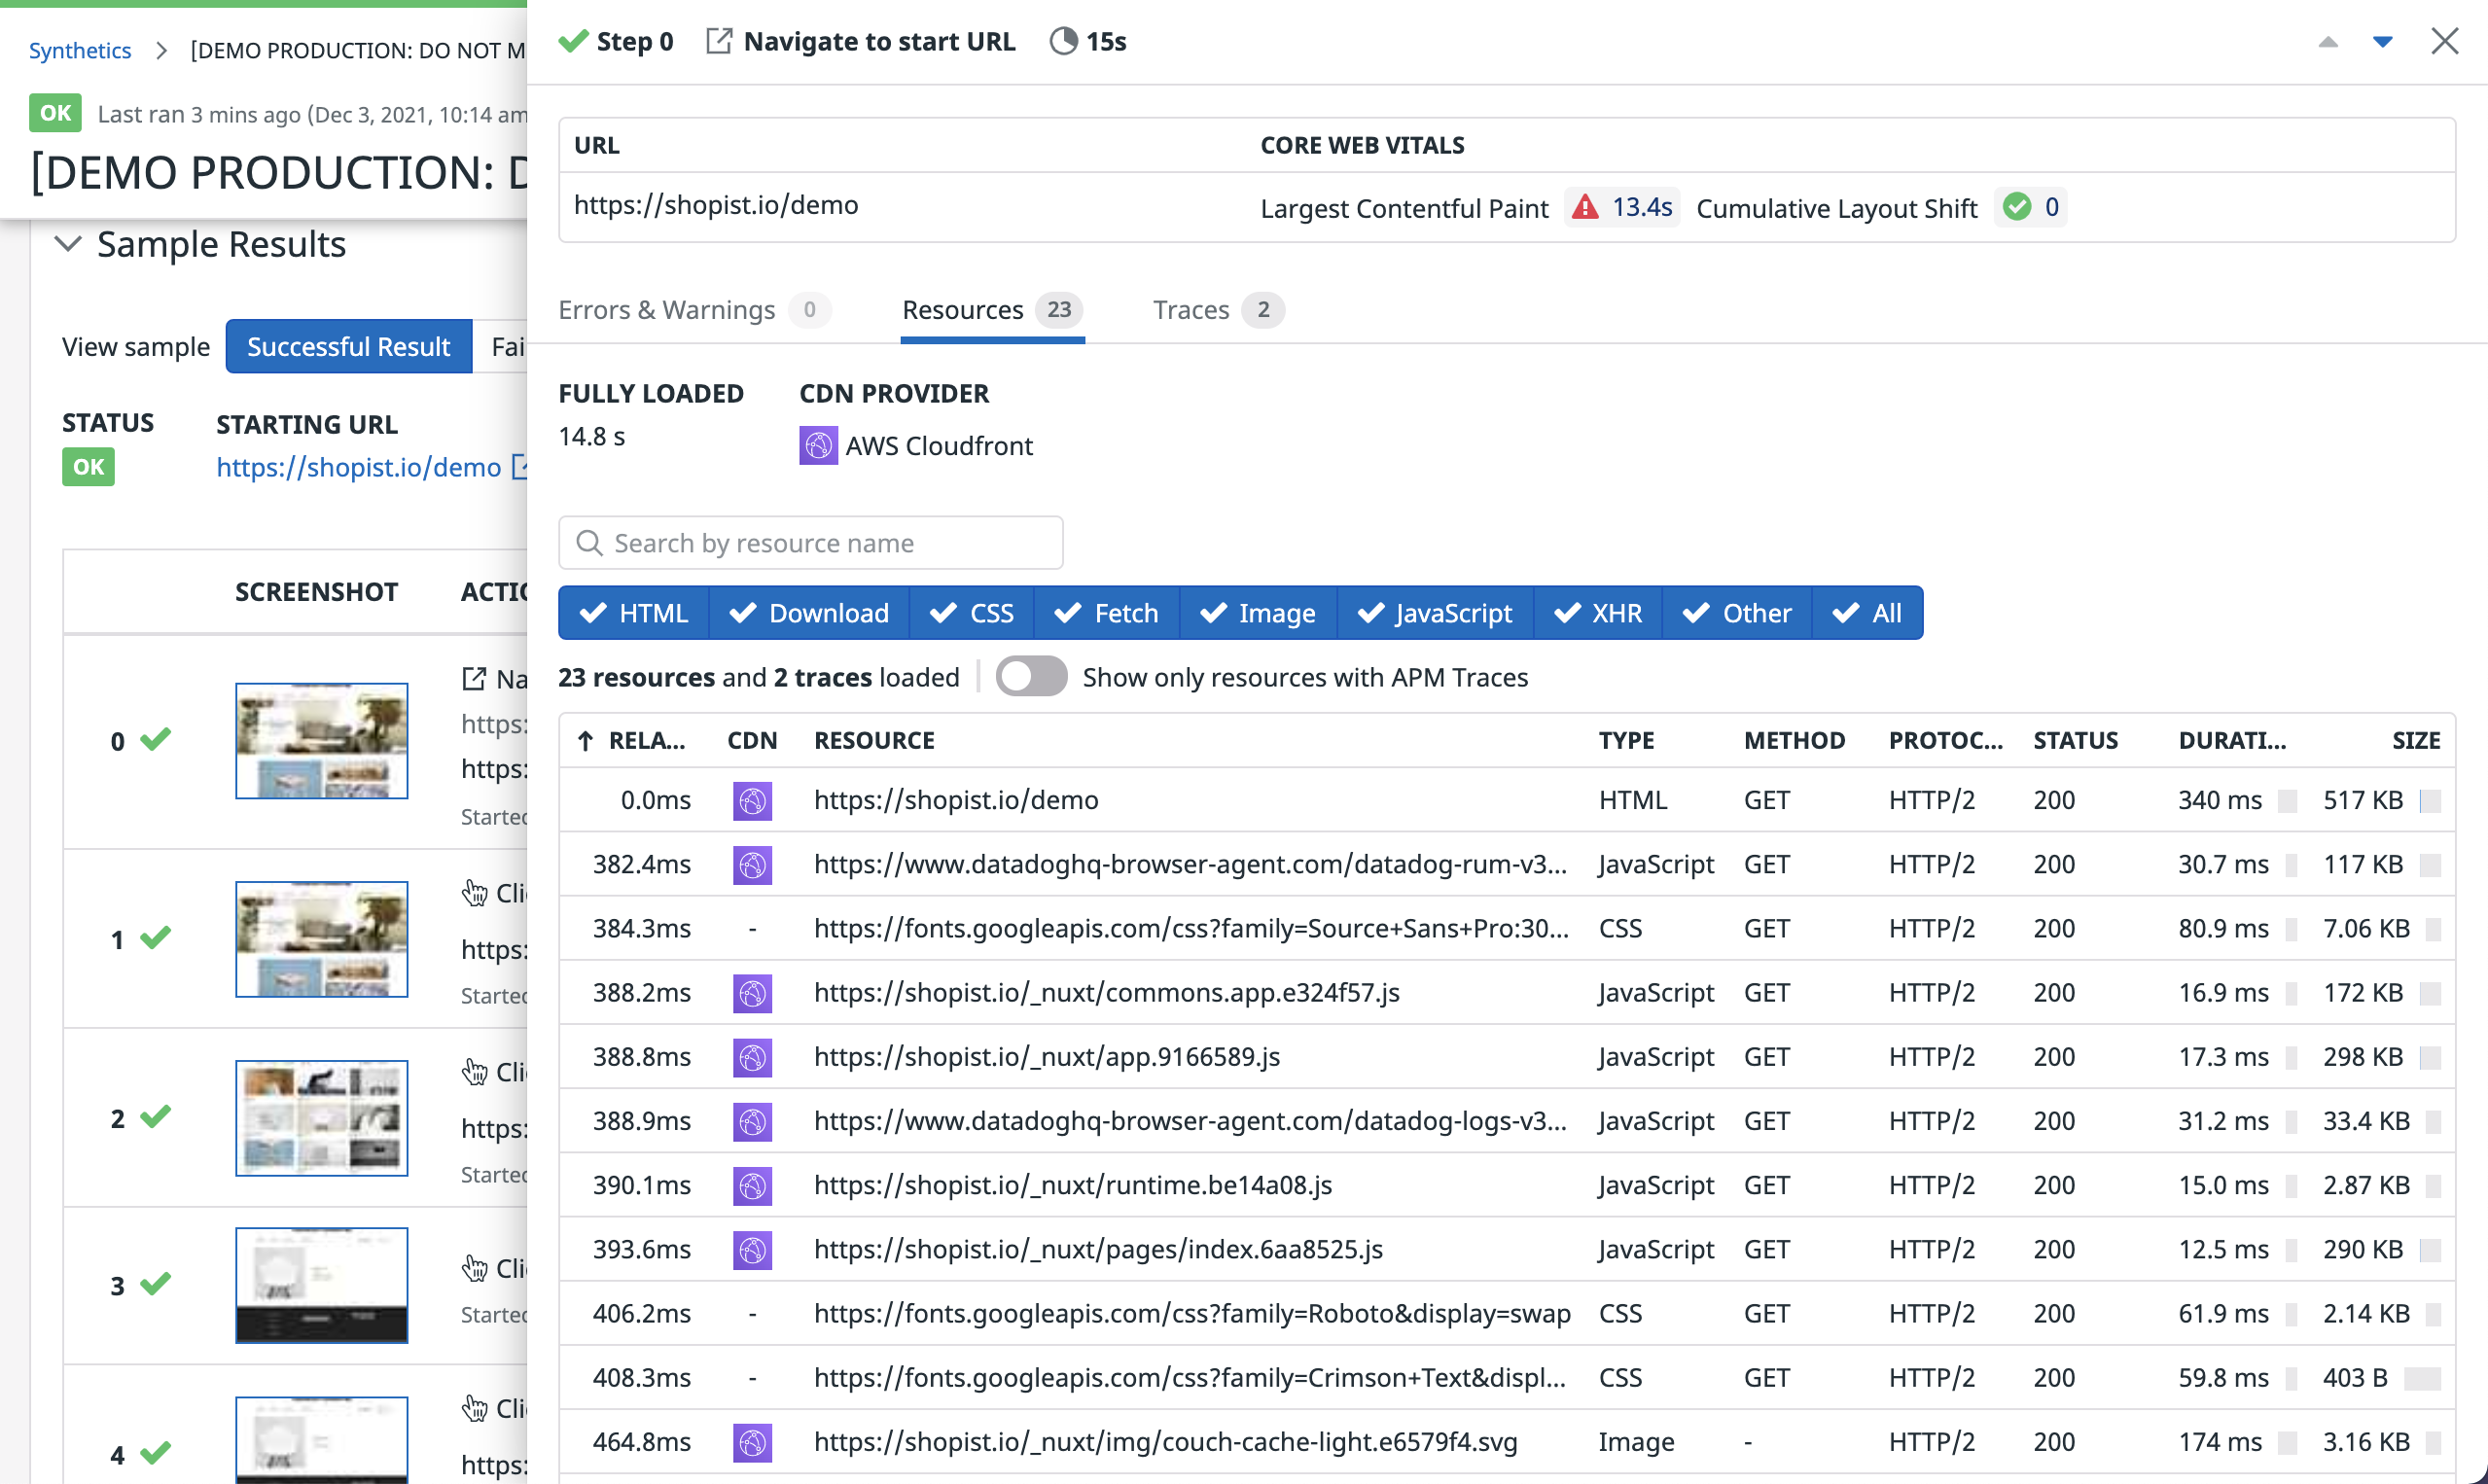
Click the Resources pill to access the Resources tab and examine the combination of requests and assets, including the total step duration time under Fully Loaded and the CDN provider serving the resources.
You can filter resources by type and search by name in the search bar. The maximum number of resources that can be displayed is 100. Resources are ordered by the time when they start and display the first 100 in Datadog.
- Relative Time
- The resource duration over the total interaction time.
- CDN
- The CDN provider that served the resource. Hover over a CDN provider’s icon to see the raw cache status.
Datadog detects Akamai, Cloudflare, Fastly, Amazon Cloudfront, Netlify, Google Cloud CDN, Imperva, and Sucuri. - Resource
- The URL of the resource.
- Type
- The type of resource (HTML, Download, CSS, Fetch, Image, JavaScript, XHR, or Other).
- Method
- The method of the request.
- Protocol
- The protocol of the request.
- Status
- The HTTP response status code.
- Duration
- The time needed to perform the request.
- Size
- The size of the request response.
Backend traces
Click the Traces pill to access the Traces tab and explore APM traces associated with the browser test. While the UI is similar to the Trace View in the Trace Explorer, one browser test step can make multiple requests to different URLs or endpoints. This results in several associated traces, depending on your tracing setup and on the URLs you allowed in for browser tests in the Synthetic Monitoring Settings page.
For more information about cross-product correlation, see the Ease Troubleshooting With Cross-Product Correlation guide.
Step duration
The step duration represents the amount of time the step takes to execute with the Datadog locator system. Not only does the step duration include the action (such as user interactions), but also it incorporates the wait and retry mechanism, which allows browser tests to ensure an element is able to be interacted with. For more information, see Advanced Options for Browser Test Steps.
Failed results
A test result is considered FAILED if it does not satisfy its assertions or if a step failed for another reason. You can troubleshoot failed runs by looking at their screenshots, checking for potential errors at the step level, and looking into resources and backend traces generated by their steps.
Compare screenshots
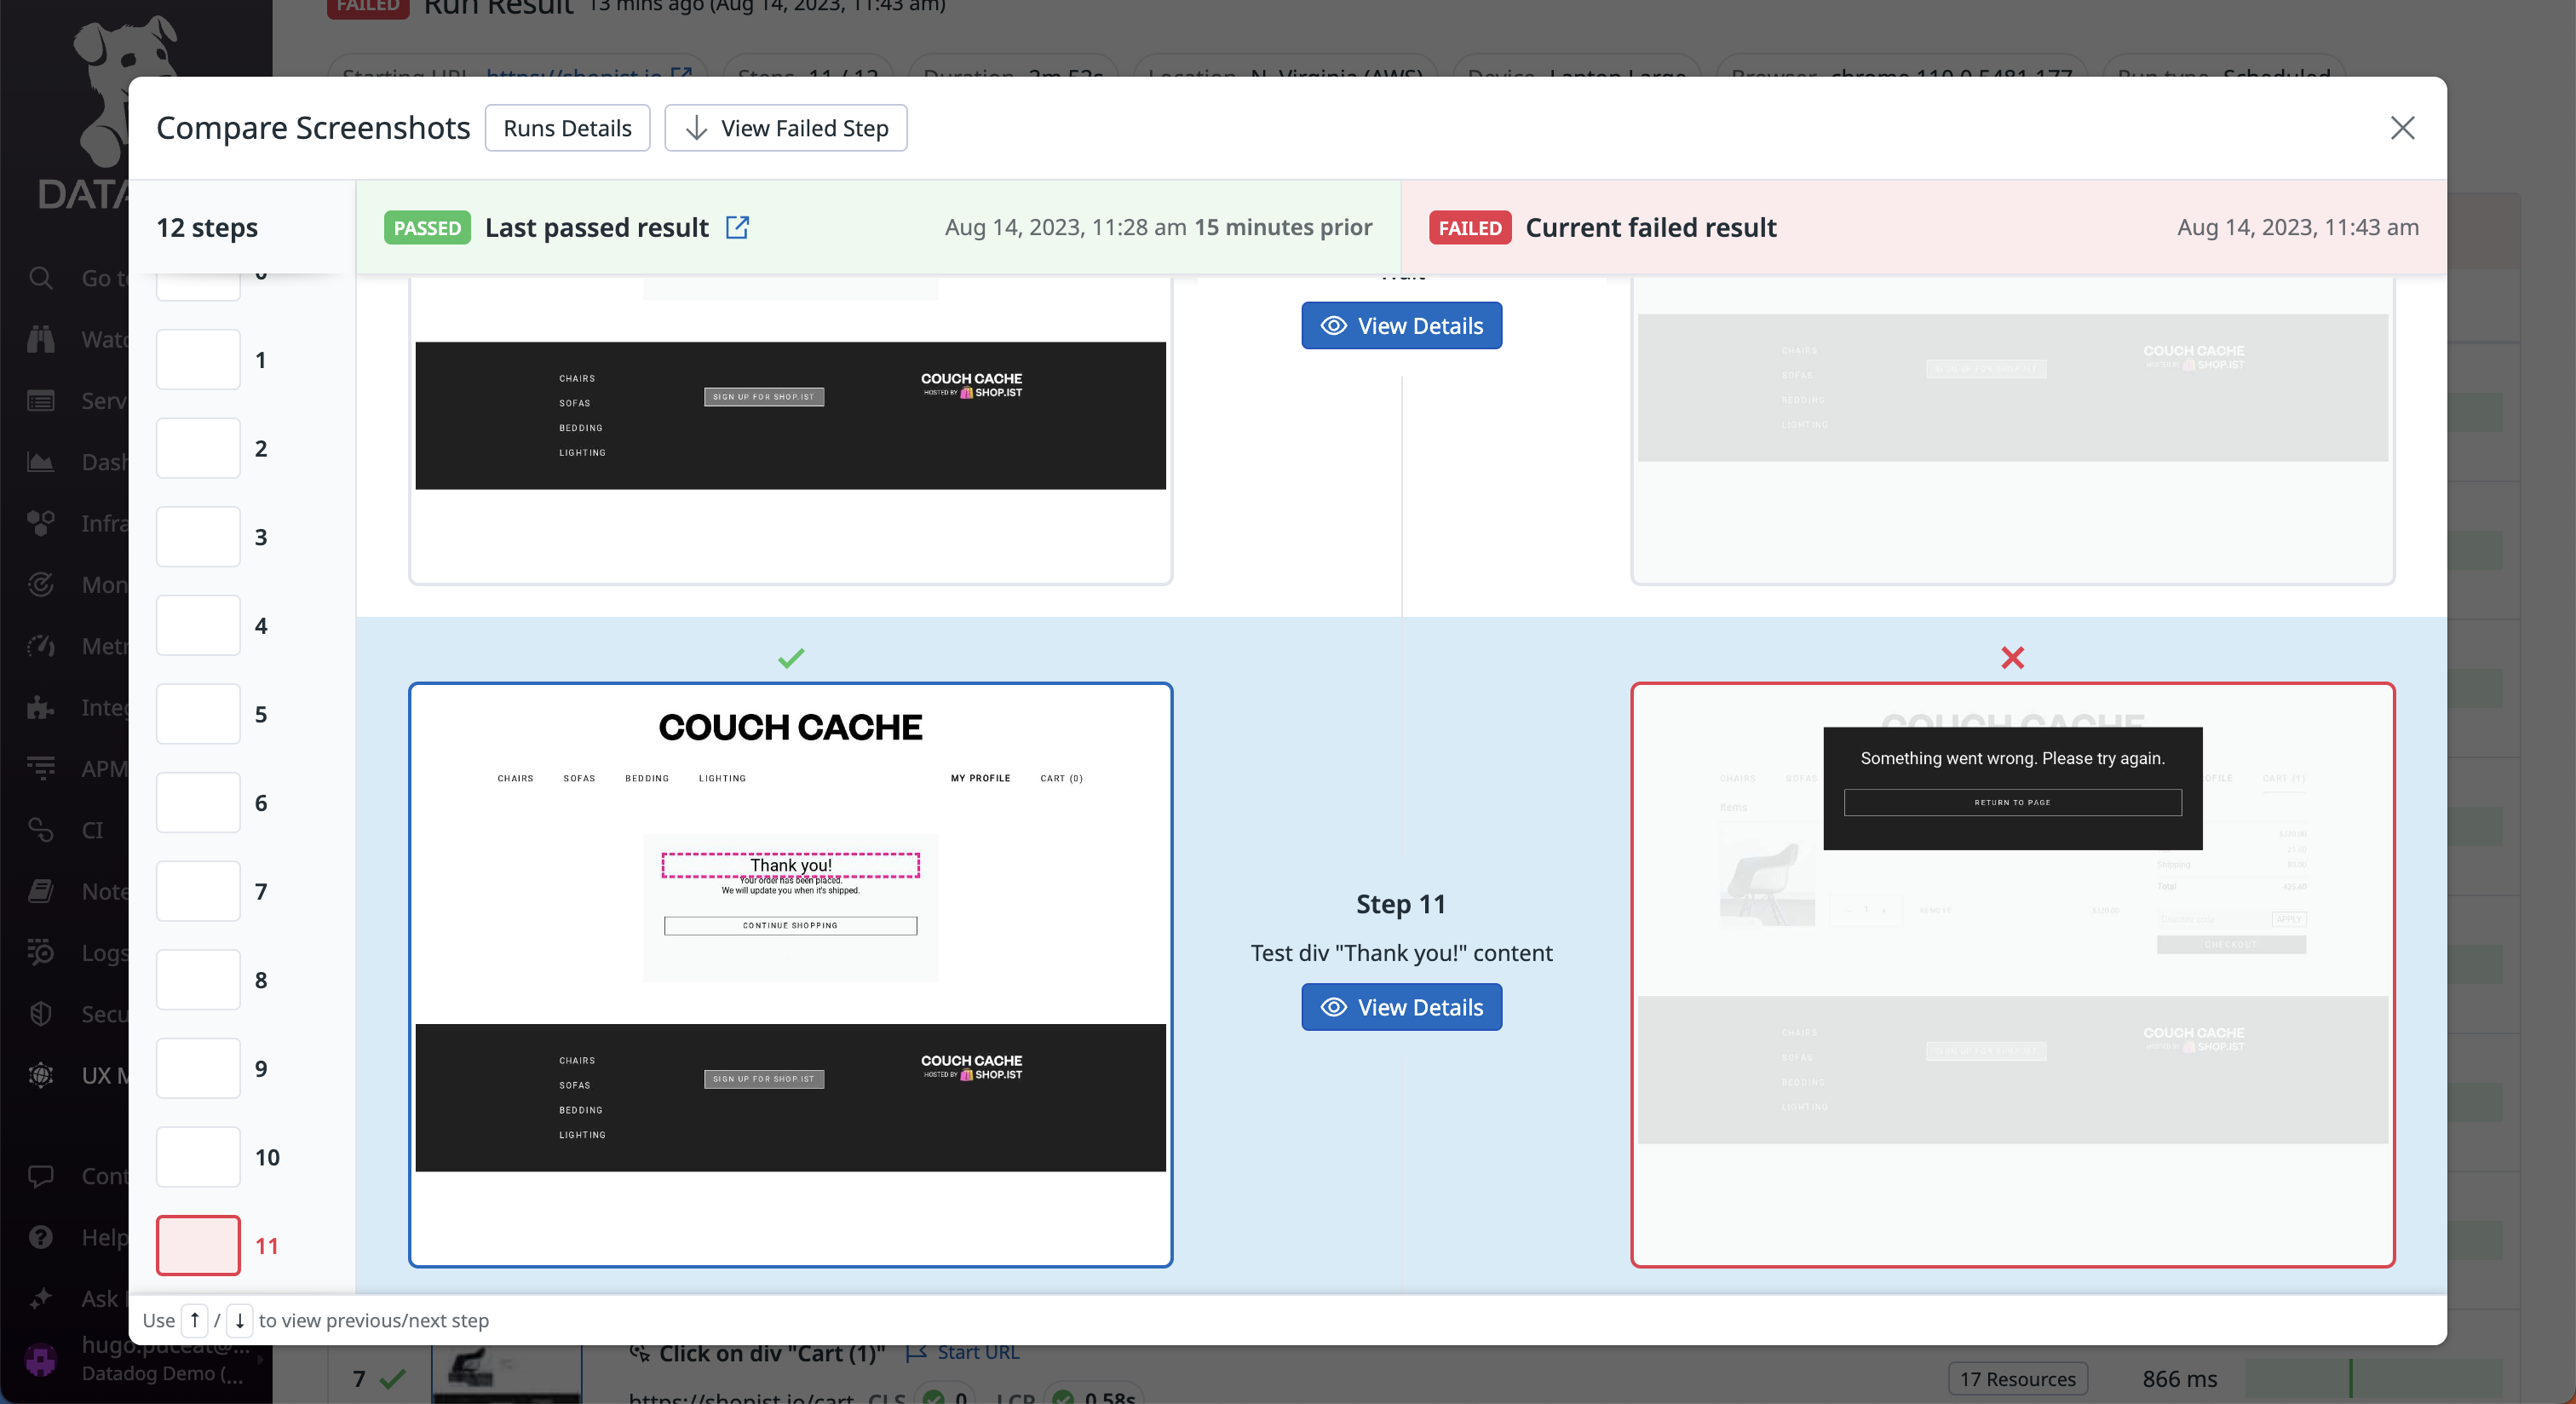
To help during the investigation, click Compare Screenshots to receive side-by-side screenshots of the failed result and the last successful execution. The comparison helps you to spot any differences that could have caused the test to fail.
Note: Comparison is performed between two test runs with the same version, start URL, device, browser, and run type (scheduled, manual trigger, CI/CD). If there is no successful prior run with the same parameters, no comparison is offered.Common browser test errors
Element located but it's invisible- The element is on the page but cannot be clicked on—for instance, if another element is overlaid on top of it.
Cannot locate element- The element cannot be found in the HTML.
Select did not have option- The specified option is missing from the dropdown menu.
Forbidden URL- The test likely encountered a protocol that is not supported. Contact Support for more details.
General test failure- A general error message. Contact Support for more details.
Test events
Alerts from your Synthetic test monitors appear in the Events tab under Test Runs. To search for alerts from Synthetic tests in the Events Explorer, navigate to Events > Explorer and enter Event Type:synthetics_alert in the search query. For more information, see Using Synthetic Test Monitors.
Further Reading
Additional helpful documentation, links, and articles:


