- Essentials
- Getting Started
- Datadog
- Datadog Site
- DevSecOps
- Serverless for AWS Lambda
- Agent
- Integrations
- Containers
- Dashboards
- Monitors
- Logs
- APM Tracing
- Profiler
- Tags
- API
- Service Catalog
- Session Replay
- Continuous Testing
- Synthetic Monitoring
- Incident Management
- Database Monitoring
- Cloud Security Management
- Cloud SIEM
- Application Security Management
- Workflow Automation
- CI Visibility
- Test Visibility
- Intelligent Test Runner
- Code Analysis
- Learning Center
- Support
- Glossary
- Standard Attributes
- Guides
- Agent
- Integrations
- OpenTelemetry
- Developers
- Authorization
- DogStatsD
- Custom Checks
- Integrations
- Create an Agent-based Integration
- Create an API Integration
- Create a Log Pipeline
- Integration Assets Reference
- Build a Marketplace Offering
- Create a Tile
- Create an Integration Dashboard
- Create a Recommended Monitor
- Create a Cloud SIEM Detection Rule
- OAuth for Integrations
- Install Agent Integration Developer Tool
- Service Checks
- IDE Plugins
- Community
- Guides
- API
- Datadog Mobile App
- CoScreen
- Cloudcraft
- In The App
- Dashboards
- Notebooks
- DDSQL Editor
- Sheets
- Monitors and Alerting
- Infrastructure
- Metrics
- Watchdog
- Bits AI
- Service Catalog
- API Catalog
- Error Tracking
- Service Management
- Infrastructure
- Application Performance
- APM
- Continuous Profiler
- Database Monitoring
- Data Streams Monitoring
- Data Jobs Monitoring
- Digital Experience
- Real User Monitoring
- Product Analytics
- Synthetic Testing and Monitoring
- Continuous Testing
- Software Delivery
- CI Visibility
- CD Visibility
- Test Visibility
- Intelligent Test Runner
- Code Analysis
- Quality Gates
- DORA Metrics
- Security
- Security Overview
- Cloud SIEM
- Cloud Security Management
- Application Security Management
- AI Observability
- Log Management
- Observability Pipelines
- Log Management
- Administration
Debug the slowest trace on the slowest endpoint of a web service
3 minutes to complete
With Datadog APM, you can investigate the performance of your endpoints, identify slow requests, and investigate the root cause of latency issues. This example shows the slowest trace of the day for an e-commerce checkout endpoint and how it slows down because of high CPU usage.
Open the Service Catalog.
This page contains a list of all services sending data to Datadog. Note you can search for keywords, filter by
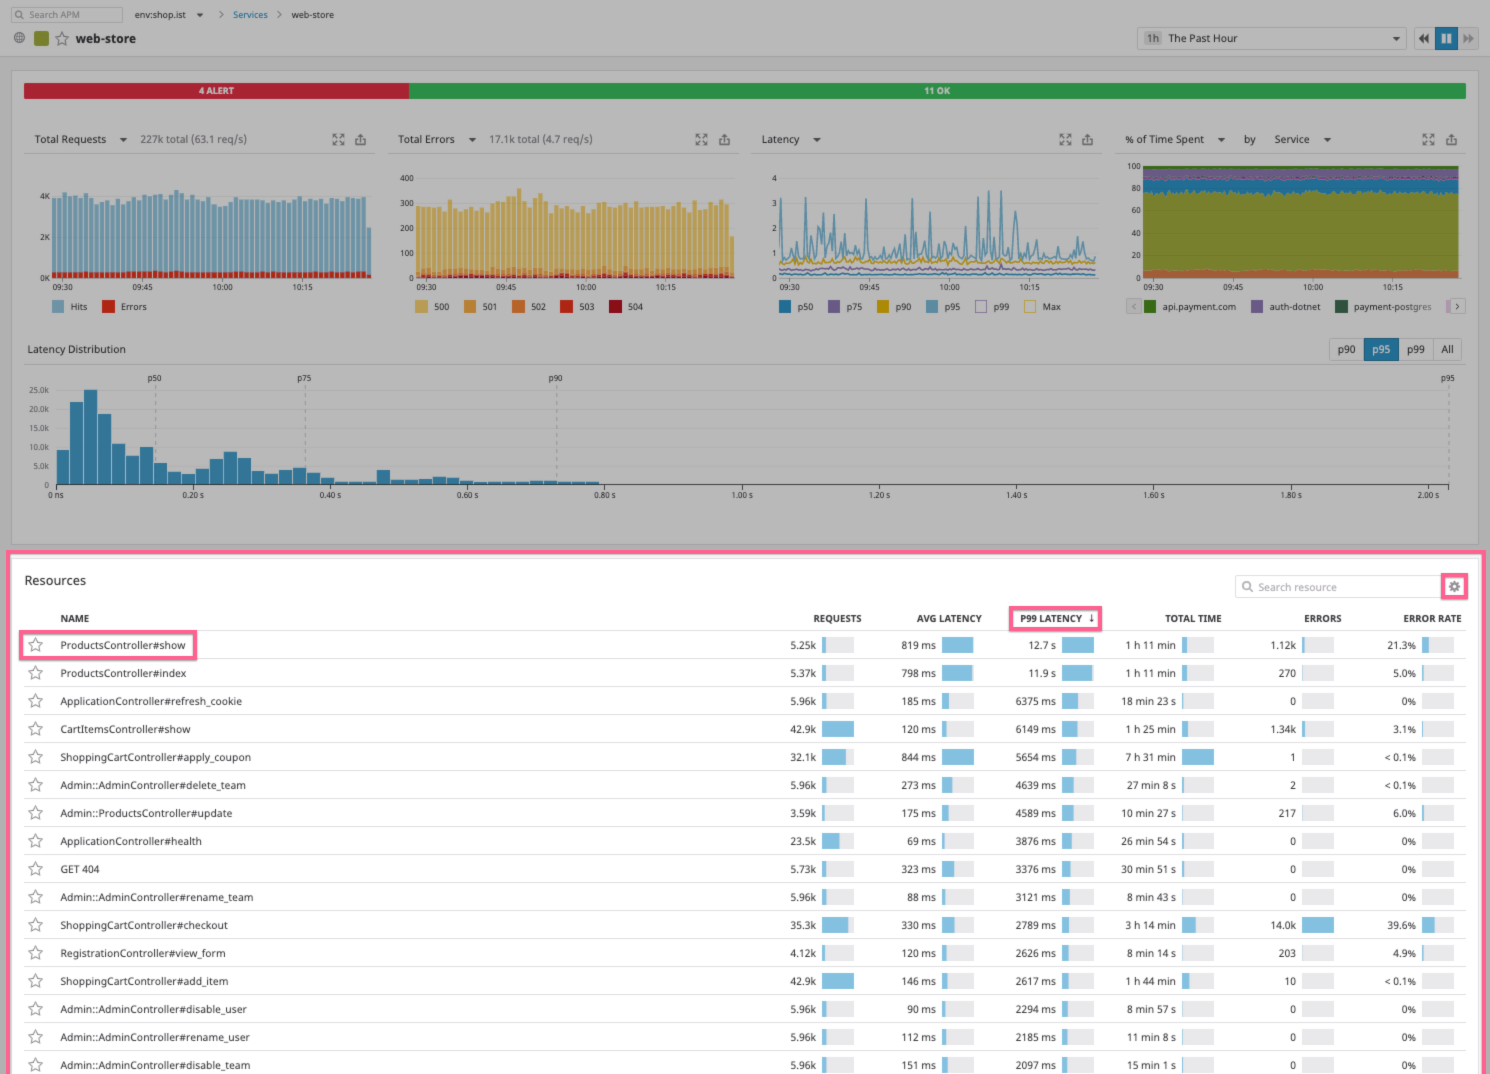
env-tag, and set the time frame.Search for a relevant and active web service and open the Service Page.
The
web-storeservice is used in this example because it is the primary server in the tech stack and it controls most calls to third party services.In addition to throughput, latency, and error rate information, the service details page contains a list of Resources (major operations like API endpoints, SQL queries, and web requests) identified for the service.
Sort the Resource table by p99 latency and click into the slowest resource. Note: If you cannot see a p99 latency column, you can click on the cog icon
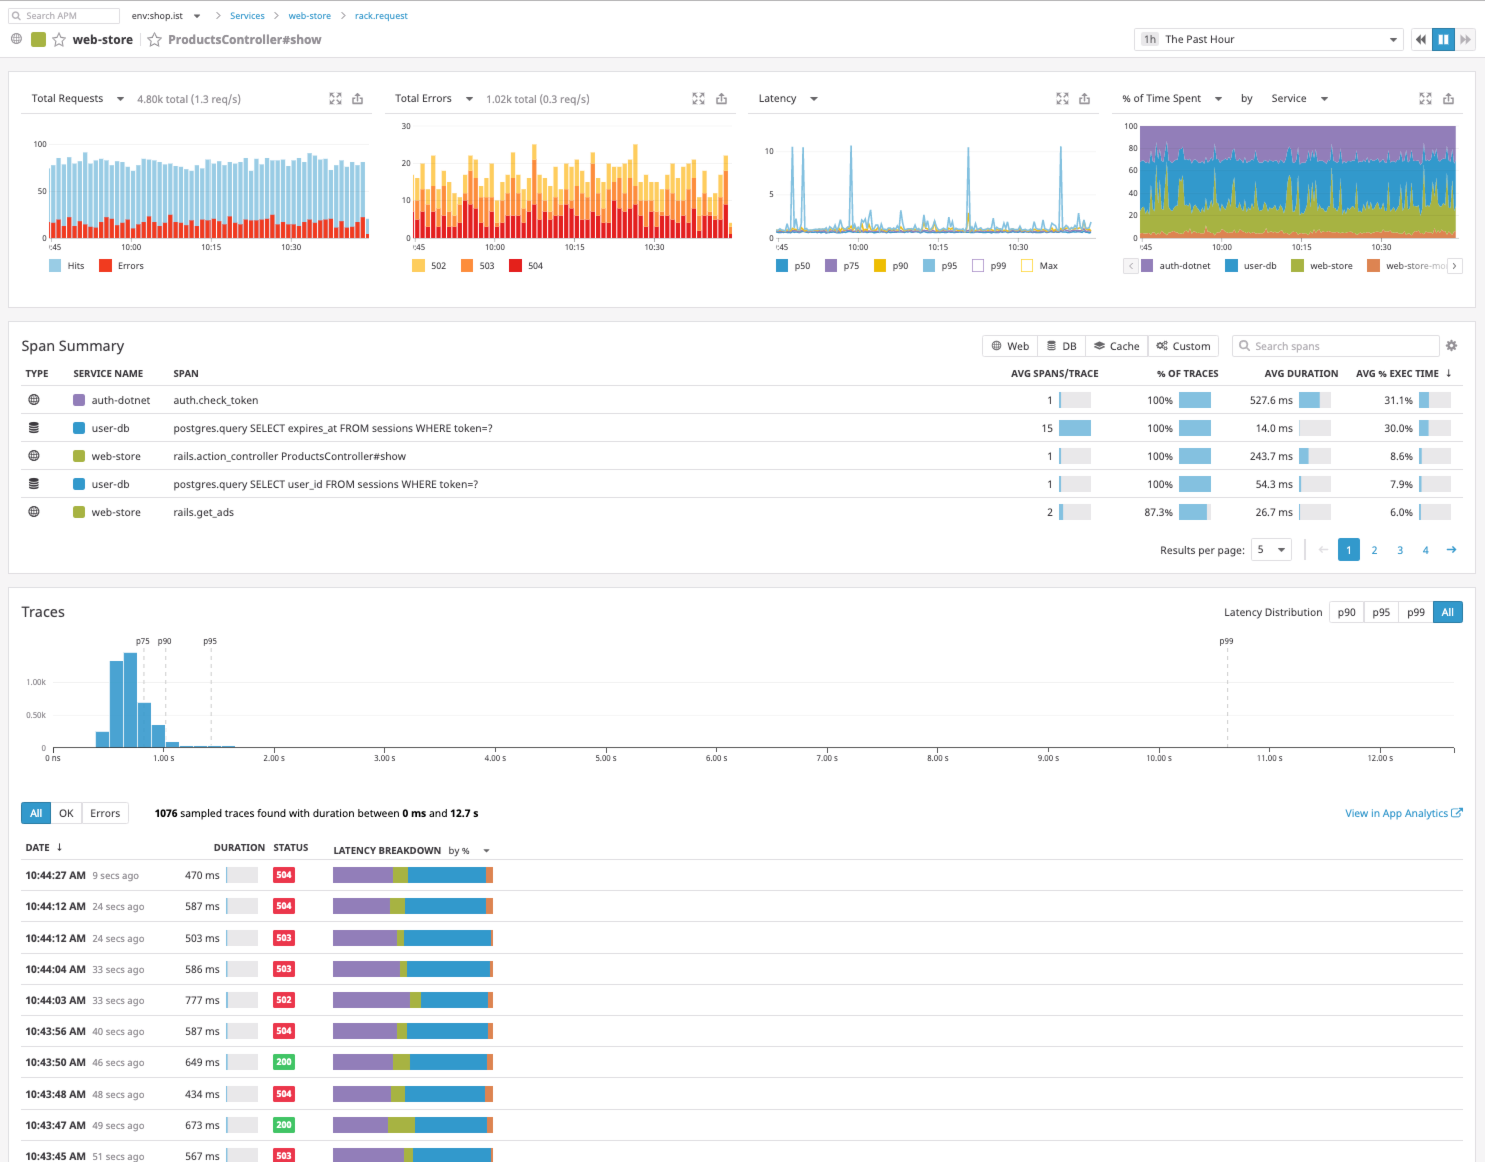
Change Columnsand flip the switch forp99.The Resource page contains high-level metrics about this resource like throughput, latency, error rate, and a breakdown of the time spent on each downstream service from the resource. In addition, it contains the specific traces that pass through the resource and an aggregate view of the spans that make up these traces.
Set the time filter to
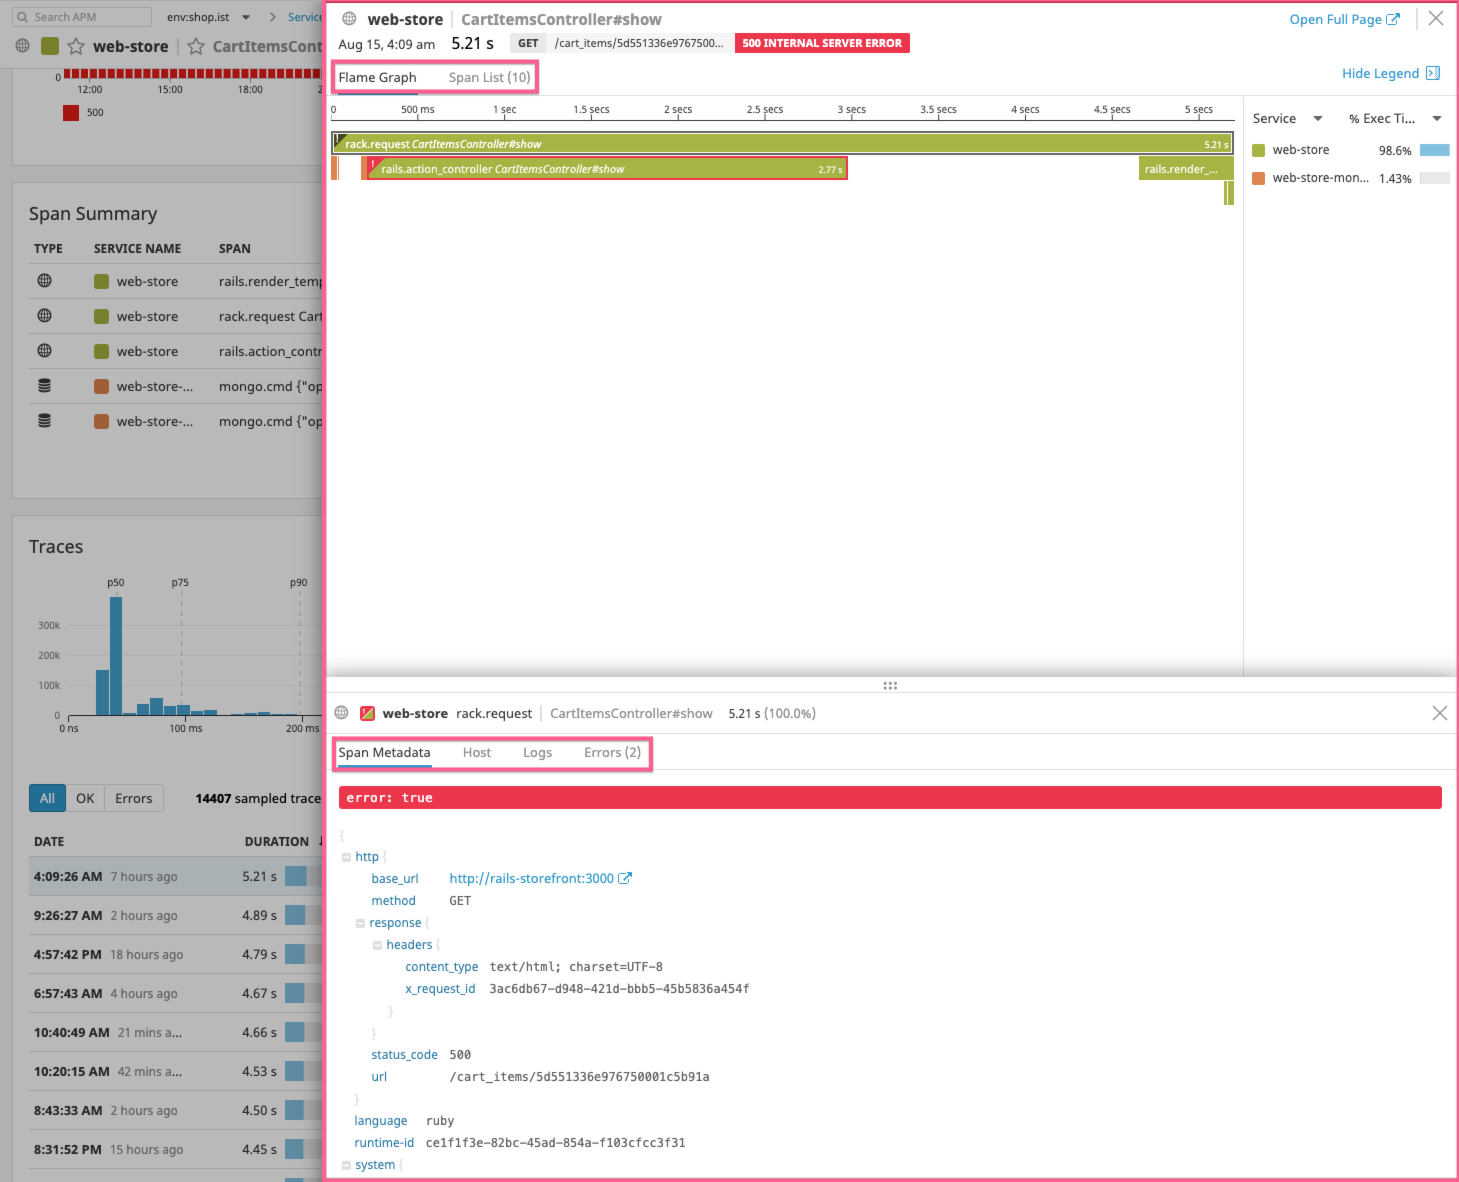
1d One Day. Scroll down to the Traces table and sort it by duration, hover over the top trace in the table and click View TraceThis is the flame graph and associated information. Here you can see the duration of each step in the trace and whether it is erroneous. This is useful in identifying slow components and error-prone ones. The flame graph can be zoomed, scrolled, and explored naturally. Under the flame graph you can see associated metadata, Logs, and Host information.
The flame graph is a great way of identifying the precise piece of your stack that is erroneous or latent. Errors are marked with red highlights and duration is represented by the horizontal length of the span, meaning long spans are the slowest ones. Learn more about using the flame graph in the Trace View guide.
Under the flame graph you can see all of the tags (including custom ones). From here you can also see associated logs (if you connected Logs to your Traces), see host-level information such as CPU and memory usage.
Click into the Host tab, observe the CPU and memory performance of the underlying host while the request was hitting it.
Click Open Host Dashboard to view all relevant data about the host
Datadog APM seamlessly integrates with the other Datadog metrics and information - like infrastructure metrics and Logs. Using the flame graph, this information is available to you as well as any custom metadata you are sending with your traces.
Further Reading
Additional helpful documentation, links, and articles:


