- Essentials
- Getting Started
- Datadog
- Datadog Site
- DevSecOps
- Serverless for AWS Lambda
- Agent
- Integrations
- Containers
- Dashboards
- Monitors
- Logs
- APM Tracing
- Profiler
- Tags
- API
- Service Catalog
- Session Replay
- Continuous Testing
- Synthetic Monitoring
- Incident Management
- Database Monitoring
- Cloud Security Management
- Cloud SIEM
- Application Security Management
- Workflow Automation
- CI Visibility
- Test Visibility
- Intelligent Test Runner
- Code Analysis
- Learning Center
- Support
- Glossary
- Standard Attributes
- Guides
- Agent
- Integrations
- OpenTelemetry
- Developers
- Authorization
- DogStatsD
- Custom Checks
- Integrations
- Create an Agent-based Integration
- Create an API Integration
- Create a Log Pipeline
- Integration Assets Reference
- Build a Marketplace Offering
- Create a Tile
- Create an Integration Dashboard
- Create a Recommended Monitor
- Create a Cloud SIEM Detection Rule
- OAuth for Integrations
- Install Agent Integration Developer Tool
- Service Checks
- IDE Plugins
- Community
- Guides
- API
- Datadog Mobile App
- CoScreen
- Cloudcraft
- In The App
- Dashboards
- Notebooks
- DDSQL Editor
- Sheets
- Monitors and Alerting
- Infrastructure
- Metrics
- Watchdog
- Bits AI
- Service Catalog
- API Catalog
- Error Tracking
- Service Management
- Infrastructure
- Application Performance
- APM
- Continuous Profiler
- Database Monitoring
- Data Streams Monitoring
- Data Jobs Monitoring
- Digital Experience
- Real User Monitoring
- Product Analytics
- Synthetic Testing and Monitoring
- Continuous Testing
- Software Delivery
- CI Visibility
- CD Visibility
- Test Visibility
- Intelligent Test Runner
- Code Analysis
- Quality Gates
- DORA Metrics
- Security
- Security Overview
- Cloud SIEM
- Cloud Security Management
- Application Security Management
- AI Observability
- Log Management
- Observability Pipelines
- Log Management
- Administration
Configuring the Java Tracing Library
After you set up the tracing library with your code and configure the Agent to collect APM data, optionally configure the tracing library as desired, including setting up Unified Service Tagging.
All configuration options below have system property and environment variable equivalents. If the same key type is set for both, the system property configuration takes priority. System properties can be set as JVM flags.
Converting between system properties and environment variables
Unless otherwise stated, you can convert between system properties and environment variables with the following transformations:
- To set a system property as an environment variable, uppercase the property name and replace
.or-with_. For example,dd.servicebecomesDD_SERVICE. - To set an environment variable as a system property, lowercase the variable name and replace
_with.For example,DD_TAGSbecomesdd.tags.
Note: When using the Java tracer’s system properties, list the properties before -jar. This ensures the properties are read in as JVM options.
Configuration options
Unified service tagging
dd.service- Environment Variable:
DD_SERVICE
Default:unnamed-java-app
The name of a set of processes that do the same job. Used for grouping stats for your application. Available for versions 0.50.0+. dd.env- Environment Variable:
DD_ENV
Default:none
Your application environment (for example, production, staging). Available for versions 0.48+. dd.version- Environment Variable:
DD_VERSION
Default:null
Your application version (for example, 2.5, 202003181415, 1.3-alpha). Available for versions 0.48+.
Traces
dd.trace.enabled- Environment Variable:
DD_TRACE_ENABLED
Default:true
Whenfalsetracing agent is disabled. dd.trace.config- Environment Variable:
DD_TRACE_CONFIG
Default:null
Optional path to a file where configuration properties are provided one per each line. For instance, the file path can be provided as via-Ddd.trace.config=<FILE_PATH>.properties, with setting the service name in the file withdd.service=<SERVICE_NAME> dd.service.mapping- Environment Variable:
DD_SERVICE_MAPPING
Default:null
Example:mysql:my-mysql-service-name-db, postgresql:my-postgres-service-name-db
Dynamically rename services via configuration. Useful for making databases have distinct names across different services. dd.writer.type- Environment Variable:
DD_WRITER_TYPE
Default:DDAgentWriter
Default value sends traces to the Agent. Configuring withLoggingWriterinstead writes traces out to the console. dd.trace.agent.port- Environment Variable:
DD_TRACE_AGENT_PORT
Default:8126
The port number the Agent is listening on for configured host. If the Agent configuration setsreceiver_portorDD_APM_RECEIVER_PORTto something other than the default8126, thendd.trace.agent.portordd.trace.agent.urlmust match it. dd.trace.agent.unix.domain.socket- Environment Variable:
DD_TRACE_AGENT_UNIX_DOMAIN_SOCKET
Default:null
This can be used to direct trace traffic to a proxy, to later be sent to a remote Datadog Agent. dd.trace.agent.url- Environment Variable:
DD_TRACE_AGENT_URL
Default:null
The URL to send traces to. If the Agent configuration setsreceiver_portorDD_APM_RECEIVER_PORTto something other than the default8126, thendd.trace.agent.portordd.trace.agent.urlmust match it. The URL value can start withhttp://to connect using HTTP or withunix://to use a Unix Domain Socket. When set this takes precedence overDD_AGENT_HOSTandDD_TRACE_AGENT_PORT. Available for versions 0.65+. dd.trace.agent.timeout- Environment Variable:
DD_TRACE_AGENT_TIMEOUT
Default:10
Timeout in seconds for network interactions with the Datadog Agent. dd.trace.header.tags- Environment Variable:
DD_TRACE_HEADER_TAGS
Default:null
Example:CASE-insensitive-Header:my-tag-name,User-ID:userId,My-Header-And-Tag-Name
Accepts a map of case-insensitive header keys to tag names and automatically applies matching header values as tags on traces. Also accepts entries without a specified tag name that are automatically mapped to tags of the formhttp.request.headers.<header-name>andhttp.response.headers.<header-name>respectively.
Prior to version 0.96.0 this setting only applied to request header tags. To change back to the old behavior, add the setting-Ddd.trace.header.tags.legacy.parsing.enabled=trueor the environment variableDD_TRACE_HEADER_TAGS_LEGACY_PARSING_ENABLED=true.
Beta: Starting in version 1.18.3, if Agent Remote Configuration is enabled where this service runs, you can setDD_TRACE_HEADER_TAGSin the Service Catalog UI. dd.trace.request_header.tags- Environment Variable:
DD_TRACE_REQUEST_HEADER_TAGS
Default:null
Example:CASE-insensitive-Header:my-tag-name,User-ID:userId,My-Header-And-Tag-Name
Accepts a map of case-insensitive header keys to tag names and automatically applies matching request header values as tags on traces. Also accepts entries without a specified tag name that are automatically mapped to tags of the formhttp.request.headers.<header-name>.
Available since version 0.96.0. dd.trace.response_header.tags- Environment Variable:
DD_TRACE_RESPONSE_HEADER_TAGS
Default:null
Example:CASE-insensitive-Header:my-tag-name,User-ID:userId,My-Header-And-Tag-Name
Accepts a map of case-insensitive header keys to tag names and automatically applies matching response header values as tags on traces. Also accepts entries without a specified tag name that are automatically mapped to tags of the formhttp.response.headers.<header-name>.
Available since version 0.96.0. dd.trace.header.baggage- Environment Variable:
DD_TRACE_HEADER_BAGGAGE
Default:null
Example:CASE-insensitive-Header:my-baggage-name,User-ID:userId,My-Header-And-Baggage-Name
Accepts a map of case-insensitive header keys to baggage keys and automatically applies matching request header values as baggage on traces. On propagation the reverse mapping is applied: Baggage is mapped to headers.
Available since version 1.3.0. dd.trace.annotations- Environment Variable:
DD_TRACE_ANNOTATIONS
Default: (listed here)
Example:com.some.Trace;io.other.Trace
A list of method annotations to treat as@Trace. dd.trace.methods- Environment Variable:
DD_TRACE_METHODS
Default:null
Example:package.ClassName[method1,method2,...];AnonymousClass$1[call];package.ClassName[*]
List of class/interface and methods to trace. Similar to adding@Trace, but without changing code. Note: The wildcard method support ([*]) does not accommodate constructors, getters, setters, synthetic, toString, equals, hashcode, or finalizer method calls dd.trace.classes.exclude- Environment Variable:
DD_TRACE_CLASSES_EXCLUDE
Default:null
Example:package.ClassName,package.ClassName$Nested,package.Foo*,package.other.*
A list of fully qualified classes (that may end with a wildcard to denote a prefix) which will be ignored (not modified) by the tracer. Must use the jvm internal representation for names (eg package.ClassName$Nested and not package.ClassName.Nested) dd.trace.partial.flush.min.spans- Environment Variable:
DD_TRACE_PARTIAL_FLUSH_MIN_SPANS
Default:1000
Set a number of partial spans to flush on. Useful to reduce memory overhead when dealing with heavy traffic or long running traces. dd.trace.split-by-tags- Environment Variable:
DD_TRACE_SPLIT_BY_TAGS
Default:null
Example:aws.service
Used to rename the service name associated with spans to be identified with the corresponding span tag dd.trace.health.metrics.enabled- Environment Variable:
DD_TRACE_HEALTH_METRICS_ENABLED
Default:true
When set totruesends tracer health metrics dd.trace.health.metrics.statsd.host- Environment Variable:
DD_TRACE_HEALTH_METRICS_STATSD_HOST
Default: Same asdd.jmxfetch.statsd.host
Statsd host to send health metrics to dd.trace.health.metrics.statsd.port- Environment Variable:
DD_TRACE_HEALTH_METRICS_STATSD_PORT
Default: Same asdd.jmxfetch.statsd.port
Statsd port to send health metrics to dd.trace.obfuscation.query.string.regexp- Environment Variable:
DD_TRACE_OBFUSCATION_QUERY_STRING_REGEXP
Default:null
A regex to redact sensitive data from incoming requests’ query string reported in thehttp.urltag (matches are replaced with). dd.trace.servlet.async-timeout.error- Environment Variable:
DD_TRACE_SERVLET_ASYNC_TIMEOUT_ERROR
Default:true
By default, long running asynchronous requests will be marked as an error, setting this value to false allows to mark all timeouts as successful requests. dd.trace.startup.logs- Environment Variable:
DD_TRACE_STARTUP_LOGS
Default:true
Whenfalse, informational startup logging is disabled. Available for versions 0.64+. dd.trace.servlet.principal.enabled- Environment Variable:
DD_TRACE_SERVLET_PRINCIPAL_ENABLED
Default:false
Whentrue, user principal is collected. Available for versions 0.61+. dd.trace.rate.limit- Environment Variable:
DD_TRACE_RATE_LIMIT
Default:100
Maximum number of spans to sample per second, per process, whenDD_TRACE_SAMPLING_RULESorDD_TRACE_SAMPLE_RATEis set. Otherwise, the Datadog Agent controls rate limiting. dd.http.server.tag.query-string- Environment Variable:
DD_HTTP_SERVER_TAG_QUERY_STRING
Default:true
When set totruequery string parameters and fragment get added to web server spans dd.http.server.route-based-naming- Environment Variable:
DD_HTTP_SERVER_ROUTE_BASED_NAMING
Default:true
When set tofalsehttp framework routes are not used for resource names. This can change resource names and derived metrics if changed. dd.trace.128.bit.traceid.generation.enabled- Environment Variable:
DD_TRACE_128_BIT_TRACEID_GENERATION_ENABLED
Default:true
Whentrue, the tracer generates 128 bit Trace IDs, and encodes Trace IDs as 32 lowercase hexadecimal characters with zero padding. dd.trace.128.bit.traceid.logging.enabled- Environment Variable:
DD_TRACE_128_BIT_TRACEID_LOGGING_ENABLED
Default:false
Whentrue, the tracer will inject 128 bit Trace IDs as 32 lowercase hexadecimal characters with zero padding, and 64 bit Trace IDs as decimal numbers. Otherwise, the tracer always injects Trace IDs as decimal numbers. dd.trace.otel.enabled- Environment Variable:
DD_TRACE_OTEL_ENABLED
Default:false
Whentrue, OpenTelemetry-based tracing for custom instrumentation is enabled.
Agent
dd.tags- Environment Variable:
DD_TAGS
Default:null
Example:layer:api,team:intake,key:value
A list of default tags to be added to every span, profile, and JMX metric. If DD_ENV or DD_VERSION is used, it overrides any env or version tag defined in DD_TAGS. Available for versions 0.50.0+. dd.agent.host- Environment Variable:
DD_AGENT_HOST
Default:localhost
Hostname for where to send traces to. If using a containerized environment, configure this to be the host IP. See Tracing Docker Applications for more details. dd.instrumentation.telemetry.enabled- Environment Variable:
DD_INSTRUMENTATION_TELEMETRY_ENABLED
Default:true
Whentrue, the tracer collects telemetry data. Available for versions 0.104+. Defaults totruefor versions 0.115+.
Databases
dd.trace.db.client.split-by-instance- Environment Variable:
DD_TRACE_DB_CLIENT_SPLIT_BY_INSTANCE
Default:false
When set totruedb spans get assigned the instance name as the service name dd.trace.db.client.split-by-host- Environment Variable:
DD_TRACE_DB_CLIENT_SPLIT_BY_HOST
Default:false
When set totruedb spans get assigned the remote database hostname as the service name
Errors
dd.http.client.tag.query-string- Environment Variable:
DD_HTTP_CLIENT_TAG_QUERY_STRING
Default:false
When set totruequery string parameters and fragment get added to web client spans dd.http.client.error.statuses- Environment Variable:
DD_HTTP_CLIENT_ERROR_STATUSES
Default:400-499
A range of errors can be accepted. By default 4xx errors are reported as errors for http clients. This configuration overrides that. Ex.dd.http.client.error.statuses=400-403,405,410-499 dd.http.server.error.statuses- Environment Variable:
DD_HTTP_SERVER_ERROR_STATUSES
Default:500-599
A range of errors can be accepted. By default 5xx status codes are reported as errors for http servers. This configuration overrides that. Ex.dd.http.server.error.statuses=500,502-599 dd.grpc.client.error.statuses- Environment Variable:
DD_GRPC_CLIENT_ERROR_STATUSES
Default:1-16
A range of errors can be accepted. By default, gRPC status codes 1 to 16 are reported as errors for gRPC clients. This configuration overrides that. Ex.dd.grpc.client.error.statuses=1-4,7-10 dd.grpc.server.error.statuses- Environment Variable:
DD_GRPC_SERVER_ERROR_STATUSES
Default:2-16
A range of errors can be accepted. By default, gRPC status codes 2 to 16 are reported as errors for gRPC servers. This configuration overrides that. Ex.dd.grpc.server.error.statuses=2-4,7-10
Logs
dd.logs.injection- Environment Variable:
DD_LOGS_INJECTION
Default:true
Enabled automatic MDC key injection for Datadog trace and span IDs. See Advanced Usage for details.
Beta: Starting in version 1.18.3, if Agent Remote Configuration is enabled where this service runs, you can setDD_LOGS_INJECTIONin the Service Catalog UI.
Trace context propagation
For information about valid values and using the following configuration options, see Propagating Java Trace Context.
dd.trace.propagation.style.inject- Environment Variable:
DD_TRACE_PROPAGATION_STYLE_INJECT
Default:datadog,tracecontext
A comma-separated list of header formats to include to propagate distributed traces between services.
Available since version 1.9.0 dd.trace.propagation.style.extract- Environment Variable:
DD_TRACE_PROPAGATION_STYLE_EXTRACT
Default:datadog,tracecontext
A comma-separated list of header formats from which to attempt to extract distributed tracing propagation data. The first format found with complete and valid headers is used to define the trace to continue.
Available since version 1.9.0 dd.trace.propagation.style- Environment Variable:
DD_TRACE_PROPAGATION_STYLE
Default:datadog,tracecontext
A comma-separated list of header formats from which to attempt to inject and extract distributed tracing propagation data. The first format found with complete and valid headers is used to define the trace to continue. The more specificdd.trace.propagation.style.injectanddd.trace.propagation.style.extractconfiguration settings take priority when present.
Available since version 1.9.0 trace.propagation.extract.first- Environment Variable:
DD_TRACE_PROPAGATION_EXTRACT_FIRST
Default:false
When set totrue, stop extracting trace context when a valid one is found.
JMX metrics
dd.jmxfetch.enabled- Environment Variable:
DD_JMXFETCH_ENABLED
Default:true
Enable collection of JMX metrics by Java Tracing Agent. dd.jmxfetch.config.dir- Environment Variable:
DD_JMXFETCH_CONFIG_DIR
Default:null
Example:/path/to/directory/etc/conf.d
Additional configuration directory for JMX metrics collection. The Java Agent looks forjvm_direct:truein theinstancesection in theyamlfile to change configuration. dd.jmxfetch.config- Environment Variable:
DD_JMXFETCH_CONFIG
Default:null
Example:path/to/file/conf.yaml,other/path/to/file/conf.yaml
Additional metrics configuration file for JMX metrics collection. The Java Agent looks forjvm_direct:truein theinstancesection in theyamlfile to change configuration. dd.jmxfetch.check-period- Environment Variable:
DD_JMXFETCH_CHECK_PERIOD
Default:1500
How often to send JMX metrics (in ms). dd.jmxfetch.refresh-beans-period- Environment Variable:
DD_JMXFETCH_REFRESH_BEANS_PERIOD
Default:600
How often to refresh list of available JMX beans (in seconds). dd.jmxfetch.statsd.host- Environment Variable:
DD_JMXFETCH_STATSD_HOST
Default: Same asagent.host
Statsd host to send JMX metrics to. If you are using Unix Domain Sockets, use an argument like ‘unix://PATH_TO_UDS_SOCKET’. Example:unix:///var/datadog-agent/dsd.socket dd.jmxfetch.statsd.port- Environment Variable:
DD_JMXFETCH_STATSD_PORT
Default:8125
StatsD port to send JMX metrics to. If you are using Unix Domain Sockets, input 0. dd.jmxfetch.<integration-name>.enabled- Environment Variable:
DD_JMXFETCH_<INTEGRATION_NAME>_ENABLED
Default:false
JMX integration to enable (for example, Kafka or ActiveMQ).
Integrations
See how to disable integrations in the integrations compatibility section.
dd.integration.opentracing.enabled- Environment Variable:
DD_INTEGRATION_OPENTRACING_ENABLED
Default:true
By default the tracing client detects if a GlobalTracer is being loaded and dynamically registers a tracer into it. By turning this to false, this removes any tracer dependency on OpenTracing. dd.hystrix.tags.enabled- Environment Variable:
DD_HYSTRIX_TAGS_ENABLED
Default:false
By default the Hystrix group, command, and circuit state tags are not enabled. This property enables them. dd.trace.elasticsearch.body.enabled- Environment Variable:
DD_TRACE_ELASTICSEARCH_BODY_ENABLED
Default:false
When set totrue, the body is added to Elasticsearch and OpenSearch spans. dd.trace.elasticsearch.params.enabled- Environment Variable:
DD_TRACE_ELASTICSEARCH_PARAMS_ENABLED
Default:true
When set totrue, the query string parameters are added to Elasticsearch and OpenSearch spans.
Note:
If the same key type is set for both, the system property configuration takes priority.
System properties can be used as JVM parameters.
By default, JMX metrics from your application are sent to the Datadog Agent thanks to DogStatsD over port
8125. Make sure that DogStatsD is enabled for the Agent.- If you are running the Agent as a container, ensure that
DD_DOGSTATSD_NON_LOCAL_TRAFFICis set totrue, and that port8125is open on the Agent container. - In Kubernetes, bind the DogStatsD port to a host port; in ECS, set the appropriate flags in your task definition.
- If you are running the Agent as a container, ensure that
Examples
dd.service.mapping
Example with system property:
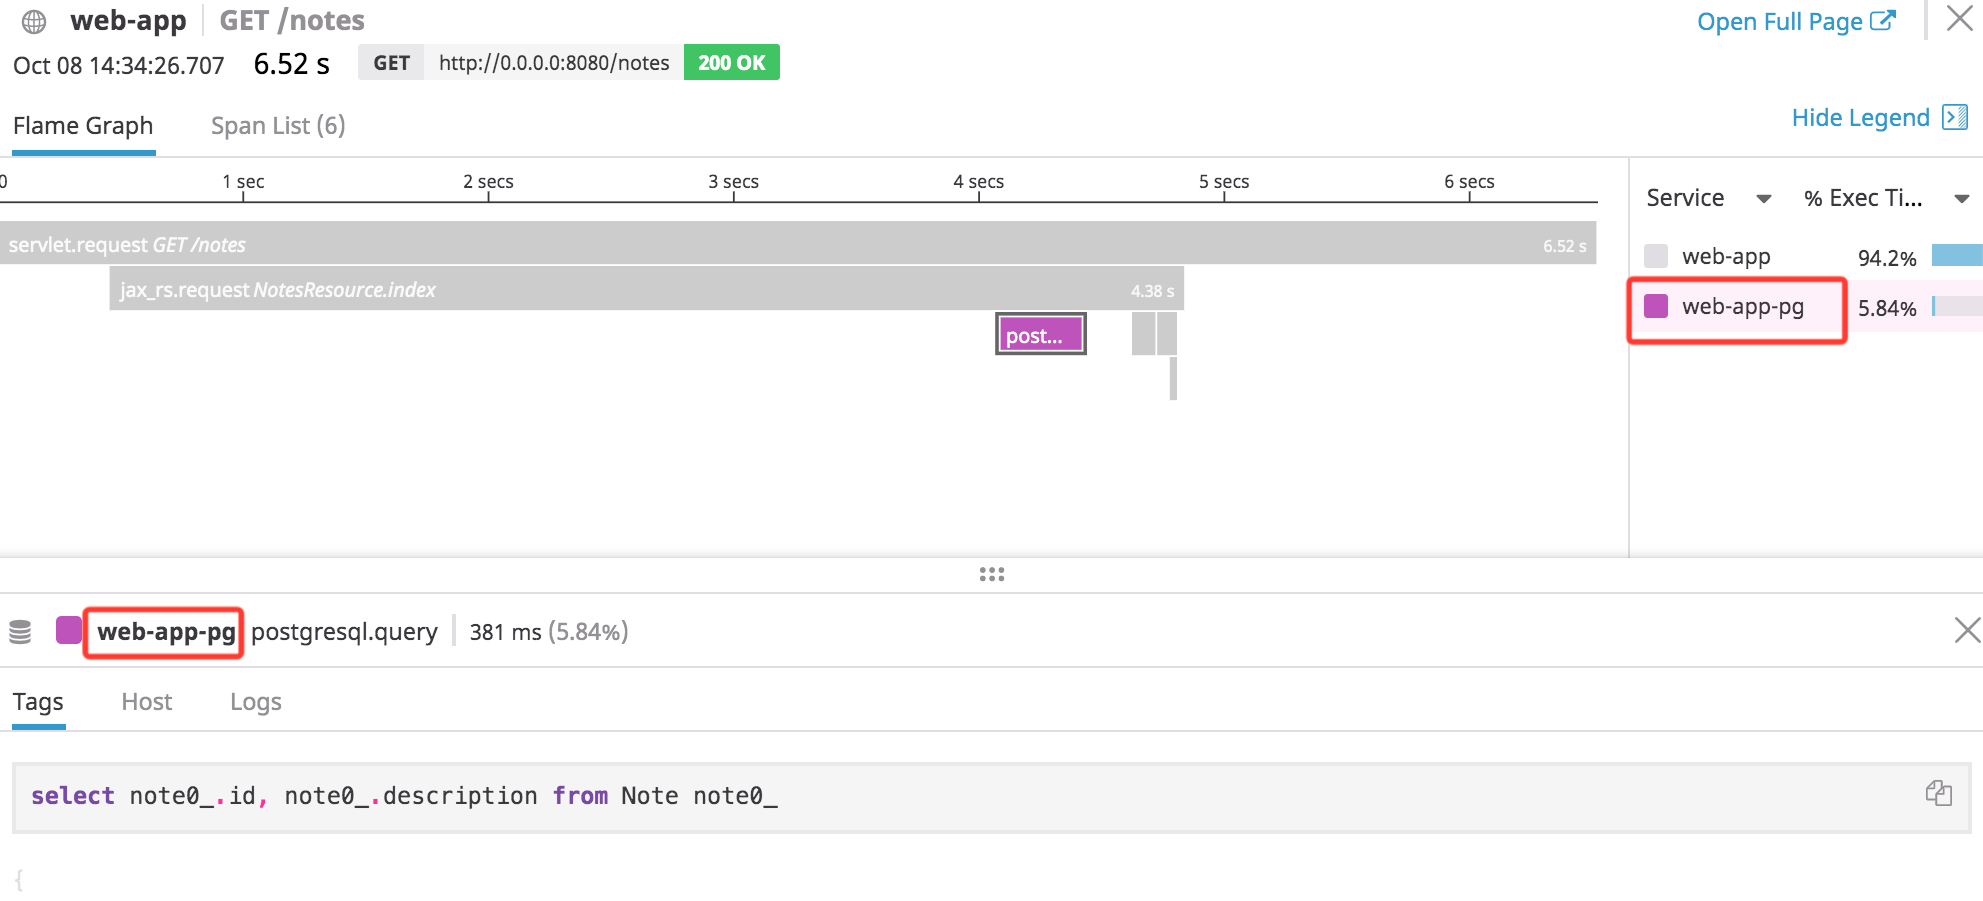
java -javaagent:/path/to/dd-java-agent.jar -Ddd.service=web-app -Ddd.service.mapping=postgresql:web-app-pg -jar path/to/application.jar
dd.tags
Setting a global env for spans and JMX metrics:
java -javaagent:/path/to/dd-java-agent.jar -Ddd.service=web-app -Ddd.env=dev -jar path/to/application.jar
dd.trace.span.tags
Example with adding project:test to every span:
java -javaagent:/path/to/dd-java-agent.jar -Ddd.service=web-app -Ddd.env=dev -Ddd.trace.span.tags=project:test -jar path/to/application.jar
dd.trace.jmx.tags
Setting custom.type:2 on a JMX metric:
java -javaagent:/path/to/dd-java-agent.jar -Ddd.service=web-app -Ddd.env=dev -Ddd.trace.span.tags=project:test -Ddd.trace.jmx.tags=custom.type:2 -jar path/to/application.jar
dd.trace.methods
Example with system property:
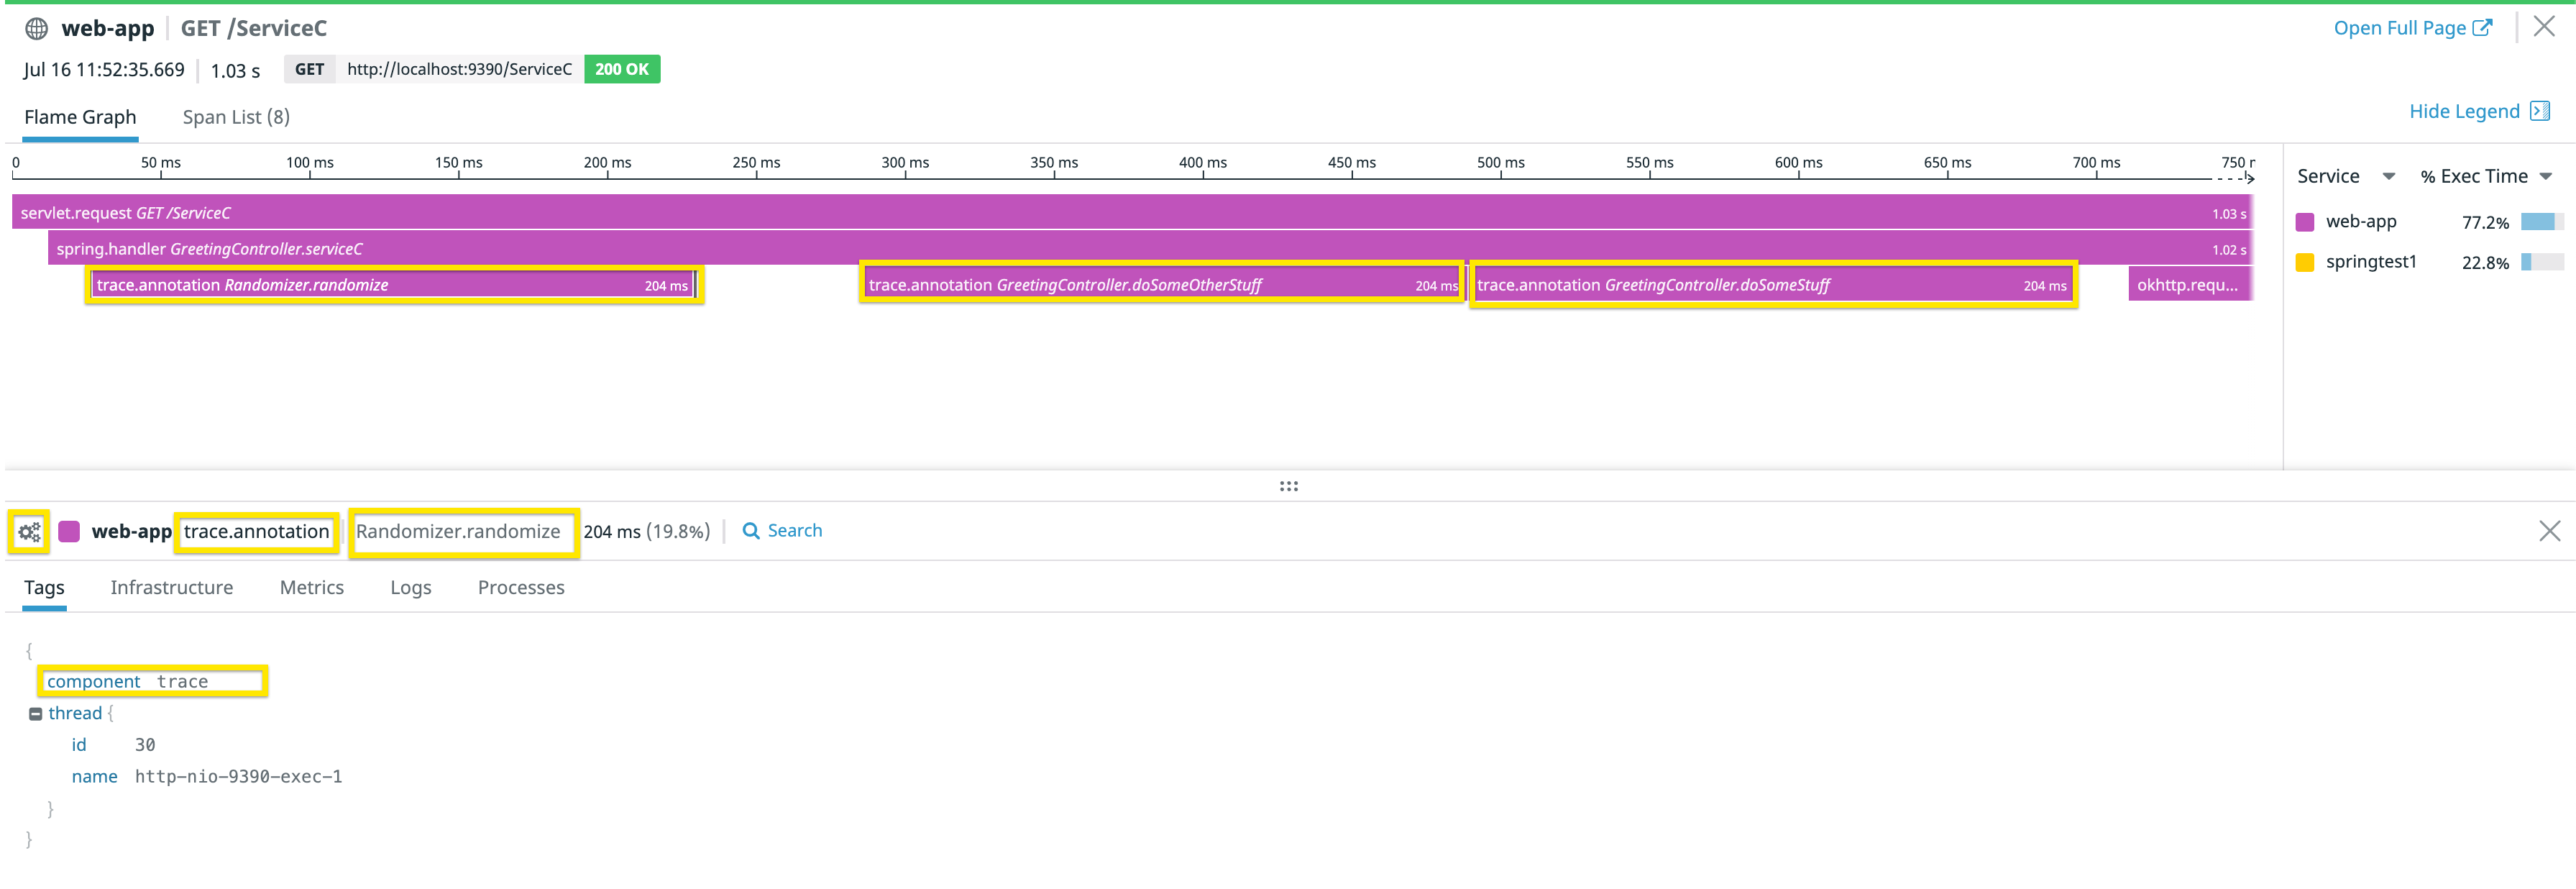
java -javaagent:/path/to/dd-java-agent.jar -Ddd.service=web-app -Ddd.env=dev -Ddd.trace.methods="hello.GreetingController[doSomeStuff,doSomeOtherStuff];hello.Randomizer[randomize]" -jar path/to/application.jar
dd.trace.db.client.split-by-instance
Example with system property:
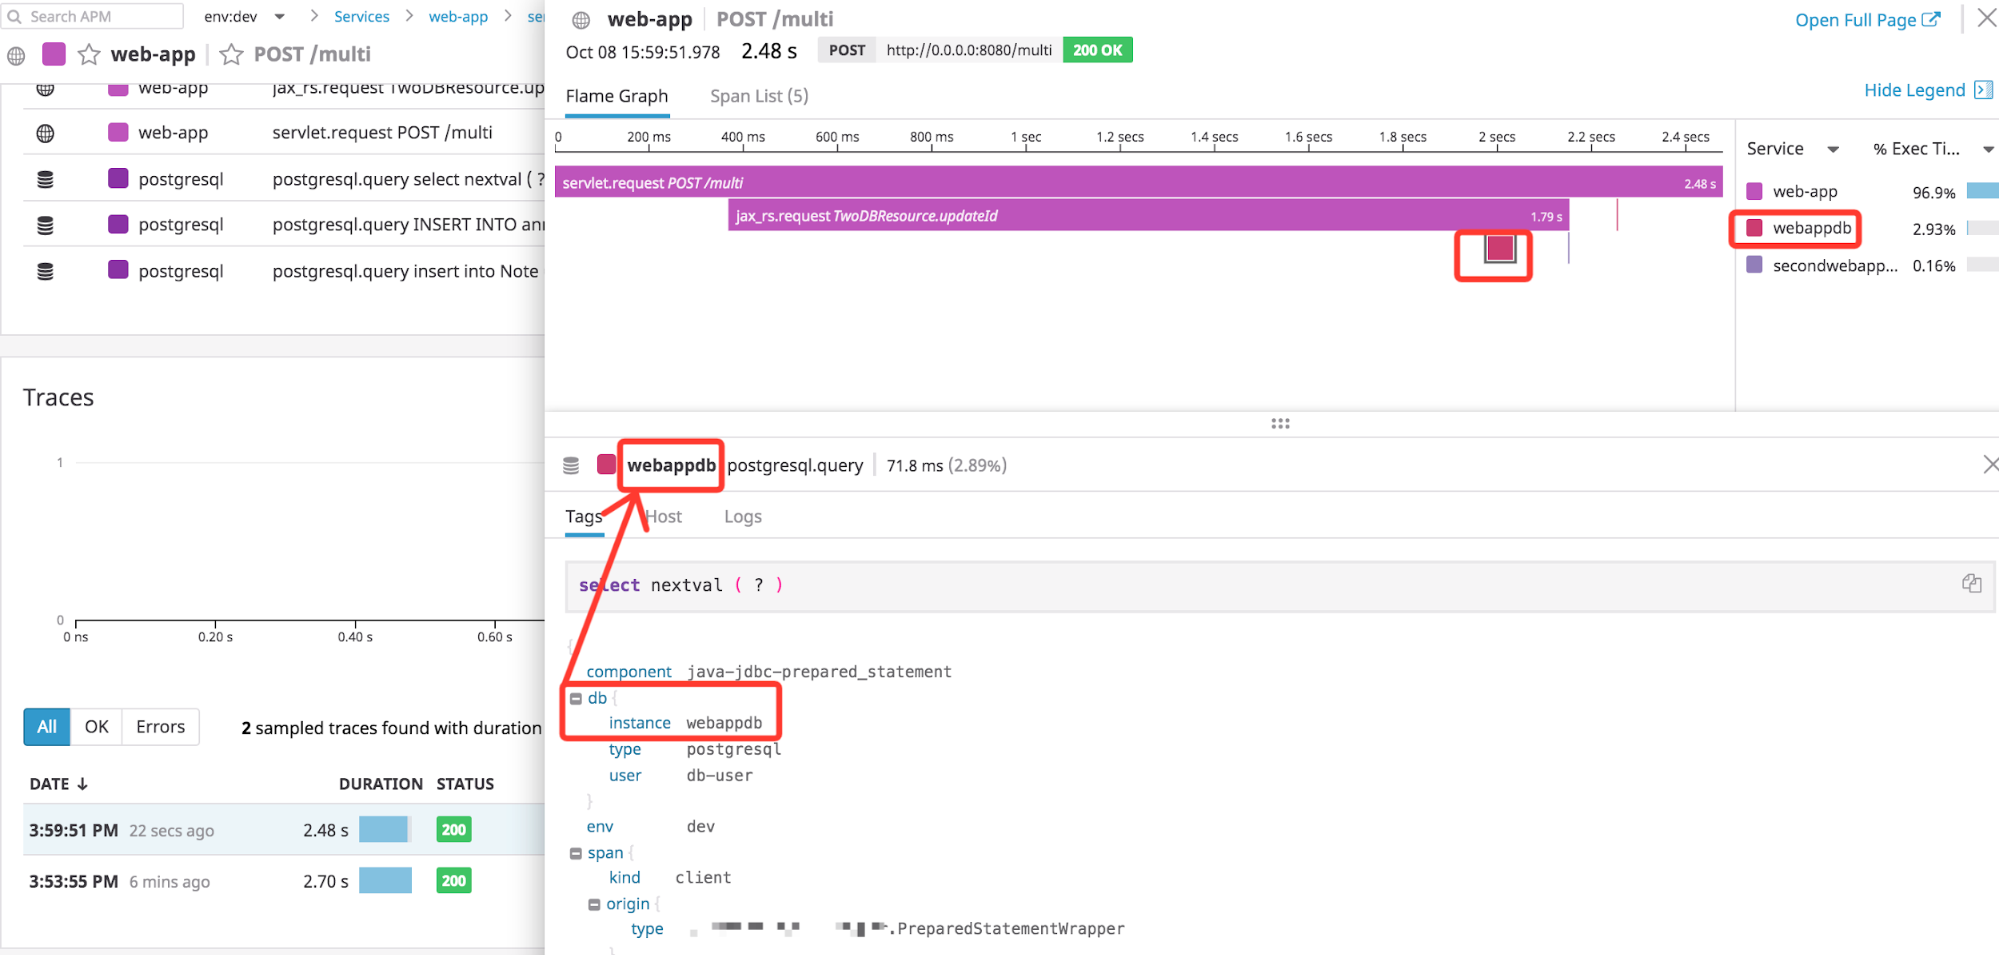
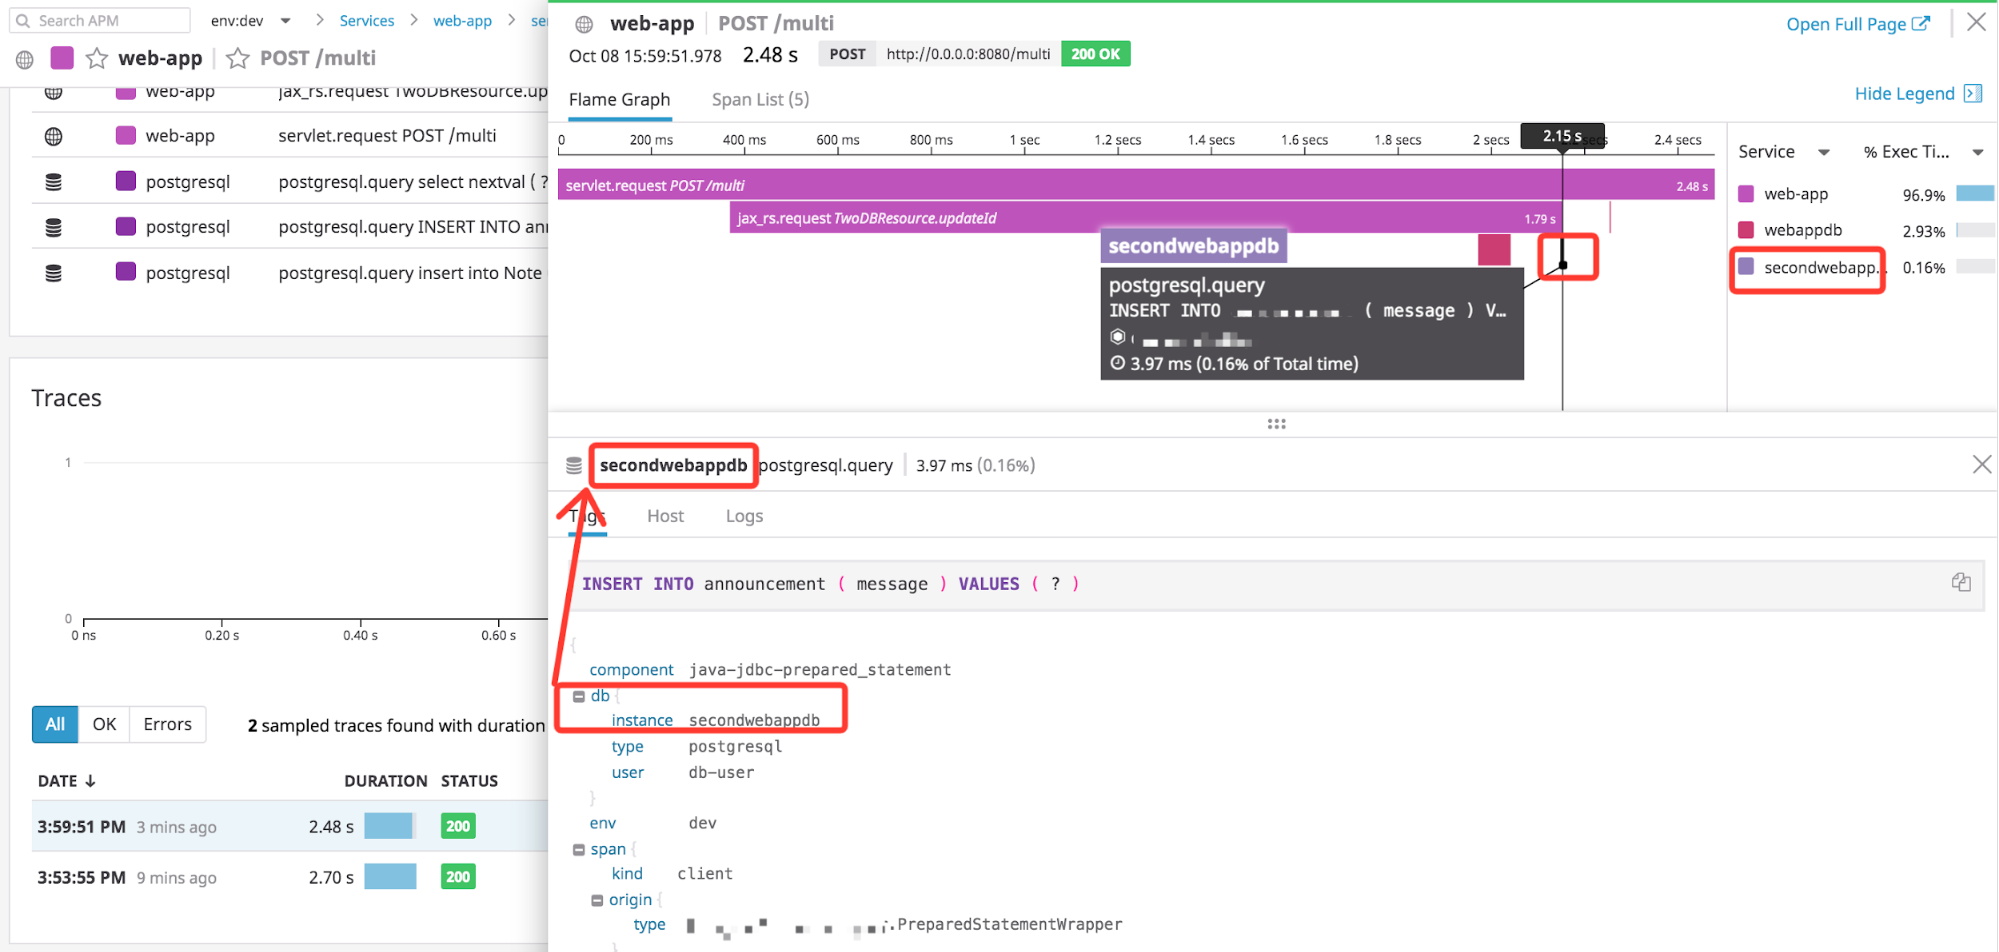
java -javaagent:/path/to/dd-java-agent.jar -Ddd.env=dev -Ddd.service=web-app -Ddd.trace.db.client.split-by-instance=TRUE -jar path/to/application.jar
DB Instance 1, webappdb, now gets its own service name that is the same as the db.instance span metadata:
DB Instance 2, secondwebappdb, now gets its own service name that is the same as the db.instance span metadata:
Similarly on the service map, you would now see one web app making calls to two different Postgres databases.
dd.http.server.tag.query-string
Example with system property:
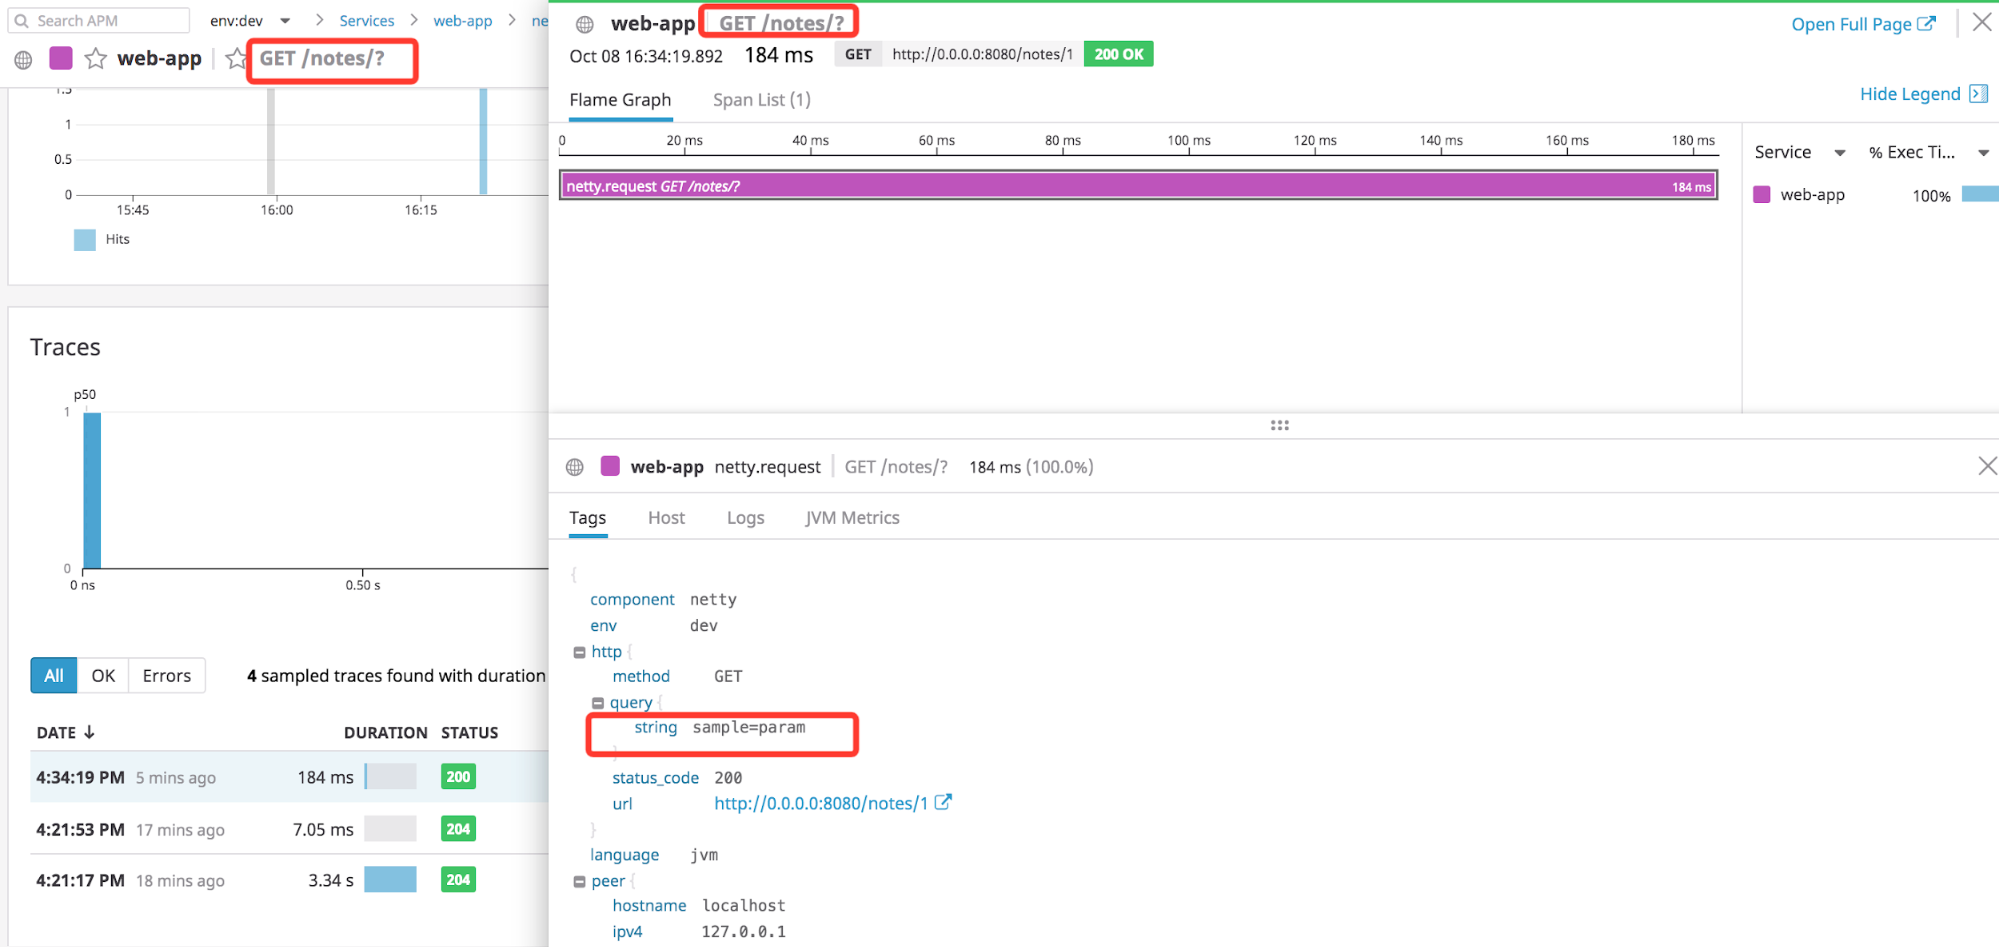
java -javaagent:/path/to/dd-java-agent.jar -Ddd.service=web-app -Ddd.env=dev -Ddd.http.server.tag.query-string=TRUE -jar path/to/application.jar
dd.trace.enabled
Example with system property and debug app mode:
java -javaagent:/path/to/dd-java-agent.jar -Ddd.trace.enabled=false -Ddatadog.slf4j.simpleLogger.defaultLogLevel=debug -jar path/to/application.jar
Debug app logs show that Tracing is disabled, not installing instrumentations.
dd.jmxfetch.config.dir and dd.jmxfetch.config
Example configuration:
- Either the combination of:
DD_JMXFETCH_CONFIG_DIR=<DIRECTORY_PATH>+DD_JMXFETCH_CONFIG=conf.yaml - Or directly:
DD_JMXFETCH_CONFIG=<DIRECTORY_PATH>/conf.yaml
With the following content for conf.yaml:
init_config:
instances:
    - jvm_direct: true
      port: '<PORT>'
      conf:
          - include:
                bean:
                    - java.lang:type=MemoryPool,name=Metaspace
                attribute:
                    Usage.used:
                        metric_type: gauge
                        alias: sb.usage.used
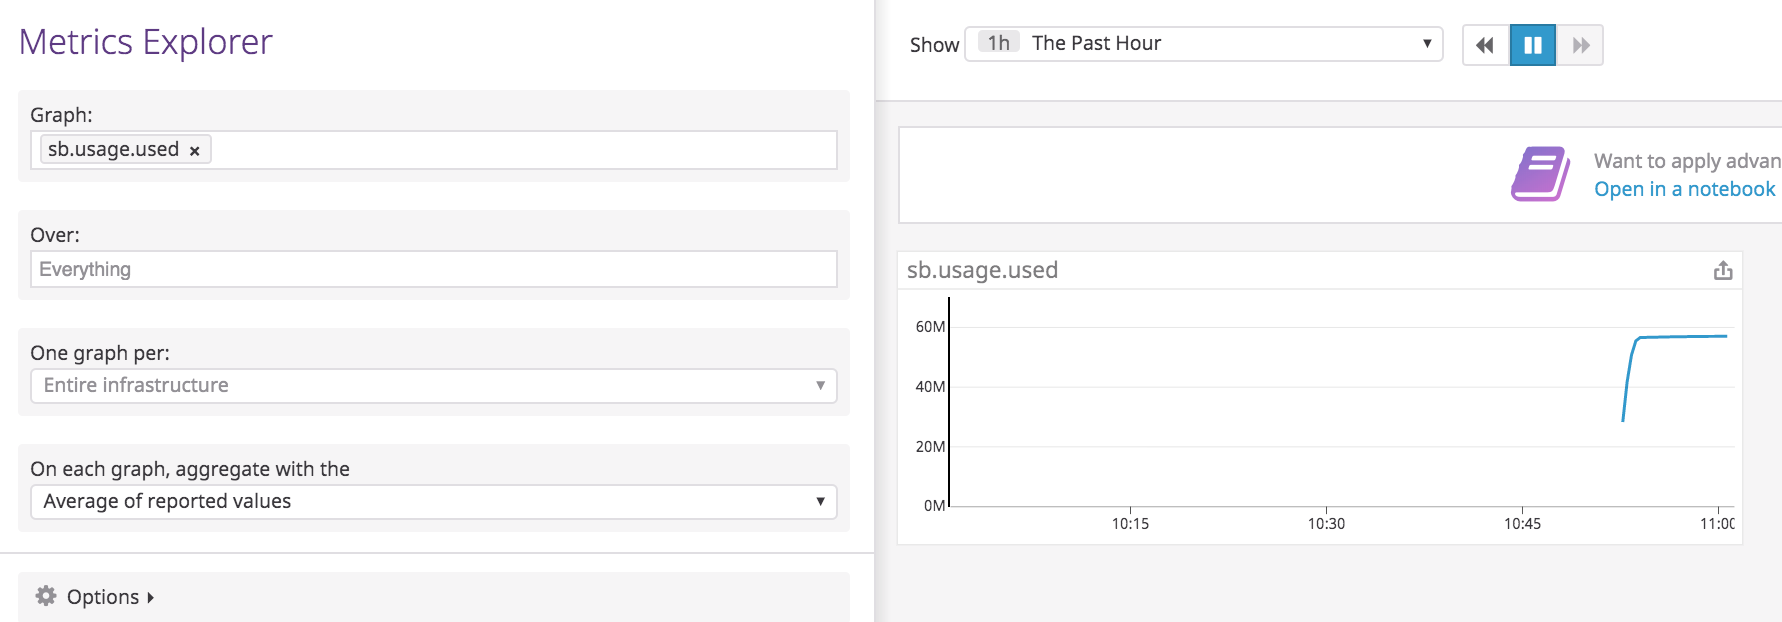
Would produce the following result:
See the Java integration documentation to learn more about Java metrics collection with JMX fetch.
Deprecated extraction and injection settings
These extraction and injection settings have been deprecated in favor of the dd.trace.propagation.style.inject, dd.trace.propagation.style.extract, and dd.trace.propagation.style settings since version 1.9.0. See Propagating Java Trace Context. The previous b3 setting for both B3 multi header and B3 single header has been replaced with the new settings b3multi and b3single.
dd.propagation.style.inject- Environment Variable:
DD_PROPAGATION_STYLE_INJECT
Default:datadog
A comma-separated list of header formats to include to propagate distributed traces between services.
Deprecated since version 1.9.0 dd.propagation.style.extract- Environment Variable:
DD_PROPAGATION_STYLE_EXTRACT
Default:datadog
A comma-separated list of header formats from which to attempt to extract distributed tracing propagation data. The first format found with complete and valid headers is used to define the trace to continue.
Deprecated since version 1.9.0
Further Reading
Additional helpful documentation, links, and articles:
