marketplace
The main Hardware dashboard provides an overview of the energy usage and carbon emissions of all data centers and server rooms. It leverages the metrics collected by MetricsHub.
Architecture diagram: MetricsHub runs on-prem, monitors your servers, switches and storage systems, and pushes metrics to your Datadog environment.
MetricsHub monitors Windows and Linux systems in details, allowing administrators to prevent failures and quickly troubleshoot performance and capacity issues. Hundreds of remote Linux and Windows systems can be monitored from one single instance of MetricsHub.
The system performance dashboard is designed to support several hosts at once, allowing administrators to easily assess the performance of clustered systems.
For each monitored host, MetricsHub monitors its electronic components (CPUs, memory, disks, NICs, sensors, etc.), its power consumption, system, and carbon emissions.
For each site (data center or server room), energy and carbon emissions are estimated for 1 day, 1 month and 1 year. Recommendation of optimal temperature is made with its potential energy savings over a year.
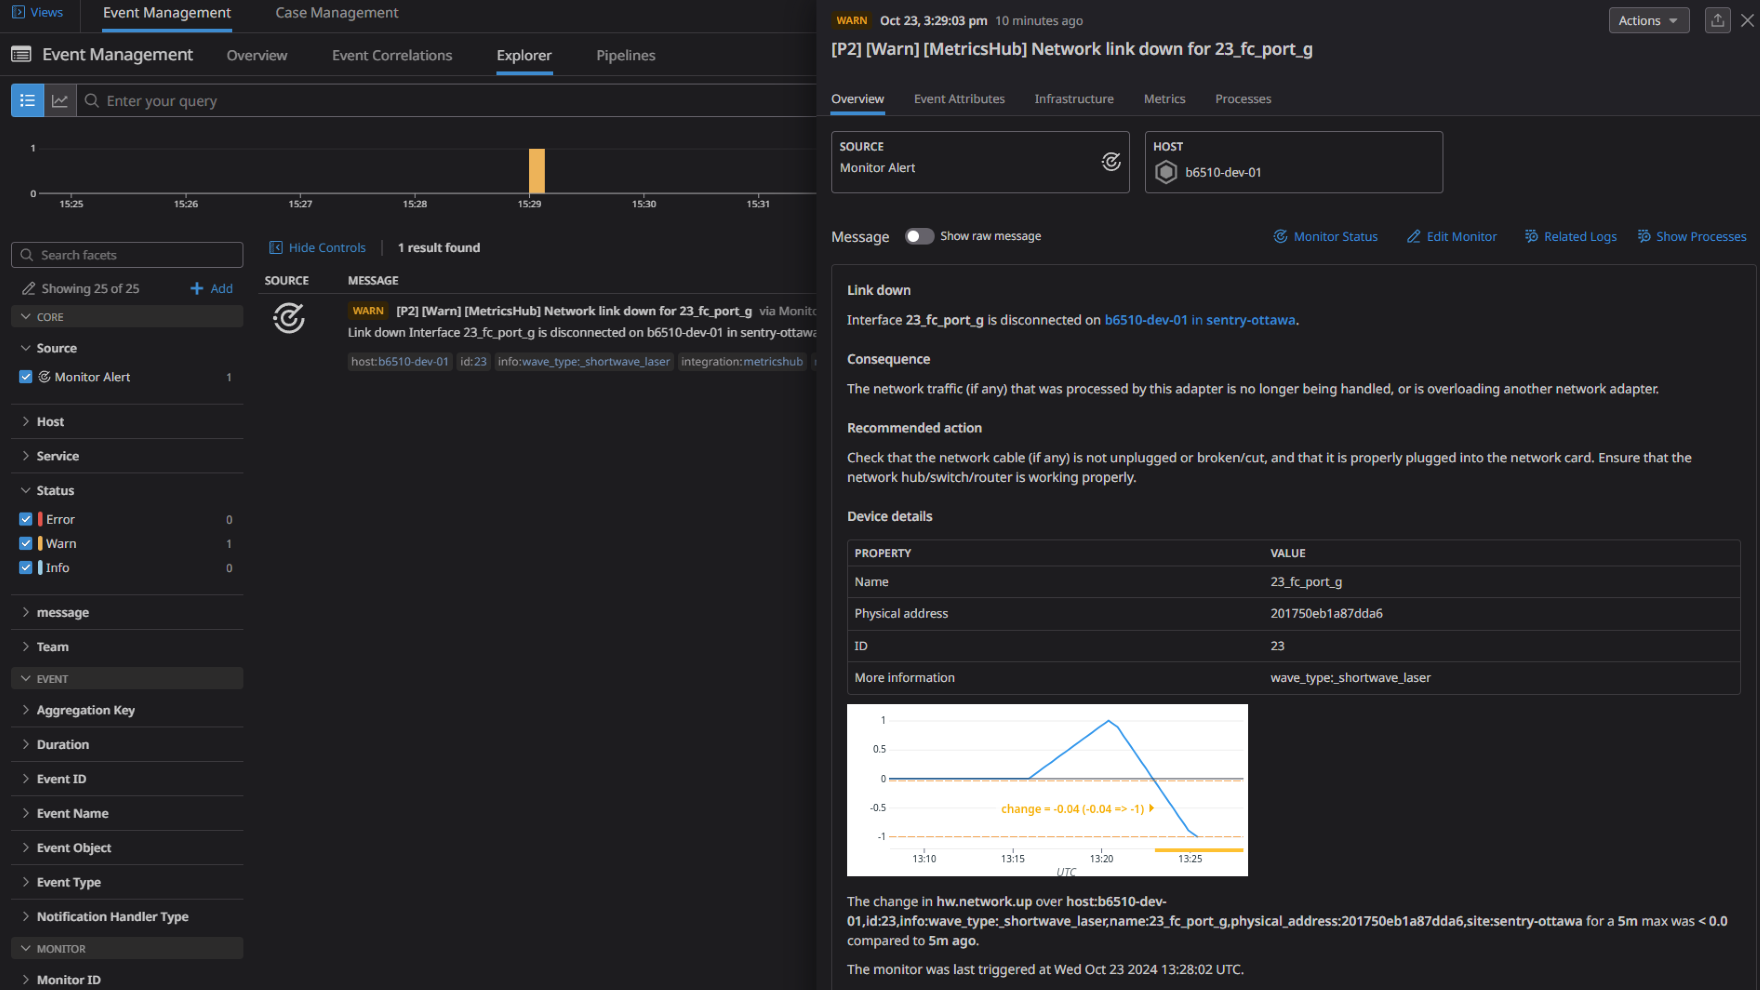
All hardware problems (disks, memory modules, NICs, power supplies, etc.) are monitored with specific monitors, with detailed messages.
The MetricsHub integration comes with a collection of recommended monitors to report hardware problems in your infrastructure.
Overview
MetricsHub® is a universal infrastructure monitoring agent designed to give Datadog deep visibility across your entire IT stack.
It captures and forwards comprehensive telemetry—from server hardware health and database performance to network devices, storage systems, energy usage, and sustainability KPIs. Its rich telemetry enables unified observability in Datadog, helping teams optimize operations, ensure uptime, and meet sustainability goals.
Key features
- Remote Monitoring: MetricsHub supports the monitoring of thousands of systems remotely through protocols such as REST APIs, SNMP, WBEM, WMI, SSH, IPMI, and more.
- 250+ Connectors: Ready-to-use connectors for monitoring a wide variety of platforms. MetricsHub agent is truly vendor-neutral, providing consistent coverage for all manufacturers (for example, Cisco, Dell EMC, Huawei, HP, IBM, Lenovo, Pure, and more).
- OpenTelemetry Integration: MetricsHub pushes collected metrics as OpenTelemetry metrics, following its standards, protocol and semantic conventions, for easy integration with various observability platforms.
- Sustainability Metrics: Track and report on energy usage and carbon footprint to optimize infrastructure efficiency.
| Type | Platforms |
|---|
| Server | Fujitsu PRIMERGY, Cisco UCS, Dell PowerEdge, Hitachi Compute, HPE BladeSystem, HPE ProLiant, HP-UX, HPE Alletra 9000, HPE Integrity, HPE SuperDome, HPE Synergy, Huawei E Series, Huawei FusionCube, Huawei FusionServer, Huawei KunLun, Huawei TaiShan, Huawei X Series, Huawei xFusion, IBM POWER, IBM BladeCenter, IBM DataPower, IBM xSeries, Intel, IPMI, Lenovo, Lenovo ThinkSystem, Sun/Oracle Servers, NEC Express 5800, Nvidia, Oracle Networking, Quanta, RedFish, SuperMicro |
| System | Linux, Microsoft Windows, Proxmox, VMware |
| Storage systems | Dell PowerProtect Data Domain, DataDirect Networks, Dell Compellent, Dell EMC PowerMax, Dell PowerStore, Dell PowerVault, Dell EqualLogic, Dell XtremIO, Dot Hill, Dell EMC Celerra, Dell EMC VNX, Dell Isilon, Dell EMC CLARiiON, Dell EMC Unity, Dell EMC Symmetrix, Dell EMC VMAX, Dell EMC VNXe, Dell EMC VPLEX, Fujitsu Eternus, Hitachi VSP, Hitachi AMS, Hitachi HUS, Hitachi HNAS, HPE MSA, HPE Qumulo, HPE EVA, HPE 3PAR, HPE Primera, Huawei OceanStor, IBM DS3000-5000, IBM DS8000, IBM FlashSystem, IBM Storwize, IBM Tape Library, IBM XiV, MacroSan, McData, NetApp, NetApp E-Series, NetApp SolidFire, HPE Nimble, Oracle ZFS, Pure Storage, Quantum, SMI-S, StorageTek Tape Library, Synology |
| Network | HPE Aruba, Cisco Networking, Dell PowerSwitch, Arista, Extreme Networks, F5, HPE Procurve, Juniper, Oracle Networking, any MIB-2 compliant device |
| Databases | Microsoft SQL Server, MySQL, PostgreSQL, Oracle Database |
| Other | APC, Citrix NetScaler, Eaton, Raritan |
MetricsHub connectors directory
Dashboards
This MetricsHub integration comes with pre-configured dashboards that display system performance metrics, hardware health, as well as sustainability KPIs:
- MetricsHub Hardware Main: Overview of all monitored systems, focusing on key hardware and sustainability metrics.
- MetricsHub Hardware Site: Metrics specific to a particular site (a data center or a server room) and its monitored hosts.
- MetricsHub Hardware Host: Metrics associated with the hardware components of a physical host.
- MetricsHub System Performance: System performance metrics for Linux and Windows systems, including CPU, memory, filesystems, disks, and network.
Support
A subscription to MetricsHub through the Datadog Marketplace grants access to all services provided by the MetricsHub Support Desk:
Further Reading
For more information, visit the MetricsHub website.
This application is made available through the Marketplace and is supported by a Datadog Technology Partner. Click Here to purchase this application.