- Essentials
- Getting Started
- Datadog
- Datadog Site
- DevSecOps
- Serverless for AWS Lambda
- Agent
- Integrations
- Containers
- Dashboards
- Monitors
- Logs
- APM Tracing
- Profiler
- Tags
- API
- Service Catalog
- Session Replay
- Continuous Testing
- Synthetic Monitoring
- Incident Management
- Database Monitoring
- Cloud Security Management
- Cloud SIEM
- Application Security Management
- Workflow Automation
- CI Visibility
- Test Visibility
- Test Impact Analysis
- Code Analysis
- Learning Center
- Support
- Glossary
- Standard Attributes
- Guides
- Agent
- Integrations
- OpenTelemetry
- Developers
- Authorization
- DogStatsD
- Custom Checks
- Integrations
- Create an Agent-based Integration
- Create an API Integration
- Create a Log Pipeline
- Integration Assets Reference
- Build a Marketplace Offering
- Create a Tile
- Create an Integration Dashboard
- Create a Recommended Monitor
- Create a Cloud SIEM Detection Rule
- OAuth for Integrations
- Install Agent Integration Developer Tool
- Service Checks
- IDE Plugins
- Community
- Guides
- Administrator's Guide
- API
- Datadog Mobile App
- CoScreen
- Cloudcraft
- In The App
- Dashboards
- Notebooks
- DDSQL Editor
- Sheets
- Monitors and Alerting
- Infrastructure
- Metrics
- Watchdog
- Bits AI
- Service Catalog
- API Catalog
- Error Tracking
- Service Management
- Infrastructure
- Application Performance
- APM
- Continuous Profiler
- Database Monitoring
- Data Streams Monitoring
- Data Jobs Monitoring
- Digital Experience
- Real User Monitoring
- Product Analytics
- Synthetic Testing and Monitoring
- Continuous Testing
- Software Delivery
- CI Visibility
- CD Visibility
- Test Optimization
- Code Analysis
- Quality Gates
- DORA Metrics
- Security
- Security Overview
- Cloud SIEM
- Cloud Security Management
- Application Security Management
- AI Observability
- Log Management
- Observability Pipelines
- Log Management
- Administration
Microsoft Azure DevOps
Overview
Azure DevOps provides features that organizations use to create and develop products faster. Integrate Datadog with Azure DevOps to:
- Track pull requests and merges to your various projects.
- Monitor release and build events in context with other data from your stack.
- Track durations of completed builds and work items.
- Keep track of work items and updates.
Setup
Installation
In Datadog, click the install button in the Azure DevOps integration tile.
Configuration
Use a service hook to create events and metrics in Datadog in response to events from Azure DevOps services:
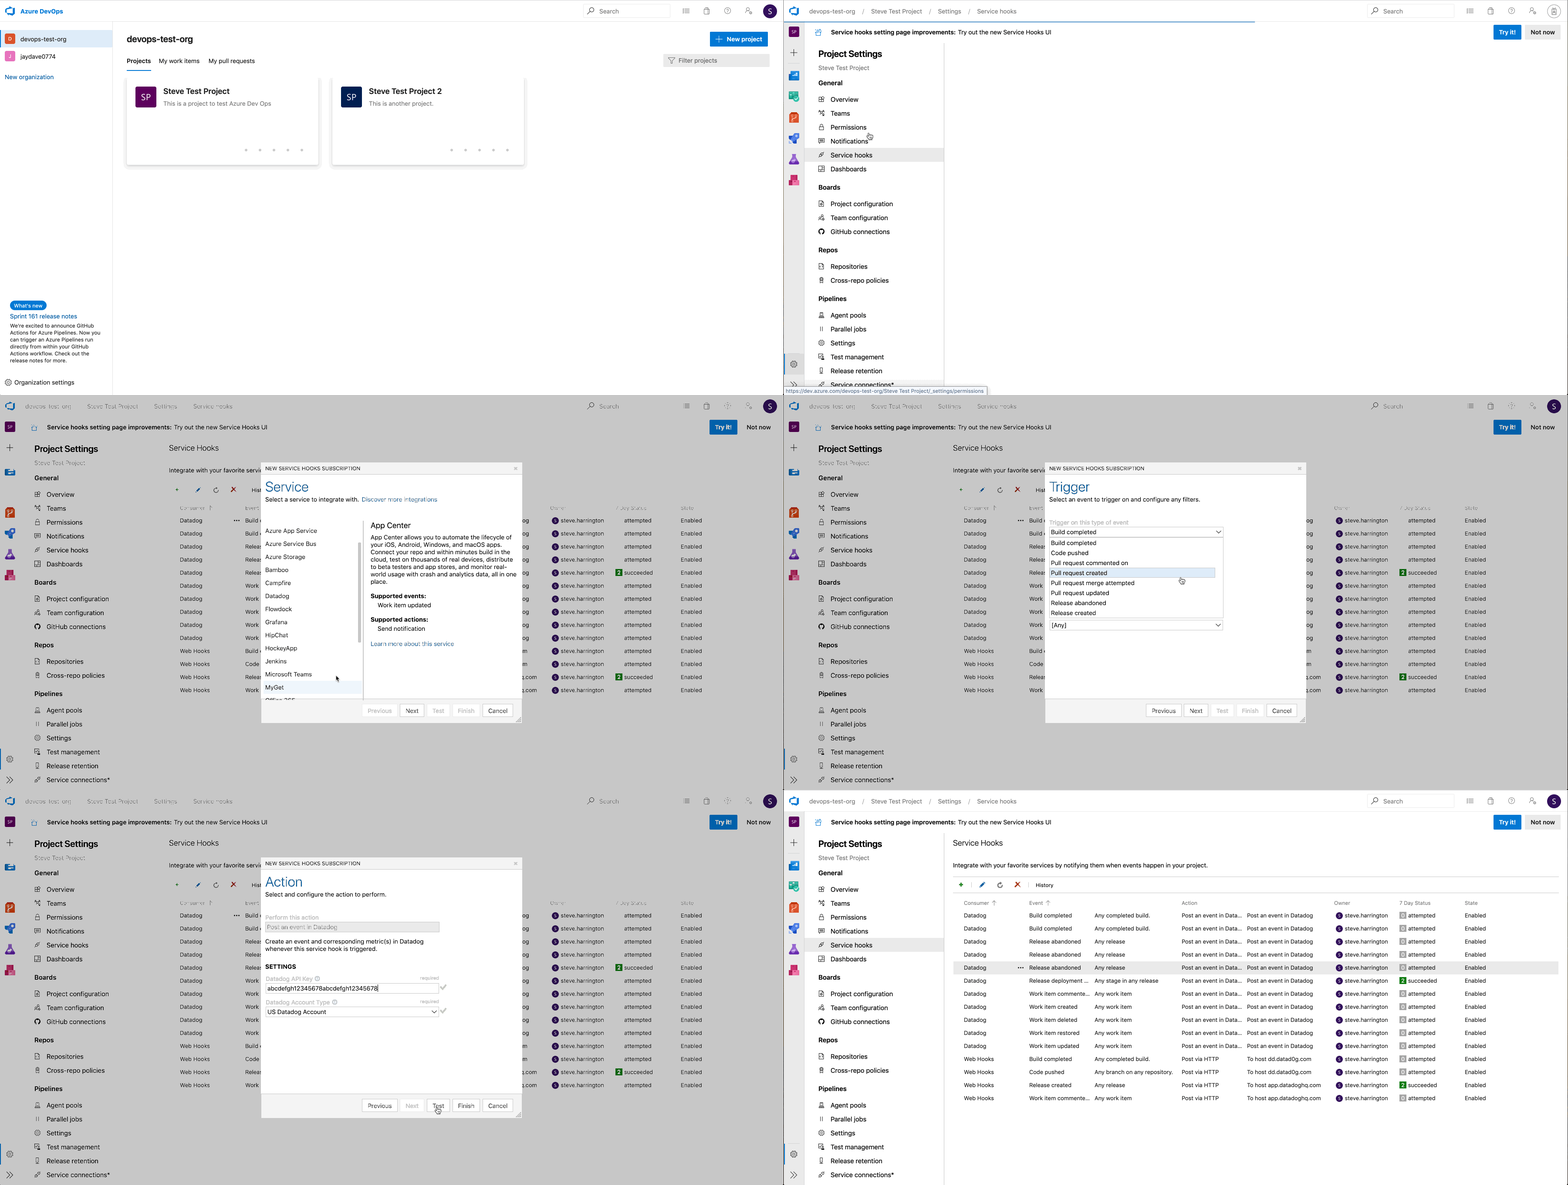
- In Azure, go to your project’s service hooks page.
- Click Create subscription.
- Pick the Datadog service.
- Configure the triggering Visual Studio event.
- Enter your Datadog API key into the required field.
- Add your Datadog organization site:
- Test the service hook subscription and finish the wizard. Note: The test does not validate your API key or Datadog organization site.
- Repeat steps 4-7 for each event type you want to send to Datadog. All event types are accepted.
After your service hooks are configured, go to Datadog to see events and metrics from Azure DevOps.
Additional reference from Azure: Create a service hook for Azure DevOps Services and TFS with Datadog
Programmatic
Follow Azure’s documentation to Create a service hooks subscription programmatically and use Datadog’s endpoint:
https:///intake/webhook/azuredevops?api_key=<DATADOG_API_KEY>
Use Datadog monitors as gates in Azure pipelines
You can also use Datadog monitors as gates to control release deployments in Azure Pipelines. This option allows you to automatically stop problematic deployments if an unhealthy state is detected in Datadog.
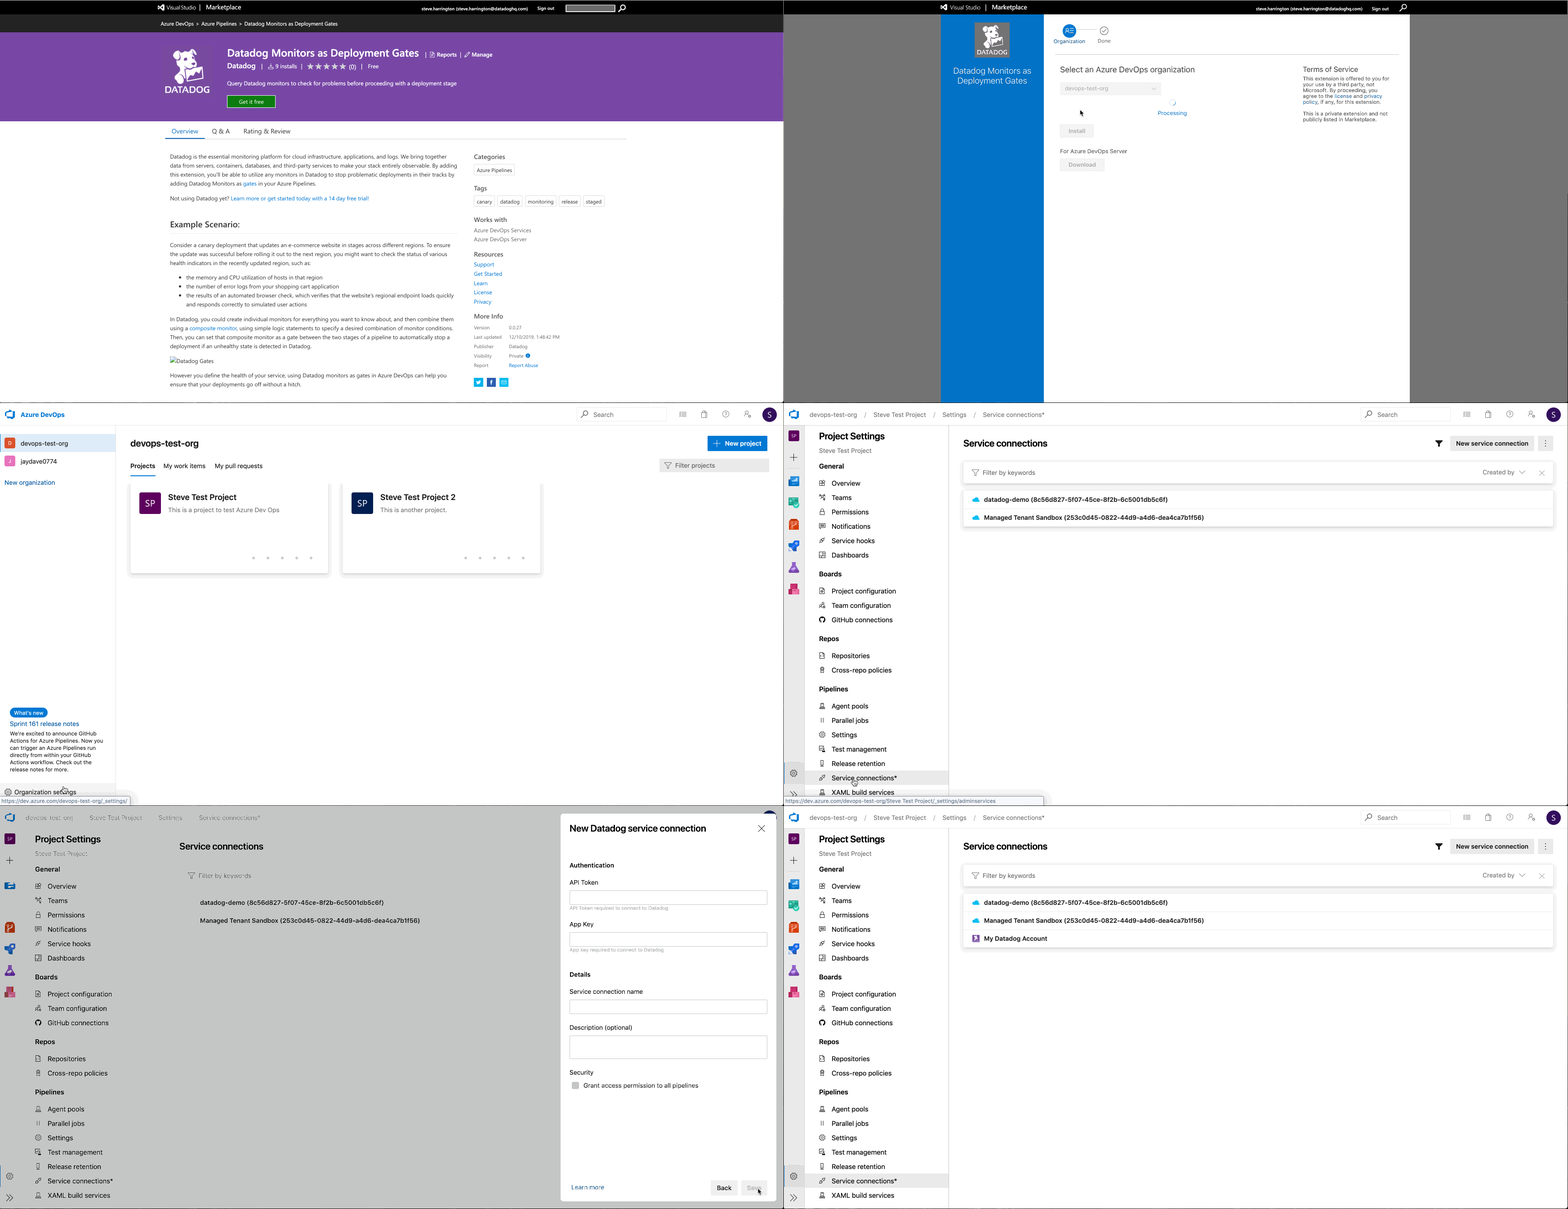
Add the Datadog Monitors as Deployment Gates extension to your Azure DevOps org.
In Azure DevOps, go to Service Connections under your project settings and select New Service Connection.
Select Datadog from the list and press Next.
In the fields provided, add your Datadog API key and application key for the account you want to use, then enter a name and description to identify this Datadog account in Azure DevOps. Click Save. You can add additional service connections if you need to query monitors from multiple Datadog accounts.
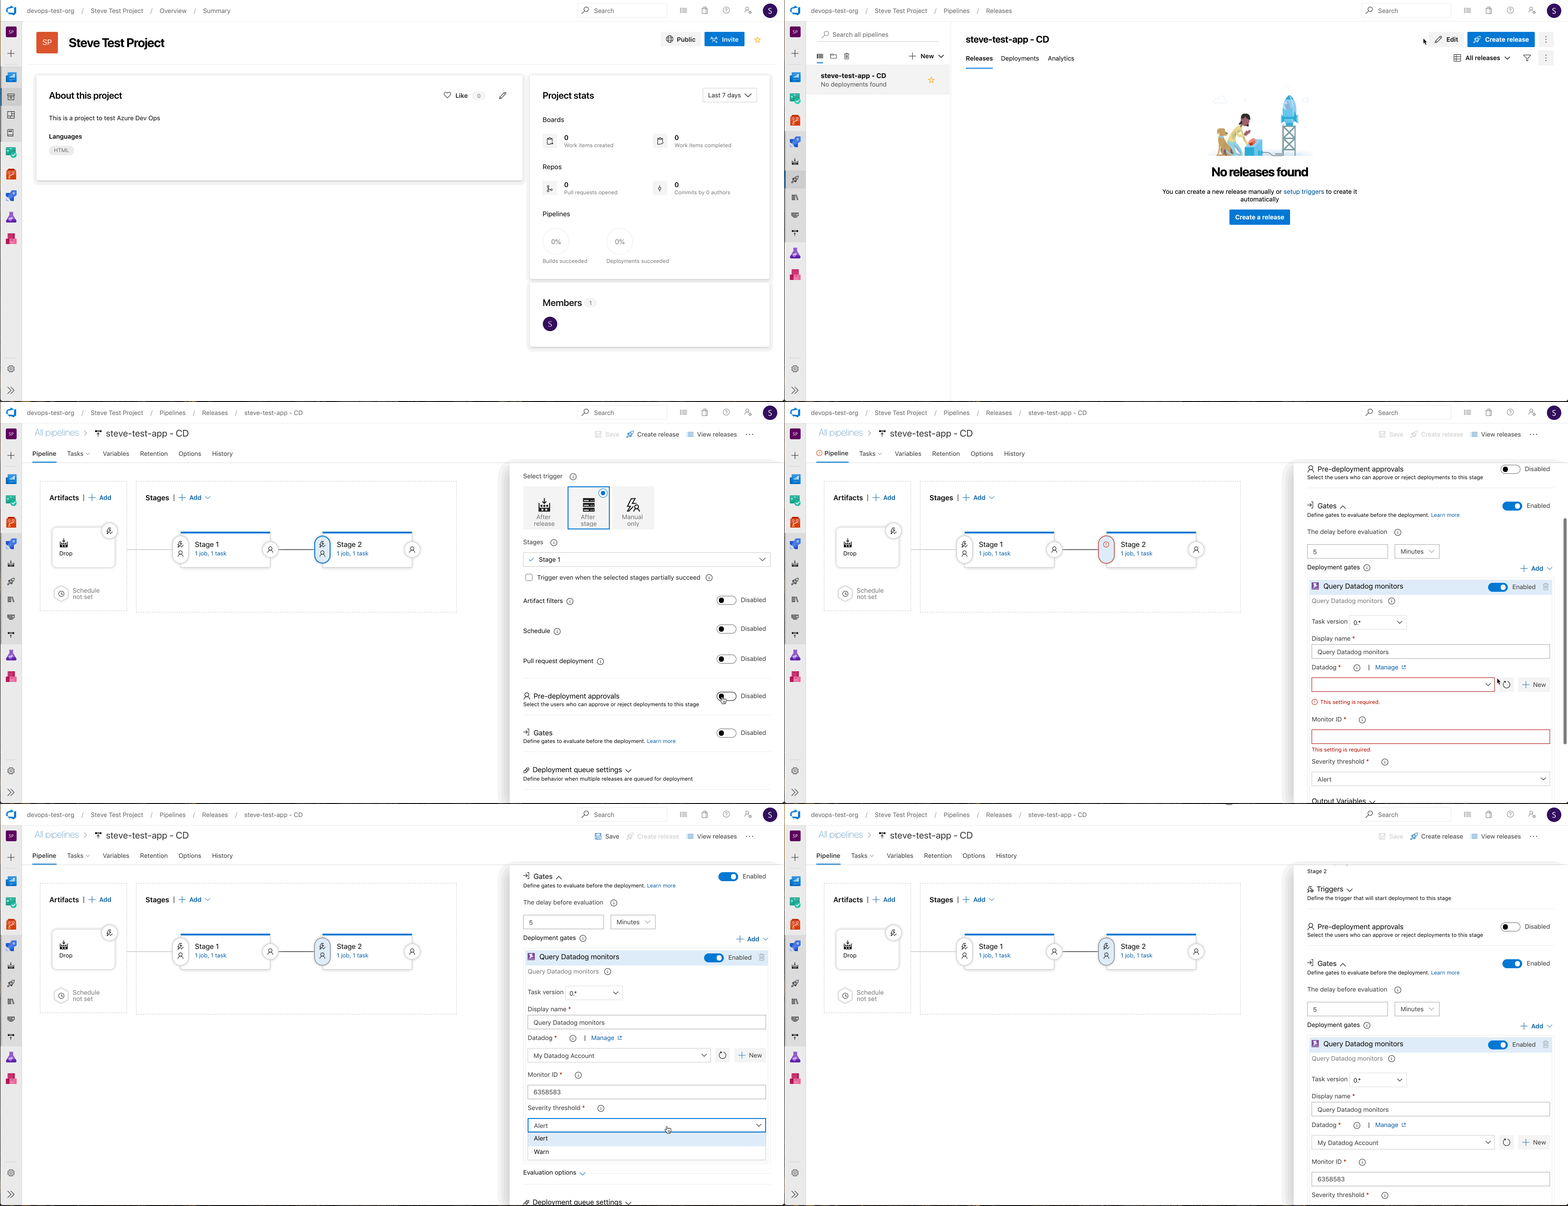
Go to Azure Pipelines to configure your deployment. Here, there’s an option to add pre or post deployment conditions between stages. Select where you want to add a Datadog monitor, and then enable the toggle switch for Gates.
Click Add and select the option Query Datadog monitors.
Select the Datadog service connection then enter your monitor ID and the severity threshold you want to use. The severity threshold is the state of the monitor (either
AlertorWarning) at which the task is failed.Repeat steps 5-7 to add additional gates as needed in your deployment pipeline.
Note: Use composite monitors to monitor multiple conditions for the gates in your pipeline as part of a single health state for each stage.
To view the source code, see the Azure Devops Monitor Gate Extension repo."
Data Collected
Metrics
| azure.devops.event.count (counter) | The total number of events. Shown as event |
| azure.devops.build.duration (gauge) | The duration of a build. Shown as second |
| azure.devops.release.duration (gauge) | The duration of a release. Shown as second |
| azure.devops.work_item.duration (gauge) | The lifetime duration of a work item. Shown as hour |
Events
The Azure DevOps integration supports the following service hook event types:
- Build and release
- Work items
- Code
Service Checks
The Azure DevOps integration does not include any service checks.
Troubleshooting
Need help? Contact Datadog support.
FAQ
Is there an additional cost for this integration?
The metrics and events generated from this integration do not incur any additional costs.
How long does this data persist in Datadog?
The data from this integration is held for 15 months, similar to other types of timeseries data in Datadog.
How long does it take for the events and metrics to display in Datadog?
The total latency has many variables, but in most cases the events and metrics display in Datadog within 30 seconds of the incident occurring.
What can you do with the Azure DevOps events and metrics in Datadog?
The events and metrics can be used like other events and metrics in Datadog, including building dashboards, setting up monitors, and troubleshooting.
How are the metrics for build duration and work item duration generated?
The build duration is generated from build completed events by taking the time difference between when the build was initiated to when it completed (measured in seconds).
The work item duration is generated from work item updated events by taking the time difference between the transition to Done and when the work item was created (measured in hours).
Note: If a Done work item is re-opened, the next time it is transitioned to Done another data point is generated. The initial data point is not modified, and the new data point still measures from the time the work item was initially created.
Your service hook subscription test returns a success message, why aren’t events arriving to Datadog?
The service hook subscription test only checks whether Azure DevOps is able to send events to Datadog. It does not validate your API key or your Datadog organization site (US or EU). Make sure that the API key and site are correct.
Further reading
Additional helpful documentation, links, and articles:


