- Essentials
- Getting Started
- Datadog
- Datadog Site
- DevSecOps
- Serverless for AWS Lambda
- Agent
- Integrations
- Containers
- Dashboards
- Monitors
- Logs
- APM Tracing
- Profiler
- Tags
- API
- Service Catalog
- Session Replay
- Continuous Testing
- Synthetic Monitoring
- Incident Management
- Database Monitoring
- Cloud Security Management
- Cloud SIEM
- Application Security Management
- Workflow Automation
- CI Visibility
- Test Visibility
- Test Impact Analysis
- Code Analysis
- Learning Center
- Support
- Glossary
- Standard Attributes
- Guides
- Agent
- Integrations
- OpenTelemetry
- Developers
- Authorization
- DogStatsD
- Custom Checks
- Integrations
- Create an Agent-based Integration
- Create an API Integration
- Create a Log Pipeline
- Integration Assets Reference
- Build a Marketplace Offering
- Create a Tile
- Create an Integration Dashboard
- Create a Recommended Monitor
- Create a Cloud SIEM Detection Rule
- OAuth for Integrations
- Install Agent Integration Developer Tool
- Service Checks
- IDE Plugins
- Community
- Guides
- Administrator's Guide
- API
- Datadog Mobile App
- CoScreen
- Cloudcraft
- In The App
- Dashboards
- Notebooks
- DDSQL Editor
- Sheets
- Monitors and Alerting
- Infrastructure
- Metrics
- Watchdog
- Bits AI
- Service Catalog
- API Catalog
- Error Tracking
- Service Management
- Infrastructure
- Application Performance
- APM
- Continuous Profiler
- Database Monitoring
- Data Streams Monitoring
- Data Jobs Monitoring
- Digital Experience
- Real User Monitoring
- Product Analytics
- Synthetic Testing and Monitoring
- Continuous Testing
- Software Delivery
- CI Visibility
- CD Visibility
- Test Optimization
- Code Analysis
- Quality Gates
- DORA Metrics
- Security
- Security Overview
- Cloud SIEM
- Cloud Security Management
- Application Security Management
- AI Observability
- Log Management
- Observability Pipelines
- Log Management
- Administration
Komodor
Supported OS
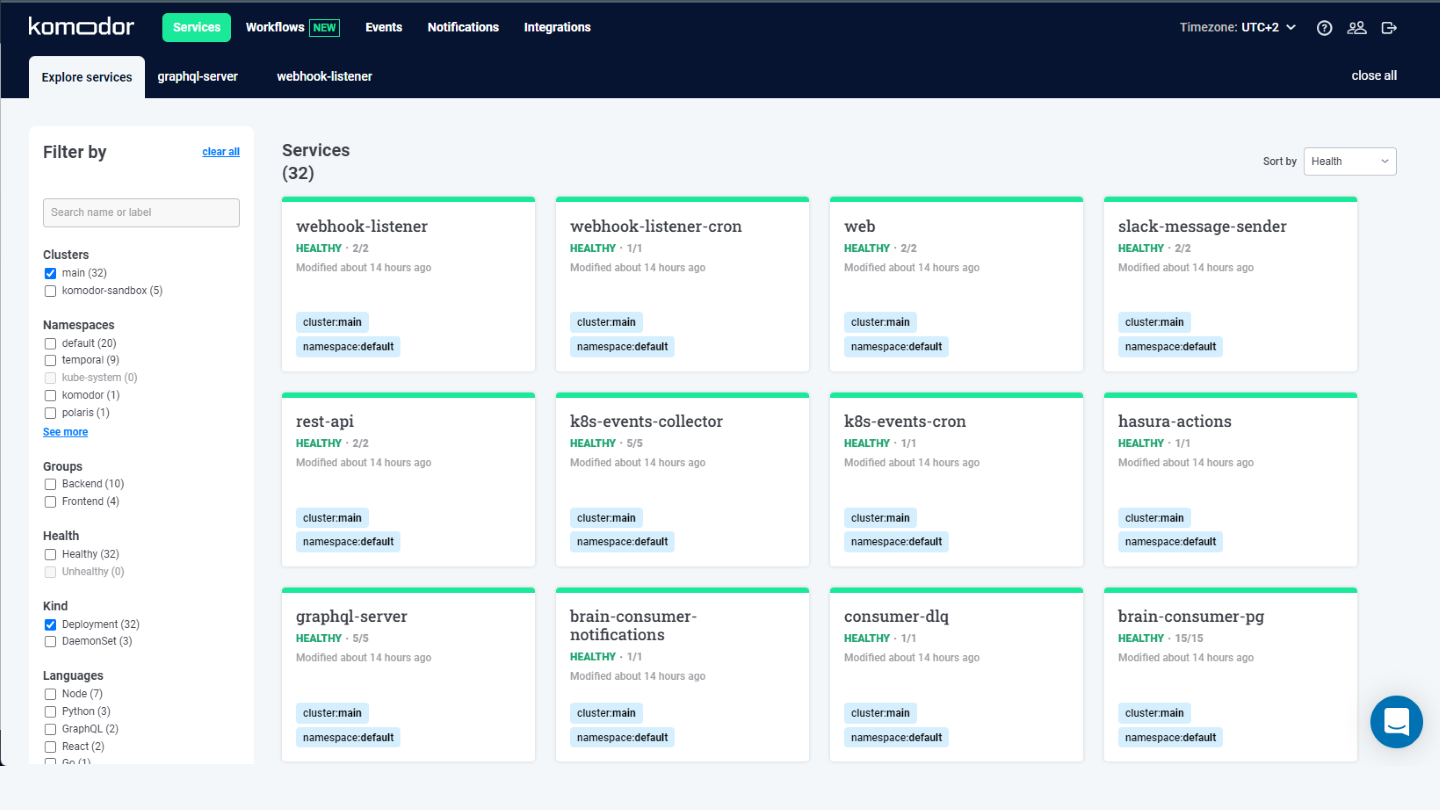
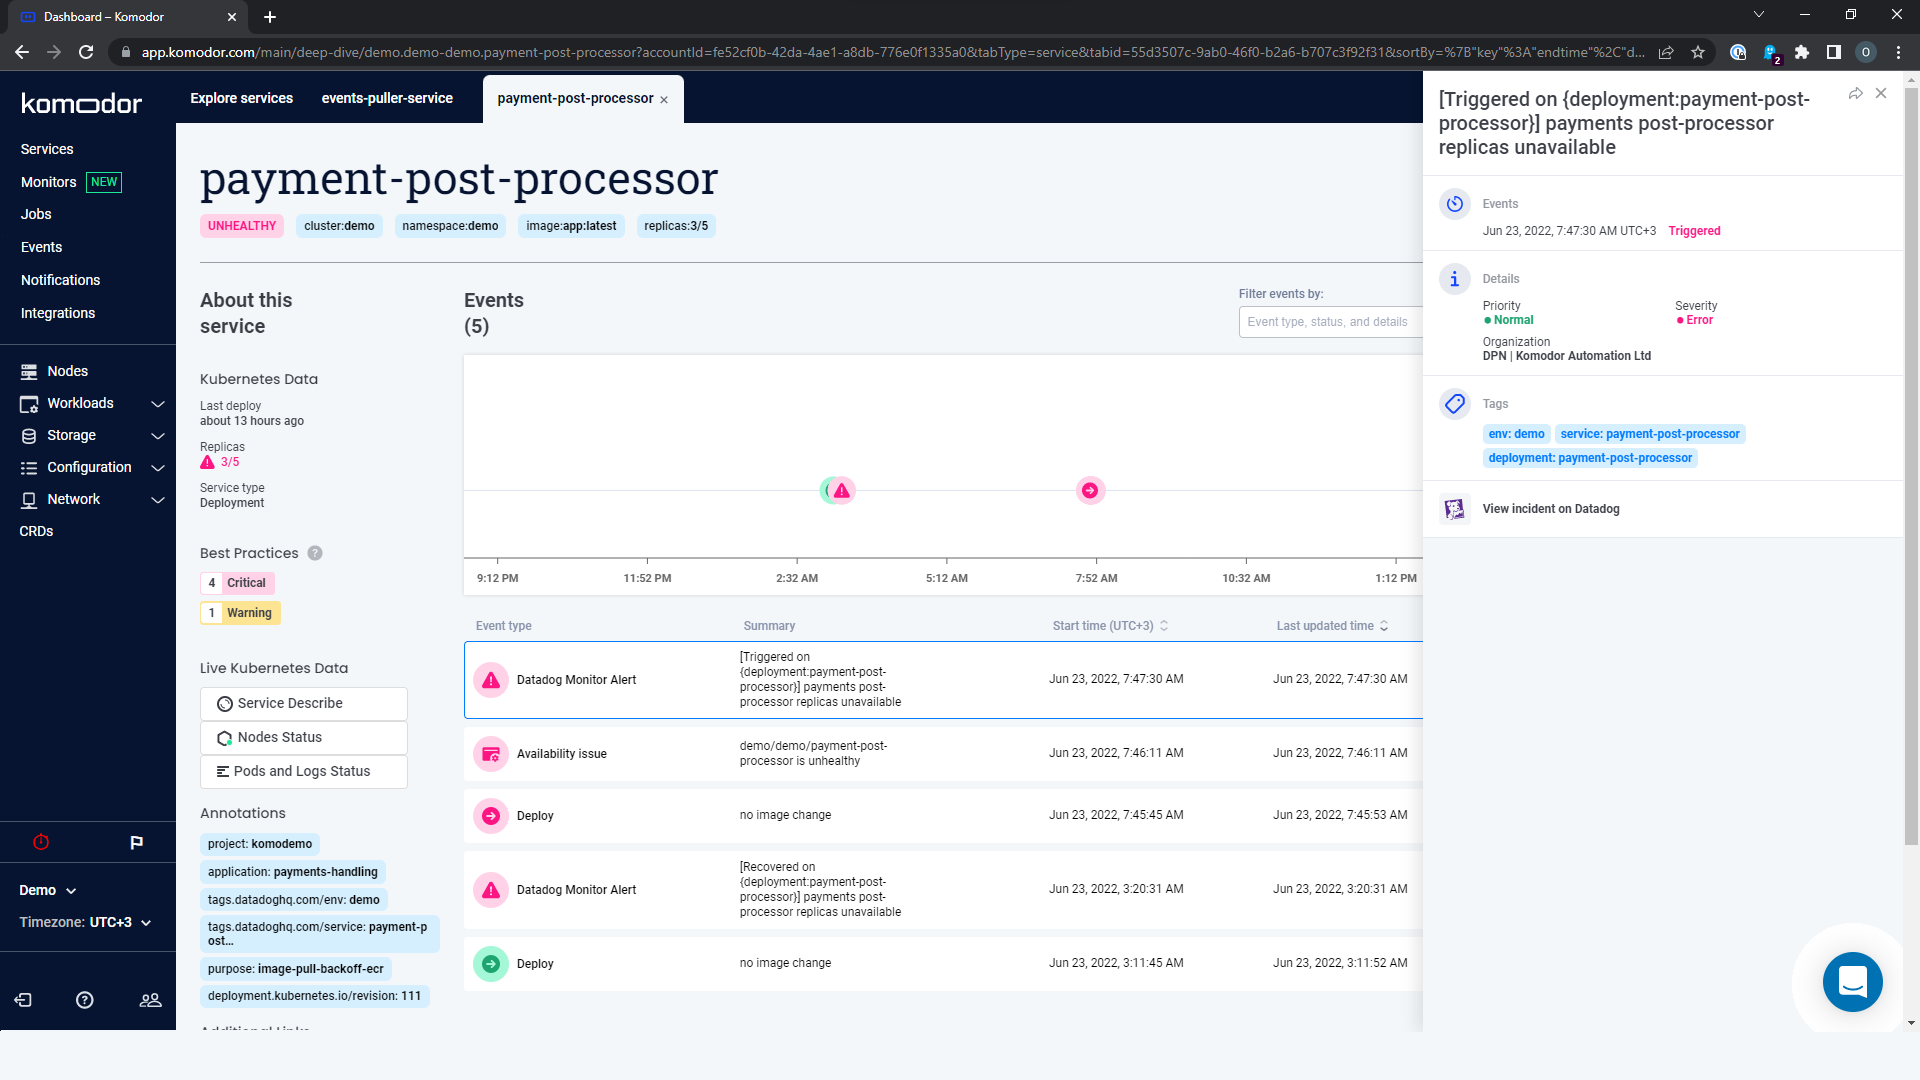
Komodor's main service view and full workload visibility
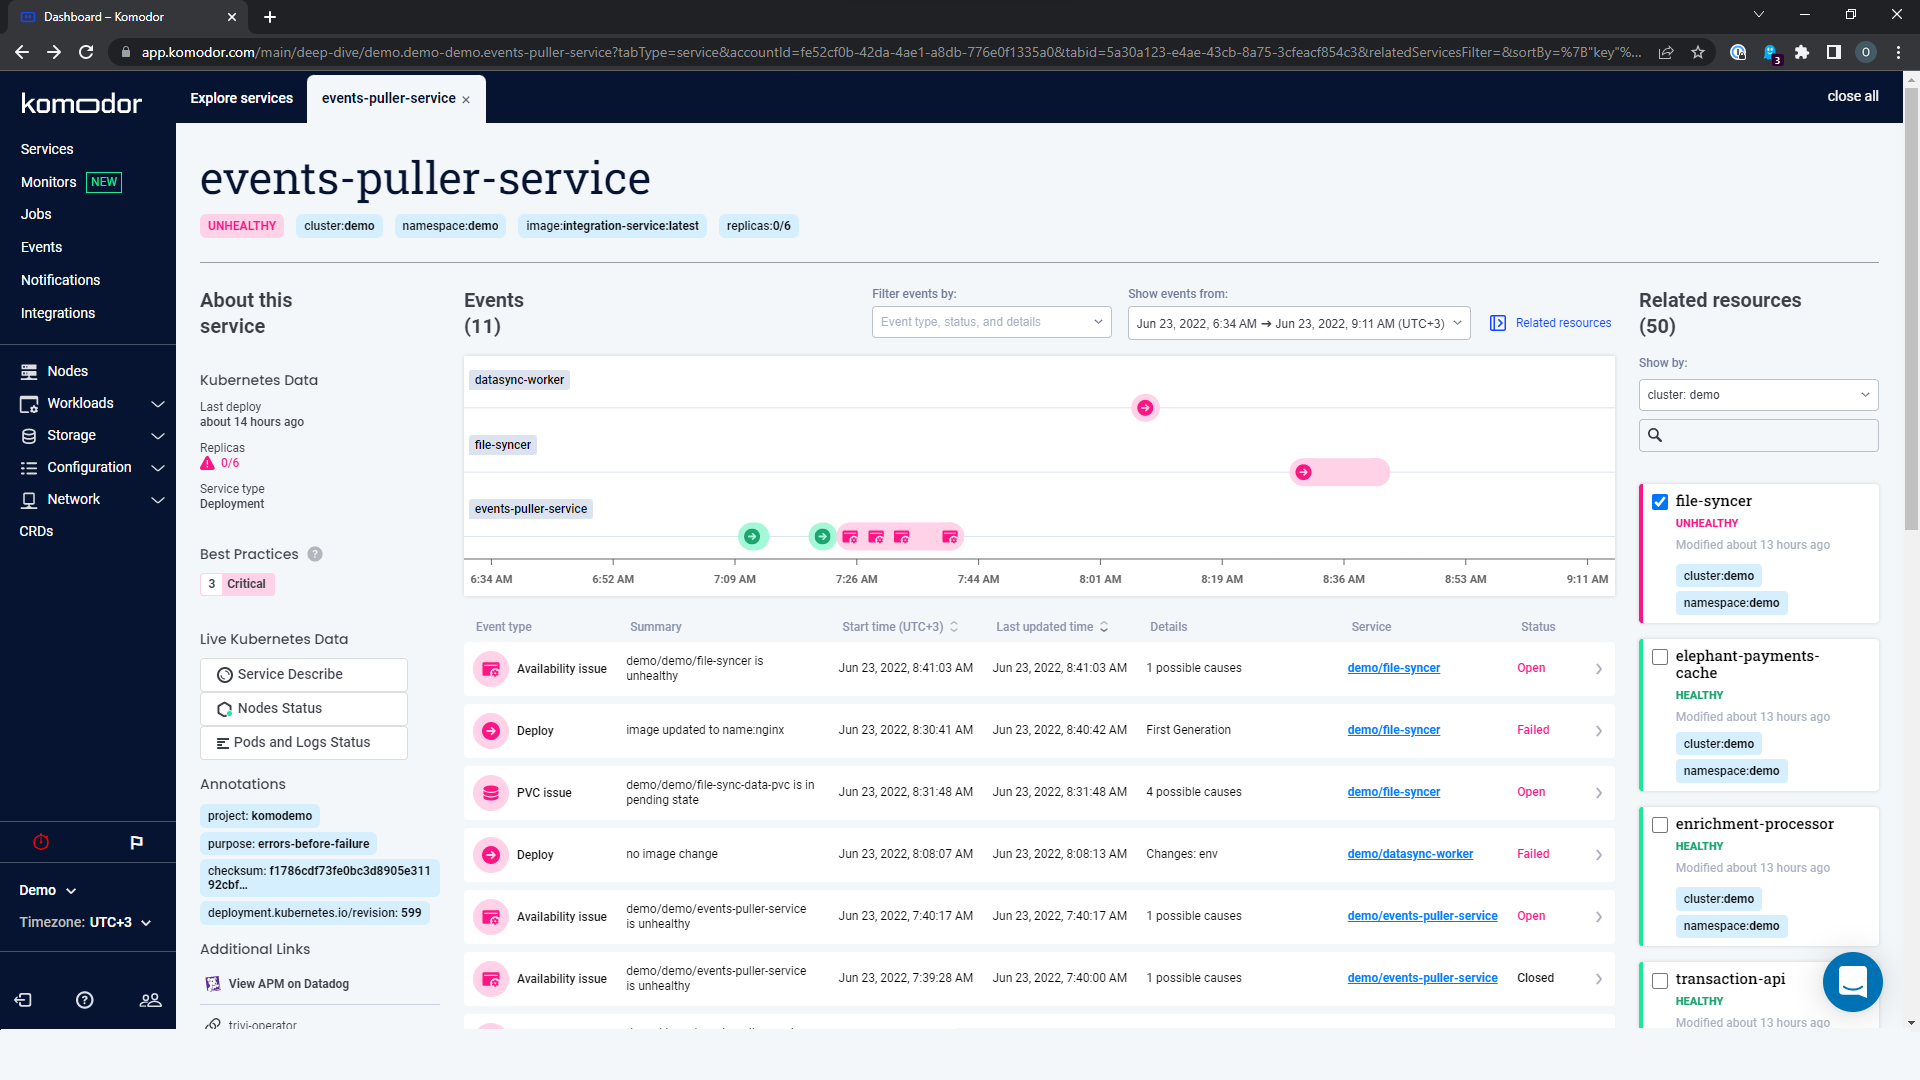
Correlate between several services and piece together the chain of events on a single timeline
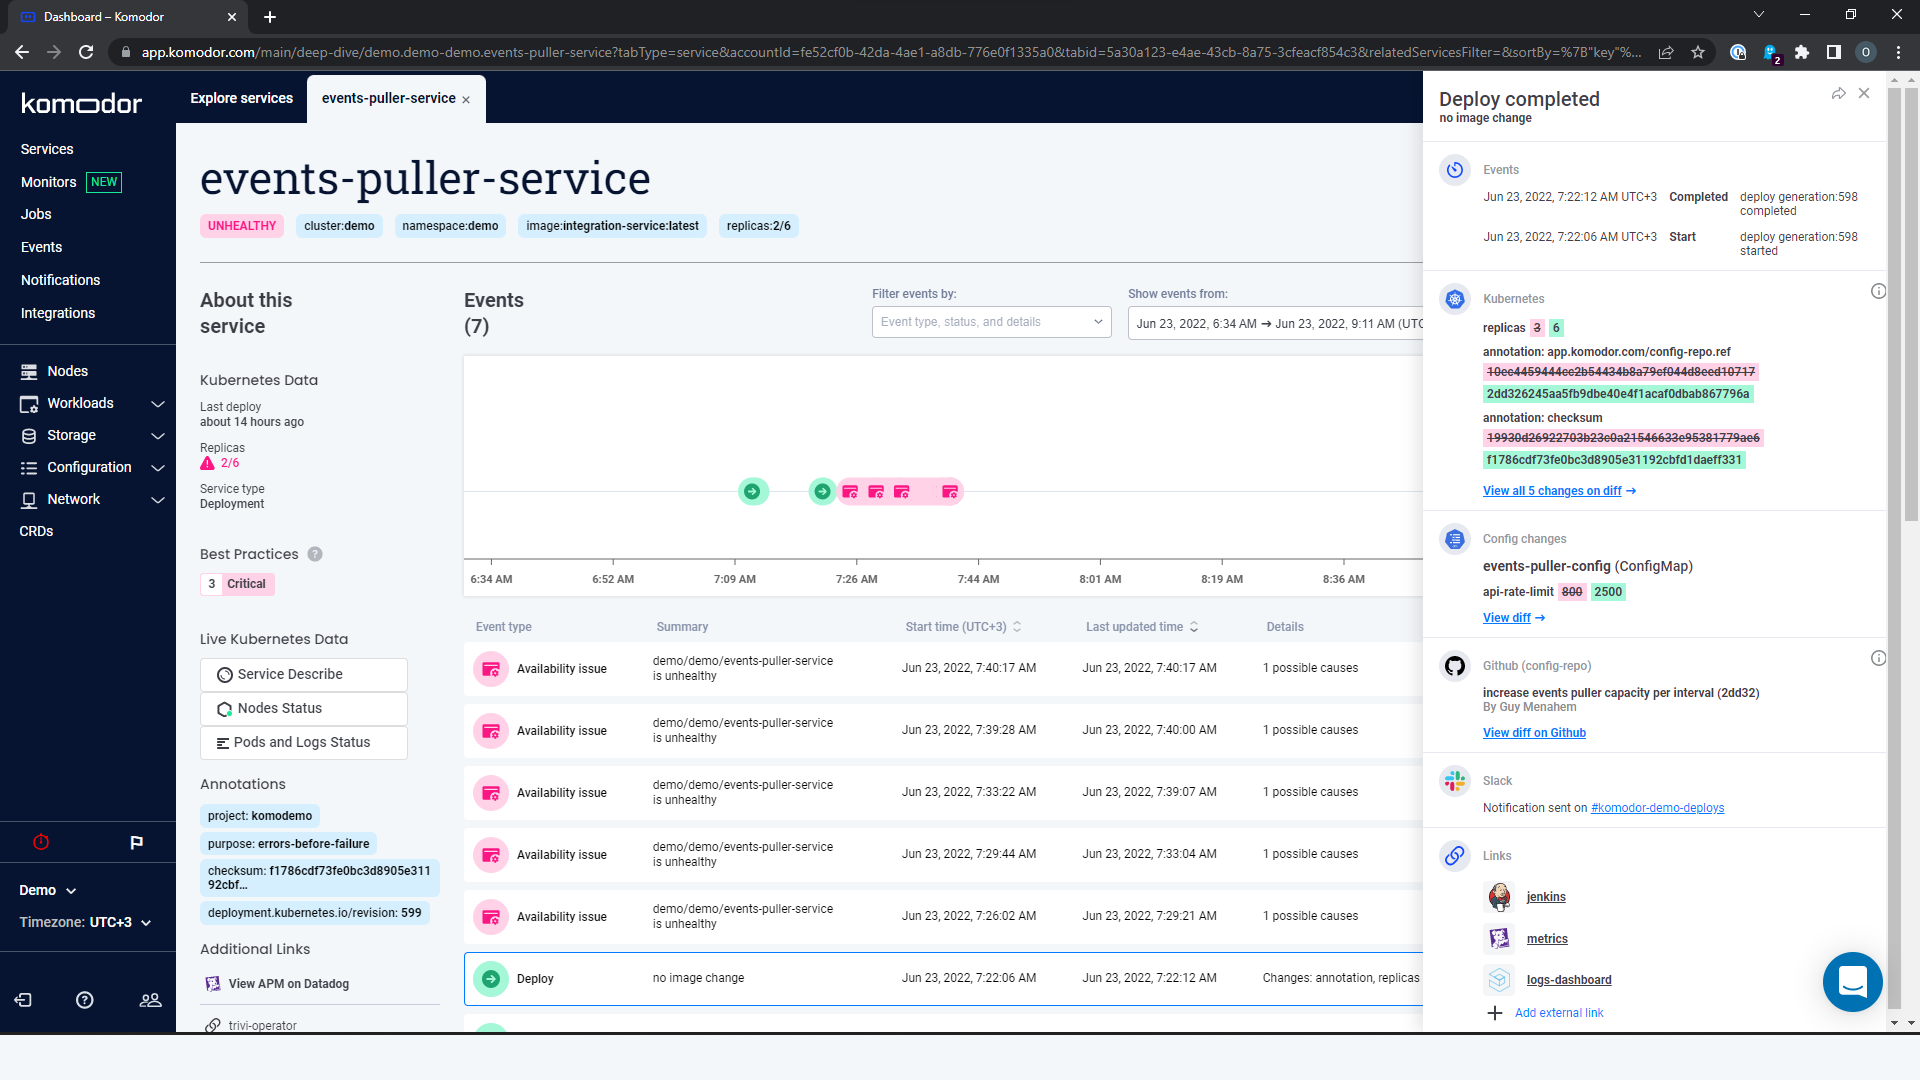
Easily compare changes in the Kubernetes manifest and config changes through Komodor
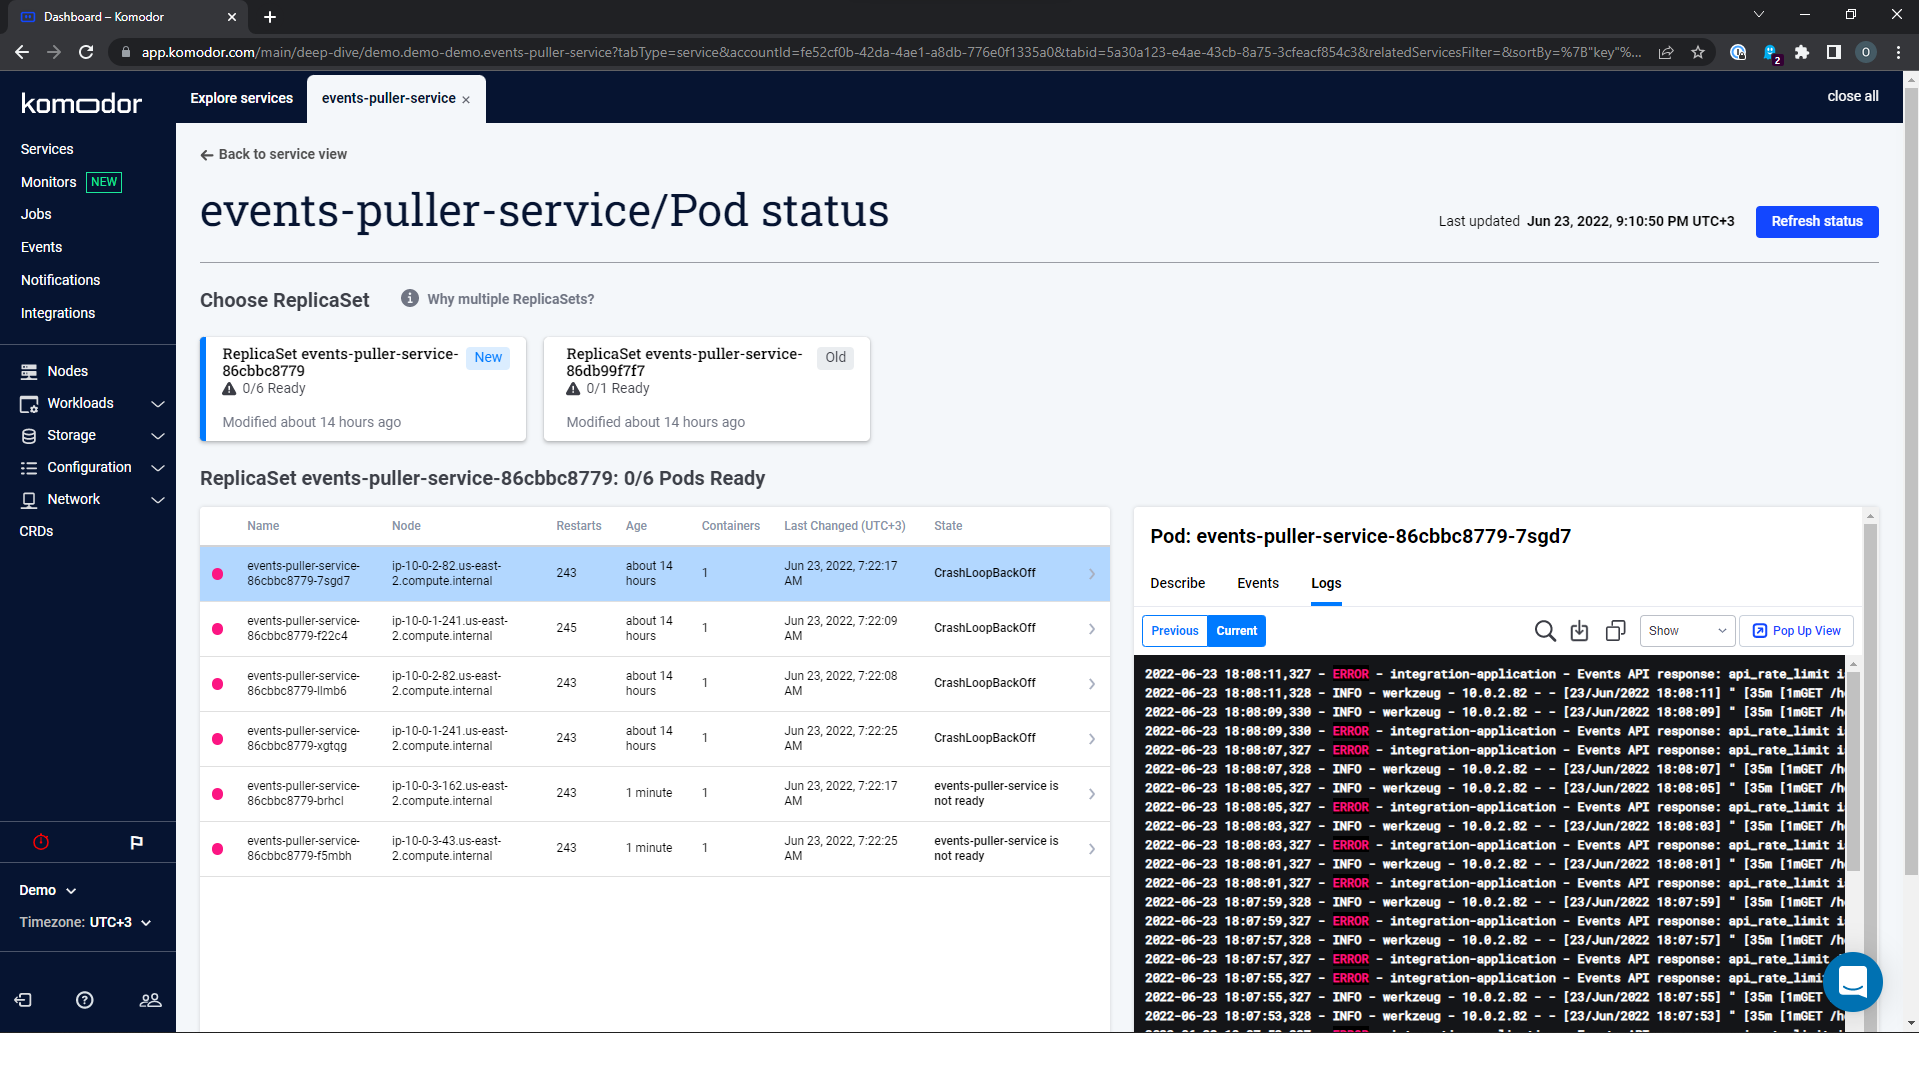
Deep dive into Pod status and logs without a single kubectl command
Connect Datadog alerts, Kubernetes events, and availability issues in one simple view
Overview
Komodor tracks changes across your entire K8s stack, analyzes their ripple effects, and provides you with the context you need to troubleshoot efficiently and independently. Komodor gives you insight into your Kubernetes deployments on a timeline with relevant information such as what changed, what code was pushed, and who pushed it. You can also view data from Git, config maps, your infrastructure, alerting, and other tools such as Datadog, in one centralized and easy-to-understand display.
This offering in the Datadog Marketplace provides access to the Komodor platform. If you are already a Komodor customer and need to connect your instance to Datadog, set up the integration.
Support
At Komodor, we’re committed to giving you the tools and information you need to be successful. So, we offer multiple ways to get the help you need, when you need it. You can send us messages from inside the Komodor application (the communication button in the bottom right), use the Docs and FAQs to find information, or open a ticket with support by sending an email to support@komodor.com.
This application is made available through the Datadog Marketplace and is supported by a Datadog Technology Partner. To use it, purchase this application in the Marketplace.
