- Essentials
- Getting Started
- Datadog
- Datadog Site
- DevSecOps
- Serverless for AWS Lambda
- Agent
- Integrations
- Containers
- Dashboards
- Monitors
- Logs
- APM Tracing
- Profiler
- Tags
- API
- Service Catalog
- Session Replay
- Continuous Testing
- Synthetic Monitoring
- Incident Management
- Database Monitoring
- Cloud Security Management
- Cloud SIEM
- Application Security Management
- Workflow Automation
- CI Visibility
- Test Visibility
- Test Impact Analysis
- Code Analysis
- Learning Center
- Support
- Glossary
- Standard Attributes
- Guides
- Agent
- Integrations
- OpenTelemetry
- Developers
- Authorization
- DogStatsD
- Custom Checks
- Integrations
- Create an Agent-based Integration
- Create an API Integration
- Create a Log Pipeline
- Integration Assets Reference
- Build a Marketplace Offering
- Create a Tile
- Create an Integration Dashboard
- Create a Recommended Monitor
- Create a Cloud SIEM Detection Rule
- OAuth for Integrations
- Install Agent Integration Developer Tool
- Service Checks
- IDE Plugins
- Community
- Guides
- API
- Datadog Mobile App
- CoScreen
- Cloudcraft
- In The App
- Dashboards
- Notebooks
- DDSQL Editor
- Sheets
- Monitors and Alerting
- Infrastructure
- Metrics
- Watchdog
- Bits AI
- Service Catalog
- API Catalog
- Error Tracking
- Service Management
- Infrastructure
- Application Performance
- APM
- Continuous Profiler
- Database Monitoring
- Data Streams Monitoring
- Data Jobs Monitoring
- Digital Experience
- Real User Monitoring
- Product Analytics
- Synthetic Testing and Monitoring
- Continuous Testing
- Software Delivery
- CI Visibility
- CD Visibility
- Test Optimization
- Code Analysis
- Quality Gates
- DORA Metrics
- Security
- Security Overview
- Cloud SIEM
- Cloud Security Management
- Application Security Management
- AI Observability
- Log Management
- Observability Pipelines
- Log Management
- Administration
Usage Attribution
Overview
Usage Attribution is an advanced feature included in the Enterprise plan. For all other plans, contact your account representative or success@datadoghq.com to request this feature.
Administrators or users with the Usage Read permission can access the Usage Attribution tab from the Plan & Usage section in Datadog. The Usage Attribution page provides the following information and functionality:
- Lists the existing tag keys that usage is being broken down by and provides the ability to change and add new ones (up to three tag keys).
- Summarizes usage at the end of each month and visualizes usage over time broken out by tags.
- Generates month-to-date and hourly CSV files.
This feature does not support product usage that cannot be tagged during instrumentation. For example, Incident Management Users, CI Pipeline and Test Users, Parallel Testing Slots, and Audit Trail.
Getting started
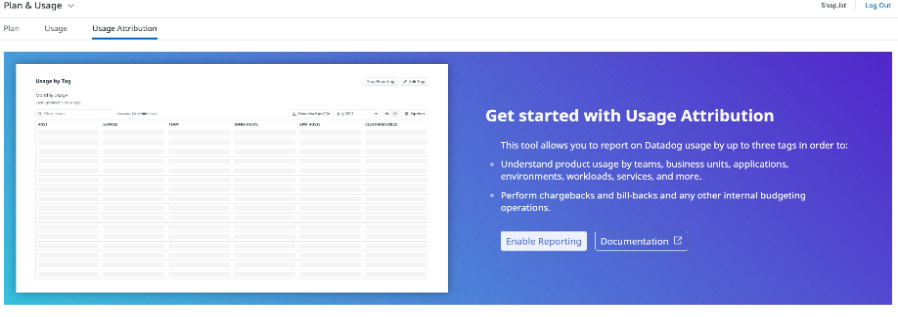
To start receiving daily data, an administrator needs to choose tags for the report.
The Edit Tags popover allows:
- Entering up to three tag keys from a dropdown. The dropdown is pre-populated with existing tags on both the root account and any child organizations under the account.
- Deleting and editing existing tags.
- Once the tags are configured, it takes 24 hours for the first report to be generated.
- The reports are generated on an ongoing basis.
- If tags are changed, the new report reflects the new tags. However, the previous reports keep the old tags.
- Monthly reports reflect the latest set of tags. If tags are changed in the middle of a month, partial month reports are created for each reporting period.
Total usage
Monthly usage attribution
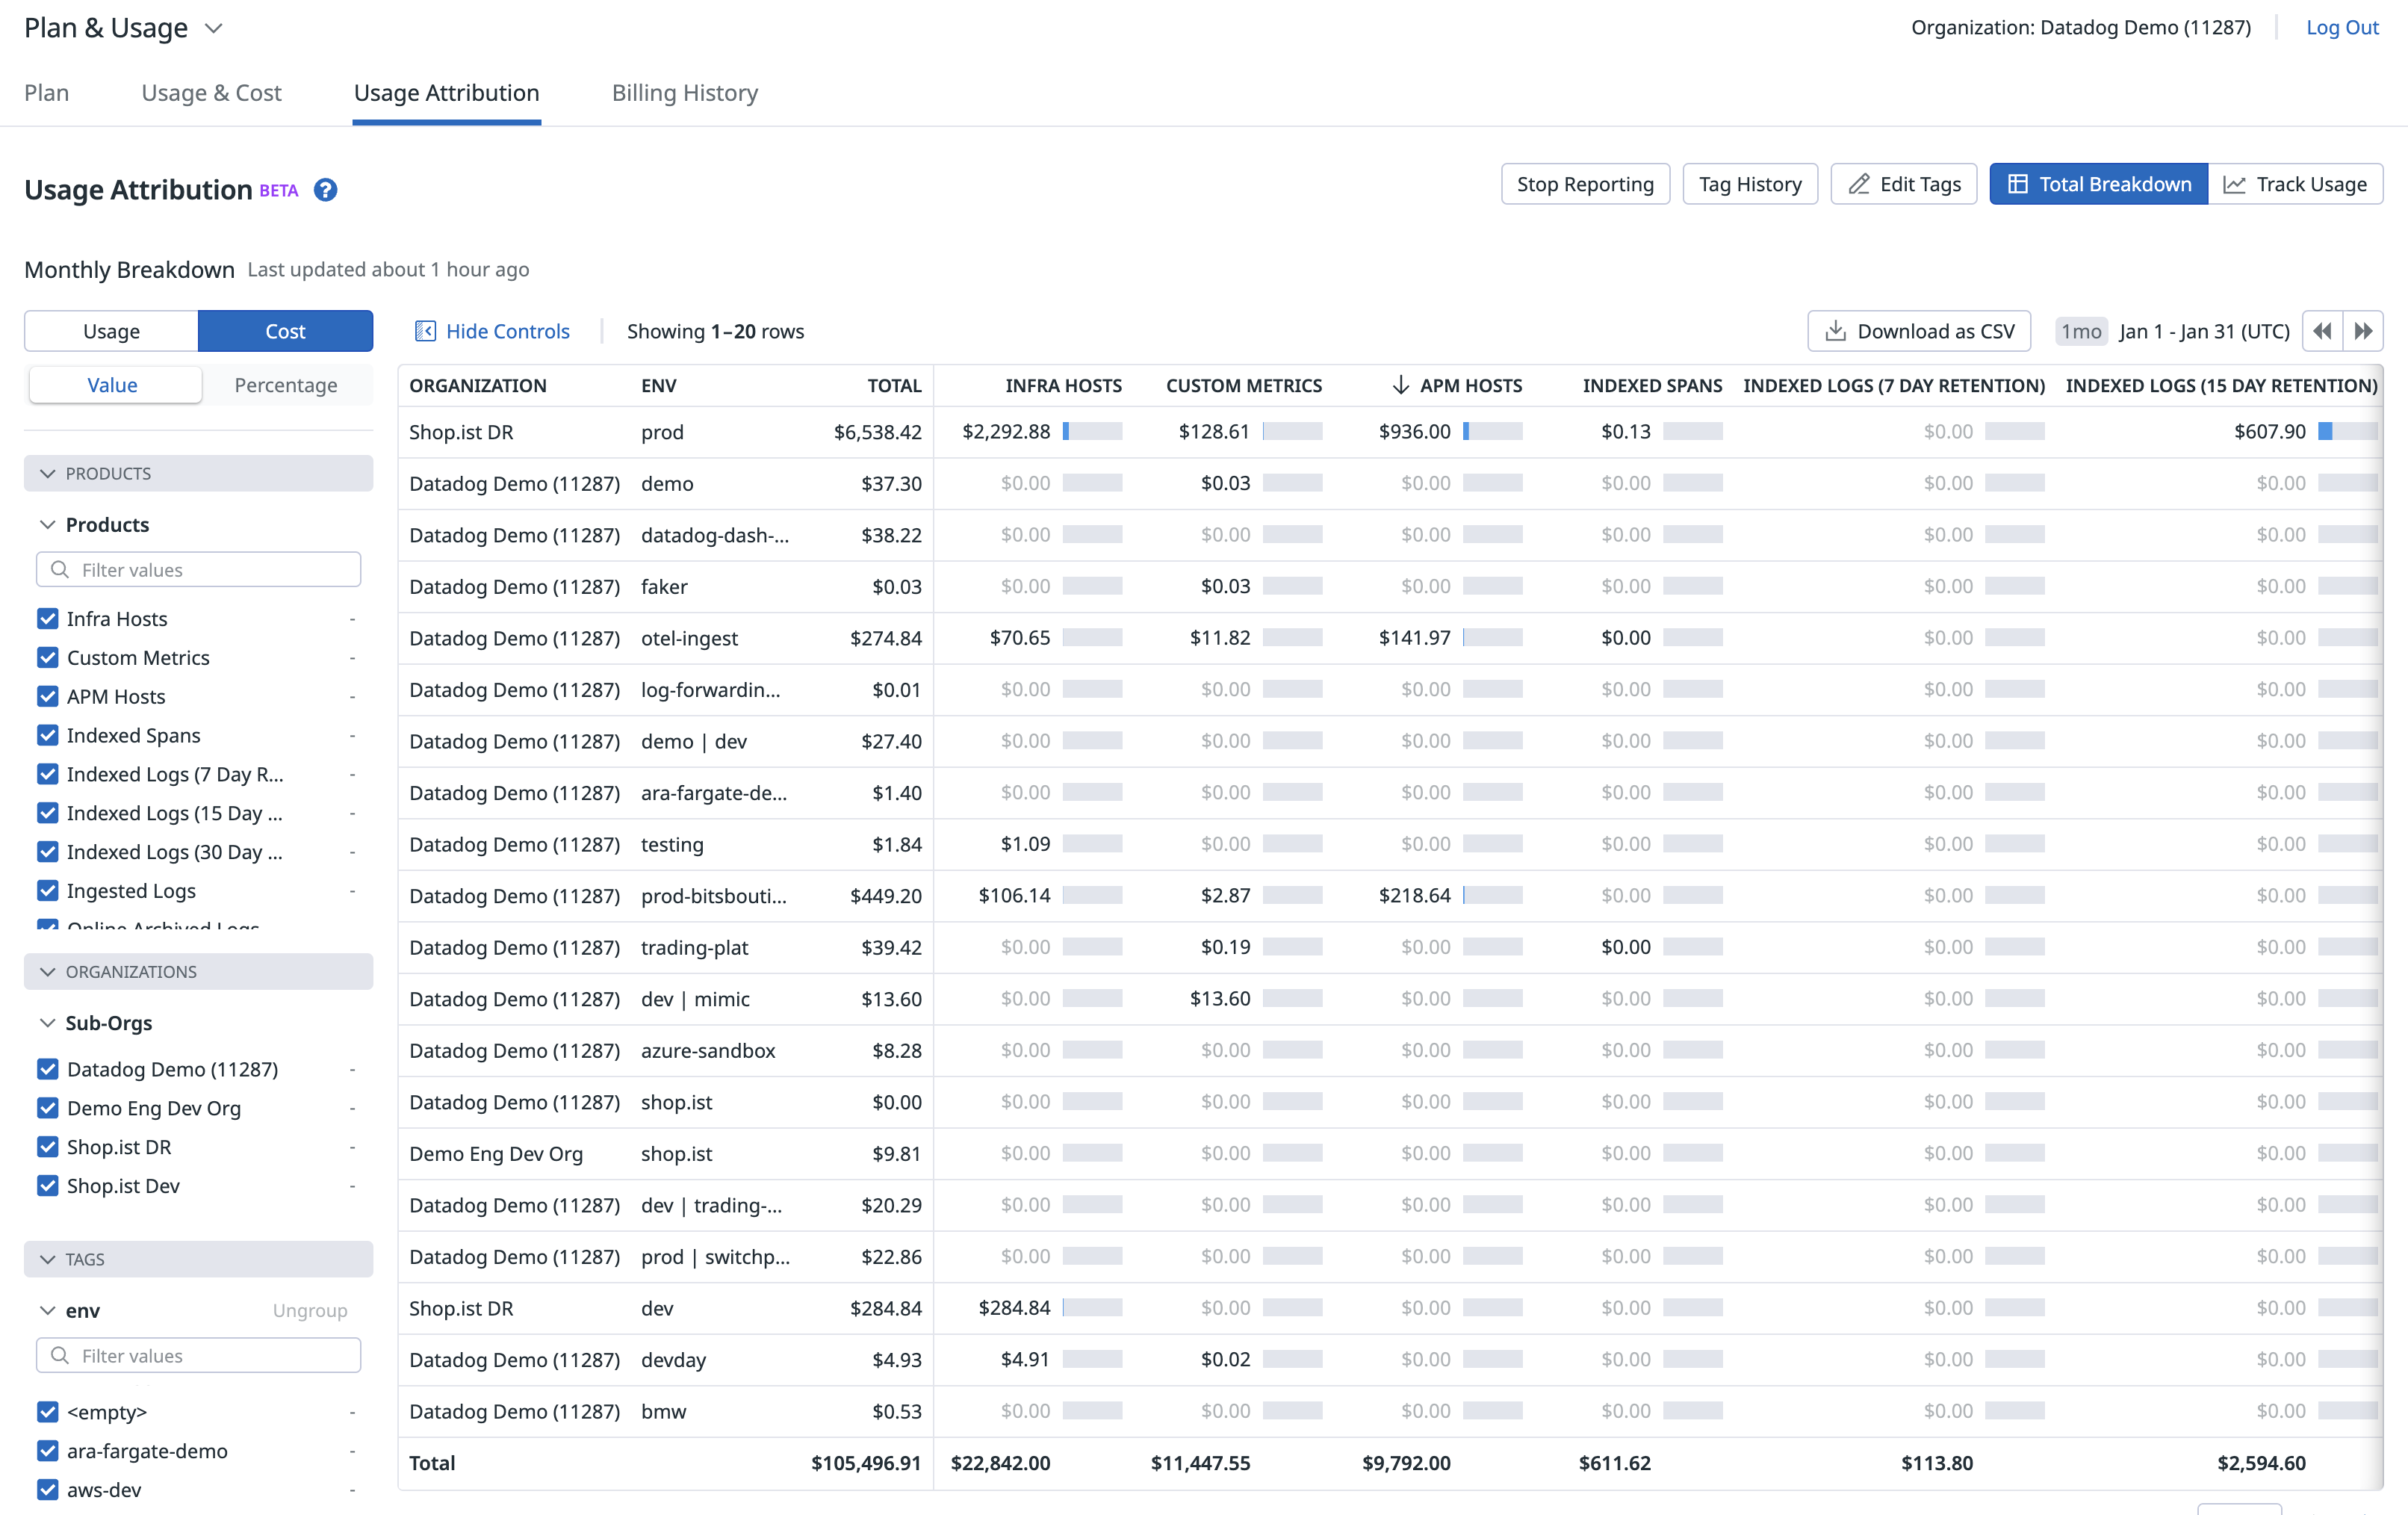
Monthly reports are updated daily and provide a month-to-date aggregation of usage data.
- Data for specific products, tags, and organizations can be selected using the facet selector.
- Data can be grouped and ungrouped by the tag keys selected.
- Value and Percentage options are available for table display.
- Data shown on the table can be edited to include select products.
- If multi-org is enabled, usage is summarized across all Datadog organizations at the parent account.
- Previous months’ reports are accessible through the time selector.
- Reports are downloadable in CSV format. These CSV reports include both usage numbers and percentages, allowing for simplified allocations and chargebacks. Percentages are calculated on a per-organization basis.
Monthly data can also be pulled using the API. For more information, see the API endpoint documentation.
Hourly usage attribution
Hourly data can be pulled using the API. For more information, see the API endpoint documentation.
Interpreting the data
The table below shows a sample daily report for Infra usage by two tags: app and service.
| public_id | hour | app | service | total_usage |
|---|---|---|---|---|
| publicid1 | 2022-03-31 00:00:00 | <empty> | service1 | service2 | 50 |
| publicid1 | 2022-03-31 09:00:00 | app1 | 28 | |
| publicid1 | 2022-03-31 18:00:00 | app2 | service3 | 1023 |
- An
<empty>value means the resource was tagged with the respective tag but did not have a value. - No value means the resource was not tagged with that particular tag.
|(pipe) separated values (for example,service1 | service2) mean that a particular tag was applied multiple times on the resource.- A valid tag value (see the Defining Tags documentation) refers to the actual value of the respective tag.
Further data analysis
When using multiple tags, both the Hourly and Monthly Usage Attribution reports contain data for all possible combinations of those tags, and are suitable to use as base datasets for further data analysis tasks. For instance, you can use grouping or pivoting to produce views focused on a subset of the tags, or to perform aggregations across custom date ranges.
Tracking usage
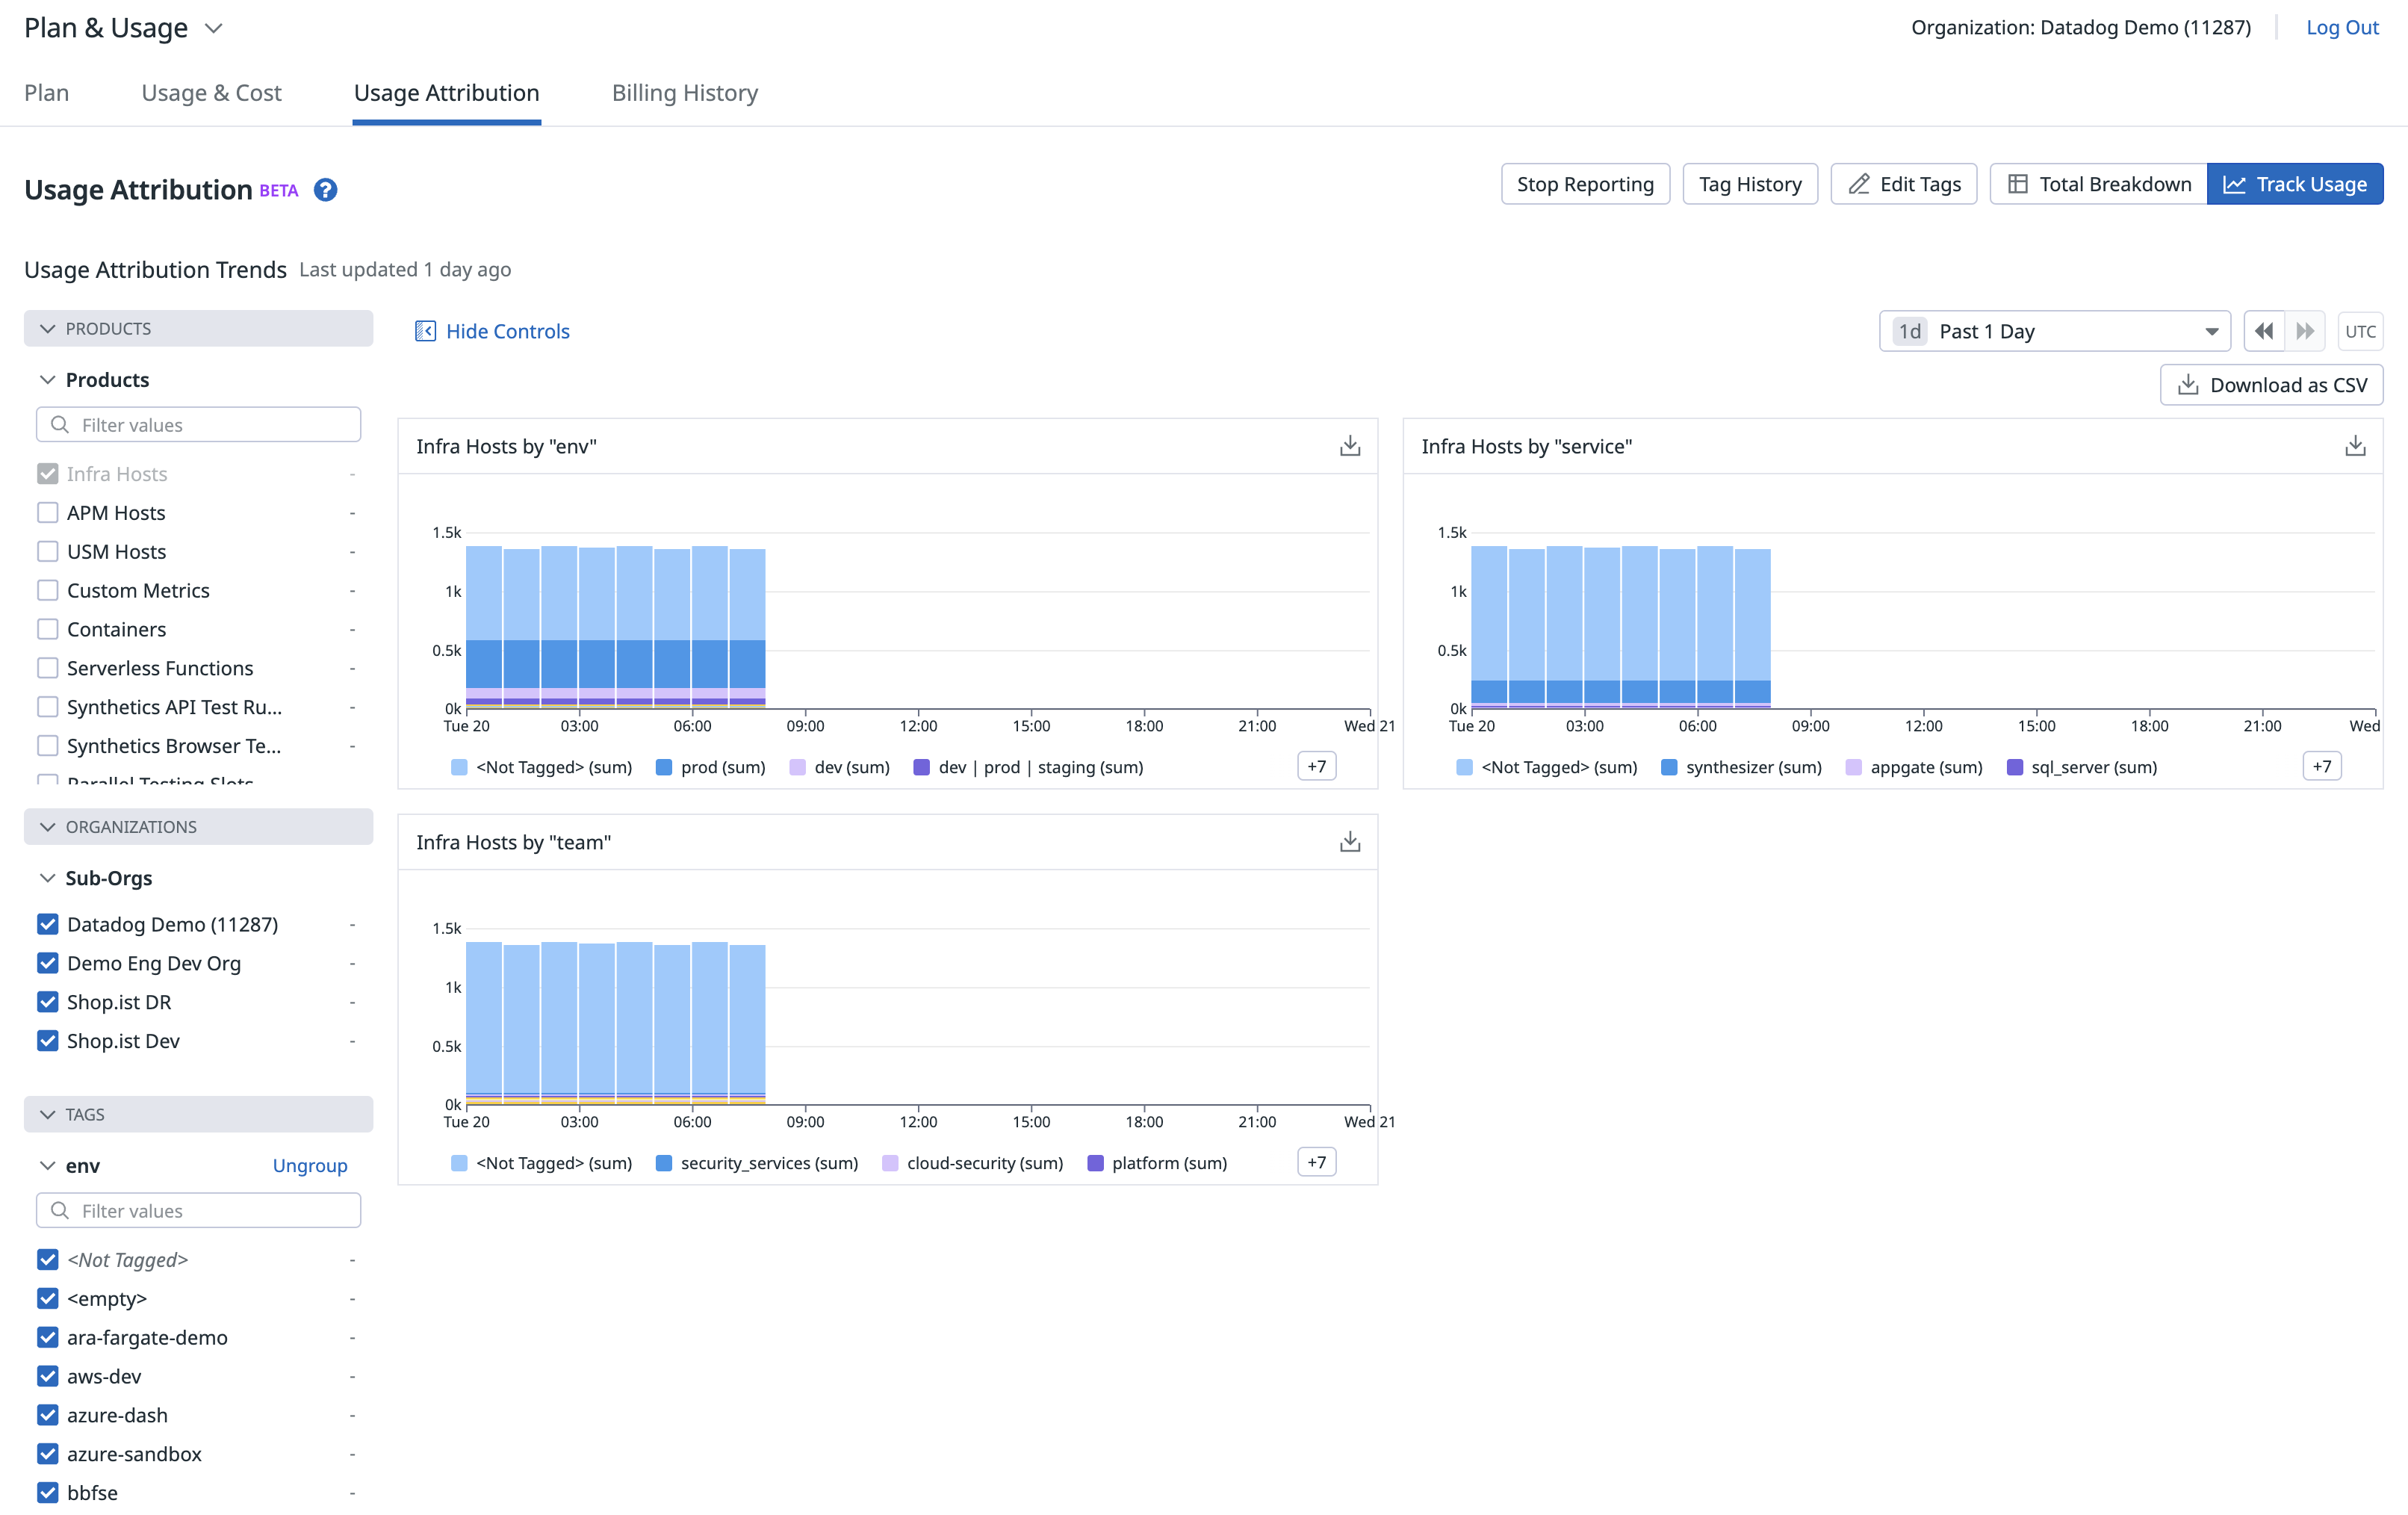
A timeseries of Usage Attribution data can be viewed by clicking on “Track Usage”
- Data for specific products, organization, or tag keys can be selected using the facet selector.
- Data can be graphed for a day, week, or month by using the time selector above the graphs.
Cost attribution
For direct billing customers, month-end cost attribution reports are generated at the end of each billing cycle to enable monthly chargeback and cost allocation processes.
- Cost data for the preceding month is available no later than the 19th of the current month.
- Cost attribution data is not currently available in GovCloud datacenters
- Monthly Cost Attribution data is available with the API
Further Reading
Additional helpful documentation, links, and articles:


