- Essentials
- Getting Started
- Datadog
- Datadog Site
- DevSecOps
- Serverless for AWS Lambda
- Agent
- Integrations
- Containers
- Dashboards
- Monitors
- Logs
- APM Tracing
- Profiler
- Tags
- API
- Service Catalog
- Session Replay
- Continuous Testing
- Synthetic Monitoring
- Incident Management
- Database Monitoring
- Cloud Security Management
- Cloud SIEM
- Application Security Management
- Workflow Automation
- CI Visibility
- Test Visibility
- Test Impact Analysis
- Code Analysis
- Learning Center
- Support
- Glossary
- Standard Attributes
- Guides
- Agent
- Integrations
- OpenTelemetry
- Developers
- Authorization
- DogStatsD
- Custom Checks
- Integrations
- Create an Agent-based Integration
- Create an API Integration
- Create a Log Pipeline
- Integration Assets Reference
- Build a Marketplace Offering
- Create a Tile
- Create an Integration Dashboard
- Create a Recommended Monitor
- Create a Cloud SIEM Detection Rule
- OAuth for Integrations
- Install Agent Integration Developer Tool
- Service Checks
- IDE Plugins
- Community
- Guides
- API
- Datadog Mobile App
- CoScreen
- Cloudcraft
- In The App
- Dashboards
- Notebooks
- DDSQL Editor
- Sheets
- Monitors and Alerting
- Infrastructure
- Metrics
- Watchdog
- Bits AI
- Service Catalog
- API Catalog
- Error Tracking
- Service Management
- Infrastructure
- Application Performance
- APM
- Continuous Profiler
- Database Monitoring
- Data Streams Monitoring
- Data Jobs Monitoring
- Digital Experience
- Real User Monitoring
- Product Analytics
- Synthetic Testing and Monitoring
- Continuous Testing
- Software Delivery
- CI Visibility
- CD Visibility
- Test Optimization
- Code Analysis
- Quality Gates
- DORA Metrics
- Security
- Security Overview
- Cloud SIEM
- Cloud Security Management
- Application Security Management
- AI Observability
- Log Management
- Observability Pipelines
- Log Management
- Administration
Instrumenting a Ruby on Rails application on Heroku with Datadog
Heroku is a popular platform within Ruby developers and, more specifically, Ruby on Rails developers. Datadog supports Heroku and Ruby, so you are able to send your Heroku Ruby application metrics, logs, and traces to Datadog.
This guide walks you through the necessary steps to take a Rails application deployed to Heroku and get metrics, integrations data, logs, and traces sent to Datadog.
Prerequisites
This guide assumes the following:
- You already have a Datadog account. If you don’t have one, you can sign up for a free trial.
- You already have a Heroku account. If you don’t have one, you can sign up for their free tier.
- You have Git installed on your local system.
- You have the Heroku CLI tool installed on your local system.
Creating your Heroku application and deploying the sample Ruby application
This guide uses Heroku’s Rails sample application. This is a barebone Rails application that goes along their Starting With Ruby article, which provides more detailed information about how to deploy a Ruby application in Heroku. This guide focuses on instrumenting a Rails application with Datadog.
The sample application has a dependency pg which only resolves if you have Postgres installed locally. Install Postgres before you proceed.
You can verify that Postgres is installed successfully by running the psql command. It returns output similar to the following:
which psql
/usr/local/bin/psql
Get the code from the sample application and deploy it, as-is, to a new Heroku application.
# Decide a name for your application and export it as an environment variable
# (In this case, the name is ruby-heroku-datadog)
export APPNAME=ruby-heroku-datadog

# Get the sample application code
git clone https://github.com/heroku/ruby-getting-started.git
cd ruby-getting-started

# Login into Heroku
heroku login

# Create a new application
heroku create -a $APPNAME

# Deploy to Heroku
git push heroku main

# Open the application to check that it works
heroku open -a $APPNAME
Your default browser opens with the sample application. You should see something similar to this UI:
Connecting your Datadog account to your application and deploying the Datadog agent
The first step to get full observability into your Heroku application with Datadog is to deploy the Datadog agent and connect it to your Datadog account.
The way Datadog identifies your account is with an API key. Log into your Datadog account and navigate to the API keys section. Copy your API key:
Next, deploy the Datadog Agent into your application. This guide makes use of the Datadog Heroku Buildpack. You can learn more about Heroku Buildpacks and what they do in their official documentation.
# Enable Heroku Labs Dyno Metadata to set HEROKU_APP_NAME env variable automatically
heroku labs:enable runtime-dyno-metadata -a $APPNAME

# Set hostname in Datadog as appname.dynotype.dynonumber for metrics continuity
heroku config:add DD_DYNO_HOST=true

# Set your Datadog site (for example, us5.datadoghq.com)
heroku config:add DD_SITE=$DD_SITE

# Add this buildpack and set your Datadog API key
heroku buildpacks:add --index 1 https://github.com/DataDog/heroku-buildpack-datadog.git
heroku config:add DD_API_KEY=$DD_API_KEY

# Deploy to Heroku forcing a rebuild
git commit --allow-empty -m "Rebuild slug"
git push heroku main
Once the build finishes, the Datadog Agent is running in your application. Run the Datadog Agent status as explained in the appendix section to make sure everything is running correctly. You should look out for the following section:
[...]
  API Keys status
  ===============
    API key ending with 68306: API Key valid

[...]
This output signifies that the Datadog Agent is running in your Heroku application and successfully linked to your Datadog account.
If you open the Host Map in Datadog you can see that your dyno is reporting correctly in Datadog:
Setting up integrations
Datadog comes with more than 400 turn-key integrations that collect metrics from different tech stacks. The Datadog buildpack allows you to enable these integrations for your Heroku application.
Four commonly-used Heroku integration configuration examples are listed below.
Postgres
Heroku adds a Postgres database through an addon for every Rails application that gets deployed to Heroku. Check that the application has the Postgres addon enabled:
heroku addons -a $APPNAME
You should get the following output:
Add-on                                         Plan       Price  State
─────────────────────────────────────────────  ─────────  ─────  ───────
heroku-postgresql (postgresql-infinite-14462)  hobby-dev  free   created
 └─ as DATABASE

The table above shows add-ons and the attachments to the current app (ruby-heroku-datadog) or other apps.
Your example application already uses that database in its code, but you haven’t created the tables yet, run:
heroku run rake db:migrate -a $APPNAME
Running `rake db:migrate` attached to terminal... up, run.3559
Migrating to CreateWidgets (20140707111715)
== 20140707111715 CreateWidgets: migrating ====================================
-- create_table(:widgets)
   -> 0.0244s
== 20140707111715 CreateWidgets: migrated (0.0247s) ===========================
After, you can successfully see the /widgets endpoint of your application, which uses that database.
To enable the Postgres Datadog integration, retrieve the database credentials from Heroku. Run the following command from the psql terminal
heroku pg:credentials:url DATABASE -a $APPNAME
Integrations are enabled in a particular way when using the Datadog buildpack. You can learn how to enable any of the integrations in the buildpack documentation.
Create a datadog/conf.d folder at the root of your application:
cd ruby-getting-started
# Create the folder for the integrations configuration in your application code
mkdir -p datadog/conf.d/
Create a configuration file called postgres.yaml replacing with your host, dbname, username, and password with the information you got in the previous command:
init_config:

instances:
  - host: <YOUR HOSTNAME>
    port: <YOUR PORT>
    username: <YOUR USERNAME>
    password: <YOUR PASSWORD>
    dbname: <YOUR DBNAME>
    ssl: True
Instead of manually updating the configuration, you can set up your Postgres integration based on Heroku environment variables using the prerun script to replace those values before starting the Datadog Agent:
#!/usr/bin/env bash

# Update the Postgres configuration from above using the Heroku application environment variable
if [ -n "$DATABASE_URL" ]; then
  POSTGREGEX='^postgres://([^:]+):([^@]+)@([^:]+):([^/]+)/(.*)$'
  if [[ $DATABASE_URL =~ $POSTGREGEX ]]; then
    sed -i "s/<YOUR HOSTNAME>/${BASH_REMATCH[3]}/" "$DD_CONF_DIR/conf.d/postgres.d/conf.yaml"
    sed -i "s/<YOUR USERNAME>/${BASH_REMATCH[1]}/" "$DD_CONF_DIR/conf.d/postgres.d/conf.yaml"
    sed -i "s/<YOUR PASSWORD>/${BASH_REMATCH[2]}/" "$DD_CONF_DIR/conf.d/postgres.d/conf.yaml"
    sed -i "s/<YOUR PORT>/${BASH_REMATCH[4]}/" "$DD_CONF_DIR/conf.d/postgres.d/conf.yaml"
    sed -i "s/<YOUR DBNAME>/${BASH_REMATCH[5]}/" "$DD_CONF_DIR/conf.d/postgres.d/conf.yaml"
  fi
fi
Deploy to Heroku:
git add .
git commit -m "Enable postgres integration"
git push heroku main
Once the build finishes, the Datadog Agent starts the Postgres check. Run the Datadog Agent status as explained in the appendix section to make sure the Postgres check is running correctly. You should look out for the following section:
[...]

=========
Collector
=========

  Running Checks
  ==============

[...]

  postgres (5.4.0)
  ----------------
    Instance ID: postgres:e07ef94b907fe733 [OK]
    Configuration Source: file:/app/.apt/etc/datadog-agent/conf.d/postgres.d/conf.yaml
    Total Runs: 9
    Metric Samples: Last Run: 15, Total: 135
    Events: Last Run: 0, Total: 0
    Service Checks: Last Run: 1, Total: 9
    Average Execution Time : 102ms
    Last Execution Date : 2021-05-11 14:14:34 UTC (1620742474000)
    Last Successful Execution Date : 2021-05-11 14:14:34 UTC (1620742474000)
    metadata:
      version.major: 13
      version.minor: 2
      version.patch: 0
      version.raw: 13.2 (Ubuntu 13.2-1.pgdg20.04+1)
      version.scheme: semver

[...]
Once you have checked that the Postgres check is running correctly, you can start looking at the Postgres metrics available on the Metrics Summary page:
Redis
For Redis, attach the Heroku Redis add on to your Heroku application:
heroku addons:create heroku-redis:hobby-dev
To validate that Redis has successfully attached to your application, run the following command:
heroku addons:info REDIS
You should get an output similar to the following:
=== redis-cylindrical-59589
Attachments:  ruby-heroku-datadog::REDIS
Installed at: Wed Nov 17 2021 14:14:13 GMT+0100 (Central European Standard Time)
Owning app:   ruby-heroku-datadog
Plan:         heroku-redis:hobby-dev
Price:        free
State:        created
Retrieve the credentials from Heroku by running the following command:
heroku config -a $APPNAME | grep REDIS_URL
Create a configuration file named /datadog/conf.d/redisdb.yaml at the root of your application to replace your host, port, and password with information from the previous command:
init_config:

instances:
  - host: <YOUR_REDIS_HOST>
    password: <YOUR_REDIS_PASSWORD>
    port: <YOUR_REDIS_PORT>
Instead of manually updating the configuration, you can set up your Redis integration based on Heroku environment variables using the prerun script to replace those values before starting the Datadog Agent:
#!/usr/bin/env bash

# Update the Redis configuration from above using the Heroku application environment variable
if [ -n "$REDIS_URL" ]; then
  REDISREGEX='rediss?://([^:]*):([^@]+)@([^:]+):([^/]+)$'
  if [[ $REDIS_URL =~ $REDISREGEX ]]; then
    sed -i "s/<YOUR_REDIS_HOST>/${BASH_REMATCH[3]}/" "$DD_CONF_DIR/conf.d/redisdb.d/conf.yaml"
    sed -i "s/<YOUR_REDIS_PASSWORD>/${BASH_REMATCH[2]}/" "$DD_CONF_DIR/conf.d/redisdb.d/conf.yaml"
    sed -i "s/<YOUR_REDIS_PORT>/${BASH_REMATCH[4]}/" "$DD_CONF_DIR/conf.d/redisdb.d/conf.yaml"
  fi
fi
Deploy to Heroku:
# Deploy to Heroku
git add .
git commit -m "Enable redis integration"
git push heroku main
Once the build finishes, the Datadog Agent starts the Redis check. Run the Datadog Agent status to make sure the Redis check is running correctly.
The following output displays:
[...]

=========
Collector
=========

  Running Checks
  ==============

[...]

  redisdb (4.1.0)
  ---------------
    Instance ID: redisdb:eb3a3807075f89f0 [OK]
    Configuration Source: file:/app/.apt/etc/datadog-agent/conf.d/redisdb.d/conf.yaml
    Total Runs: 3
    Metric Samples: Last Run: 45, Total: 135
    Events: Last Run: 0, Total: 0
    Service Checks: Last Run: 1, Total: 3
    Average Execution Time : 6ms
    Last Execution Date : 2021-11-17 13:56:17 UTC (1637157377000)
    Last Successful Execution Date : 2021-11-17 13:56:17 UTC (1637157377000)
    metadata:
      version.major: 6
      version.minor: 2
      version.patch: 3
      version.raw: 6.2.3
      version.scheme: semver

[...]
Sidekiq
Sidekiq is a background processing framework for Ruby. If you are using Sidekiq Pro or Enterprise, you can install the Datadog integration for Sidekiq.
Install the dogstatsd-ruby package:
gem install dogstatsd-ruby
Enable Sidekiq Pro metric collection in your initializer:
    require 'datadog/statsd' # gem 'dogstatsd-ruby'

    Sidekiq::Pro.dogstatsd = ->{ Datadog::Statsd.new('localhost', 8125, namespace:'sidekiq') }

    Sidekiq.configure_server do |config|
      config.server_middleware do |chain|
        require 'sidekiq/middleware/server/statsd'
        chain.add Sidekiq::Middleware::Server::Statsd
      end
    end
If you are using Sidekiq Enterprise and want to collect historical metrics, include the following:
      Sidekiq.configure_server do |config|
        # history is captured every 30 seconds by default
        config.retain_history(30)
      end
Add the following to your datadog/prerun.sh script:
cat << 'EOF' >> "$DATADOG_CONF"

dogstatsd_mapper_profiles:
  - name: sidekiq
    prefix: "sidekiq."
    mappings:
      - match: 'sidekiq\.sidekiq\.(.*)'
        match_type: "regex"
        name: "sidekiq.$1"
      - match: 'sidekiq\.jobs\.(.*)\.perform'
        name: "sidekiq.jobs.perform"
        match_type: "regex"
        tags:
          worker: "$1"
      - match: 'sidekiq\.jobs\.(.*)\.(count|success|failure)'
        name: "sidekiq.jobs.worker.$2"
        match_type: "regex"
        tags:
          worker: "$1"
EOF
Deploy to Heroku:
git add .
git commit -m "Enable sidekiq integration"
git push heroku main
Once the build finishes, the Datadog Agent starts the Sidekiq check. Run the Datadog Agent status to make sure the Sidekiq check is running correctly.
Memcached
Memcached is a distributed memory object caching system that is popular in Rails applications. In this example, you can attach the Heroku Memcached Cloud add on to your Heroku application:
heroku addons:create memcachedcloud:30
To check that Memcached has been successfully attached to your application, run the following command:
heroku addons | grep -A2 memcachedcloud
The following output displays:
memcachedcloud (memcachedcloud-fluffy-34783)   30         free   created
 └─ as MEMCACHEDCLOUD
Retrieve the credentials from Heroku by running the following:
heroku config | grep MEMCACHEDCLOUD
Create a configuration file named /datadog/conf.d/mcache.yaml at the root of your application to replace your host, port, username, and password with information from the previous command:
instances:
  - url: <YOUR_MCACHE_HOST>
    port: <YOUR_MCACHE_PORT>
    username: <YOUR_MCACHE_USERNAME>
    password: <YOUR_MCACHE_PASSWORD>
Instead of manually updating the configuration, you can set up your Memcached integration based on Heroku environment variables using the prerun script to replace those values before starting the Datadog Agent:
#!/usr/bin/env bash

# Update the Memcached configuration from above using the Heroku application environment variable
if [ -n "$MEMCACHEDCLOUD_SERVERS" ]; then
  MCACHEREGEX='([^:]+):([^/]+)$'
  if [[ $MEMCACHEDCLOUD_SERVERS =~ $MCACHEREGEX ]]; then
    sed -i "s/<YOUR_MCACHE_HOST>/${BASH_REMATCH[1]}/" "$DD_CONF_DIR/conf.d/mcache.d/conf.yaml"
    sed -i "s/<YOUR_MCACHE_PORT>/${BASH_REMATCH[2]}/" "$DD_CONF_DIR/conf.d/mcache.d/conf.yaml"
  fi
  sed -i "s/<YOUR_MCACHE_USERNAME>/${MEMCACHEDCLOUD_USERNAME}/" "$DD_CONF_DIR/conf.d/mcache.d/conf.yaml"
  sed -i "s/<YOUR_MCACHE_PASSWORD>/${MEMCACHEDCLOUD_PASSWORD}/" "$DD_CONF_DIR/conf.d/mcache.d/conf.yaml"
fi
Deploy to Heroku:
git add .
git commit -m "Enable memcached integration"
git push heroku main
Once the build finishes, the Datadog Agent starts the Memcached check. Run the Datadog Agent status to make sure the Memcached check is running correctly.
The following output displays:
[...]

=========
Collector
=========

  Running Checks
  ==============

[...]

  mcache (2.0.0)
  --------------
    Instance ID: mcache:ca47ee7a0c236107 [OK]
    Configuration Source: file:/app/.apt/etc/datadog-agent/conf.d/mcache.d/conf.yaml
    Total Runs: 2
    Metric Samples: Last Run: 27, Total: 54
    Events: Last Run: 0, Total: 0
    Service Checks: Last Run: 1, Total: 2
    Average Execution Time : 9ms
    Last Execution Date : 2021-11-18 12:28:45 UTC (1637238525000)
    Last Successful Execution Date : 2021-11-18 12:28:45 UTC (1637238525000)
    metadata:
      version.major: 1
      version.minor: 4
      version.patch: 17
      version.raw: 1.4.17
      version.scheme: semver

[...]
Traces
To get distributed tracing from your Heroku Ruby application, enable instrumentation.
Ensure that you are in the folder with the application code:
cd ruby-getting-started
Edit your Gemfile and add the ddtrace:
source 'https://rubygems.org'
gem 'ddtrace', require: 'ddtrace/auto_instrument'
Install the gem with bundle install:
bundle install
Before committing the changes and pushing to Heroku, set Unified Tagging for the application:
# Set the environment of your application
heroku config:add DD_ENV=production -a $APPNAME

# Set the version of your application
heroku config:add DD_VERSION=0.1 -a $APPNAME

# Set the service of your application
heroku config:add DD_SERVICE=$APPNAME -a $APPNAME
Commit your changes and push to Heroku:
git add .
git commit -m "Enable distributed tracing"
git push heroku main
During the build, error messages are displayed about the tracer not being able to reach the Datadog APM Agent endpoint. This is normal, as during the build process, the Datadog Agent hasn’t started yet. You can ignore these messages:
remote:        Download Yarn at https://yarnpkg.com/en/docs/install
remote:        E, [2021-05-14T10:21:27.664244 #478] ERROR -- ddtrace: [ddtrace] (/tmp/build_d5cedb1c/vendor/bundle/ruby/2.6.0/gems/ddtrace-0.48.0/lib/ddtrace/transport/http/client.rb:35:in `rescue in send_request') Internal error during HTTP transport request. Cause: Failed to open TCP connection to 127.0.0.1:8126 (Connection refused - connect(2) for "127.0.0.1" port 8126) Location: /tmp/build_d5cedb1c/vendor/ruby-2.6.6/lib/ruby/2.6.0/net/http.rb:949:in `rescue in block in connect'
Once the build finishes, your application sends traces to Datadog. You can start generating traffic to your application (for example, by visiting the /widgets page of your application) to get a good flow of traces.
Run the Datadog Agent status as explained in the appendix section to make sure the APM agent is running correctly and sending traces to Datadog. You should look out for the following section:
[...]

=========
APM Agent
=========
  Status: Running
  Pid: 54
  Uptime: 85 seconds
  Mem alloc: 13,971,888 bytes
  Hostname: ruby-heroku-datadog.web.1
  Receiver: localhost:8126
  Endpoints:
    https://trace.agent.datadoghq.com

  Receiver (previous minute)
  ==========================
    From ruby 2.6.6 (ruby-x86_64-linux), client 0.48.0
      Traces received: 43 (55,431 bytes)
      Spans received: 129

    Default priority sampling rate: 100.0%
    Priority sampling rate for 'service:ruby-heroku-datadog,env:': 100.0%
    Priority sampling rate for 'service:ruby-heroku-datadog,env:production': 100.0%

  Writer (previous minute)
  ========================
    Traces: 0 payloads, 0 traces, 0 events, 0 bytes
    Stats: 0 payloads, 0 stats buckets, 0 bytes

[...]
That output shows that the APM Agent is running correctly and sending traces to Datadog.
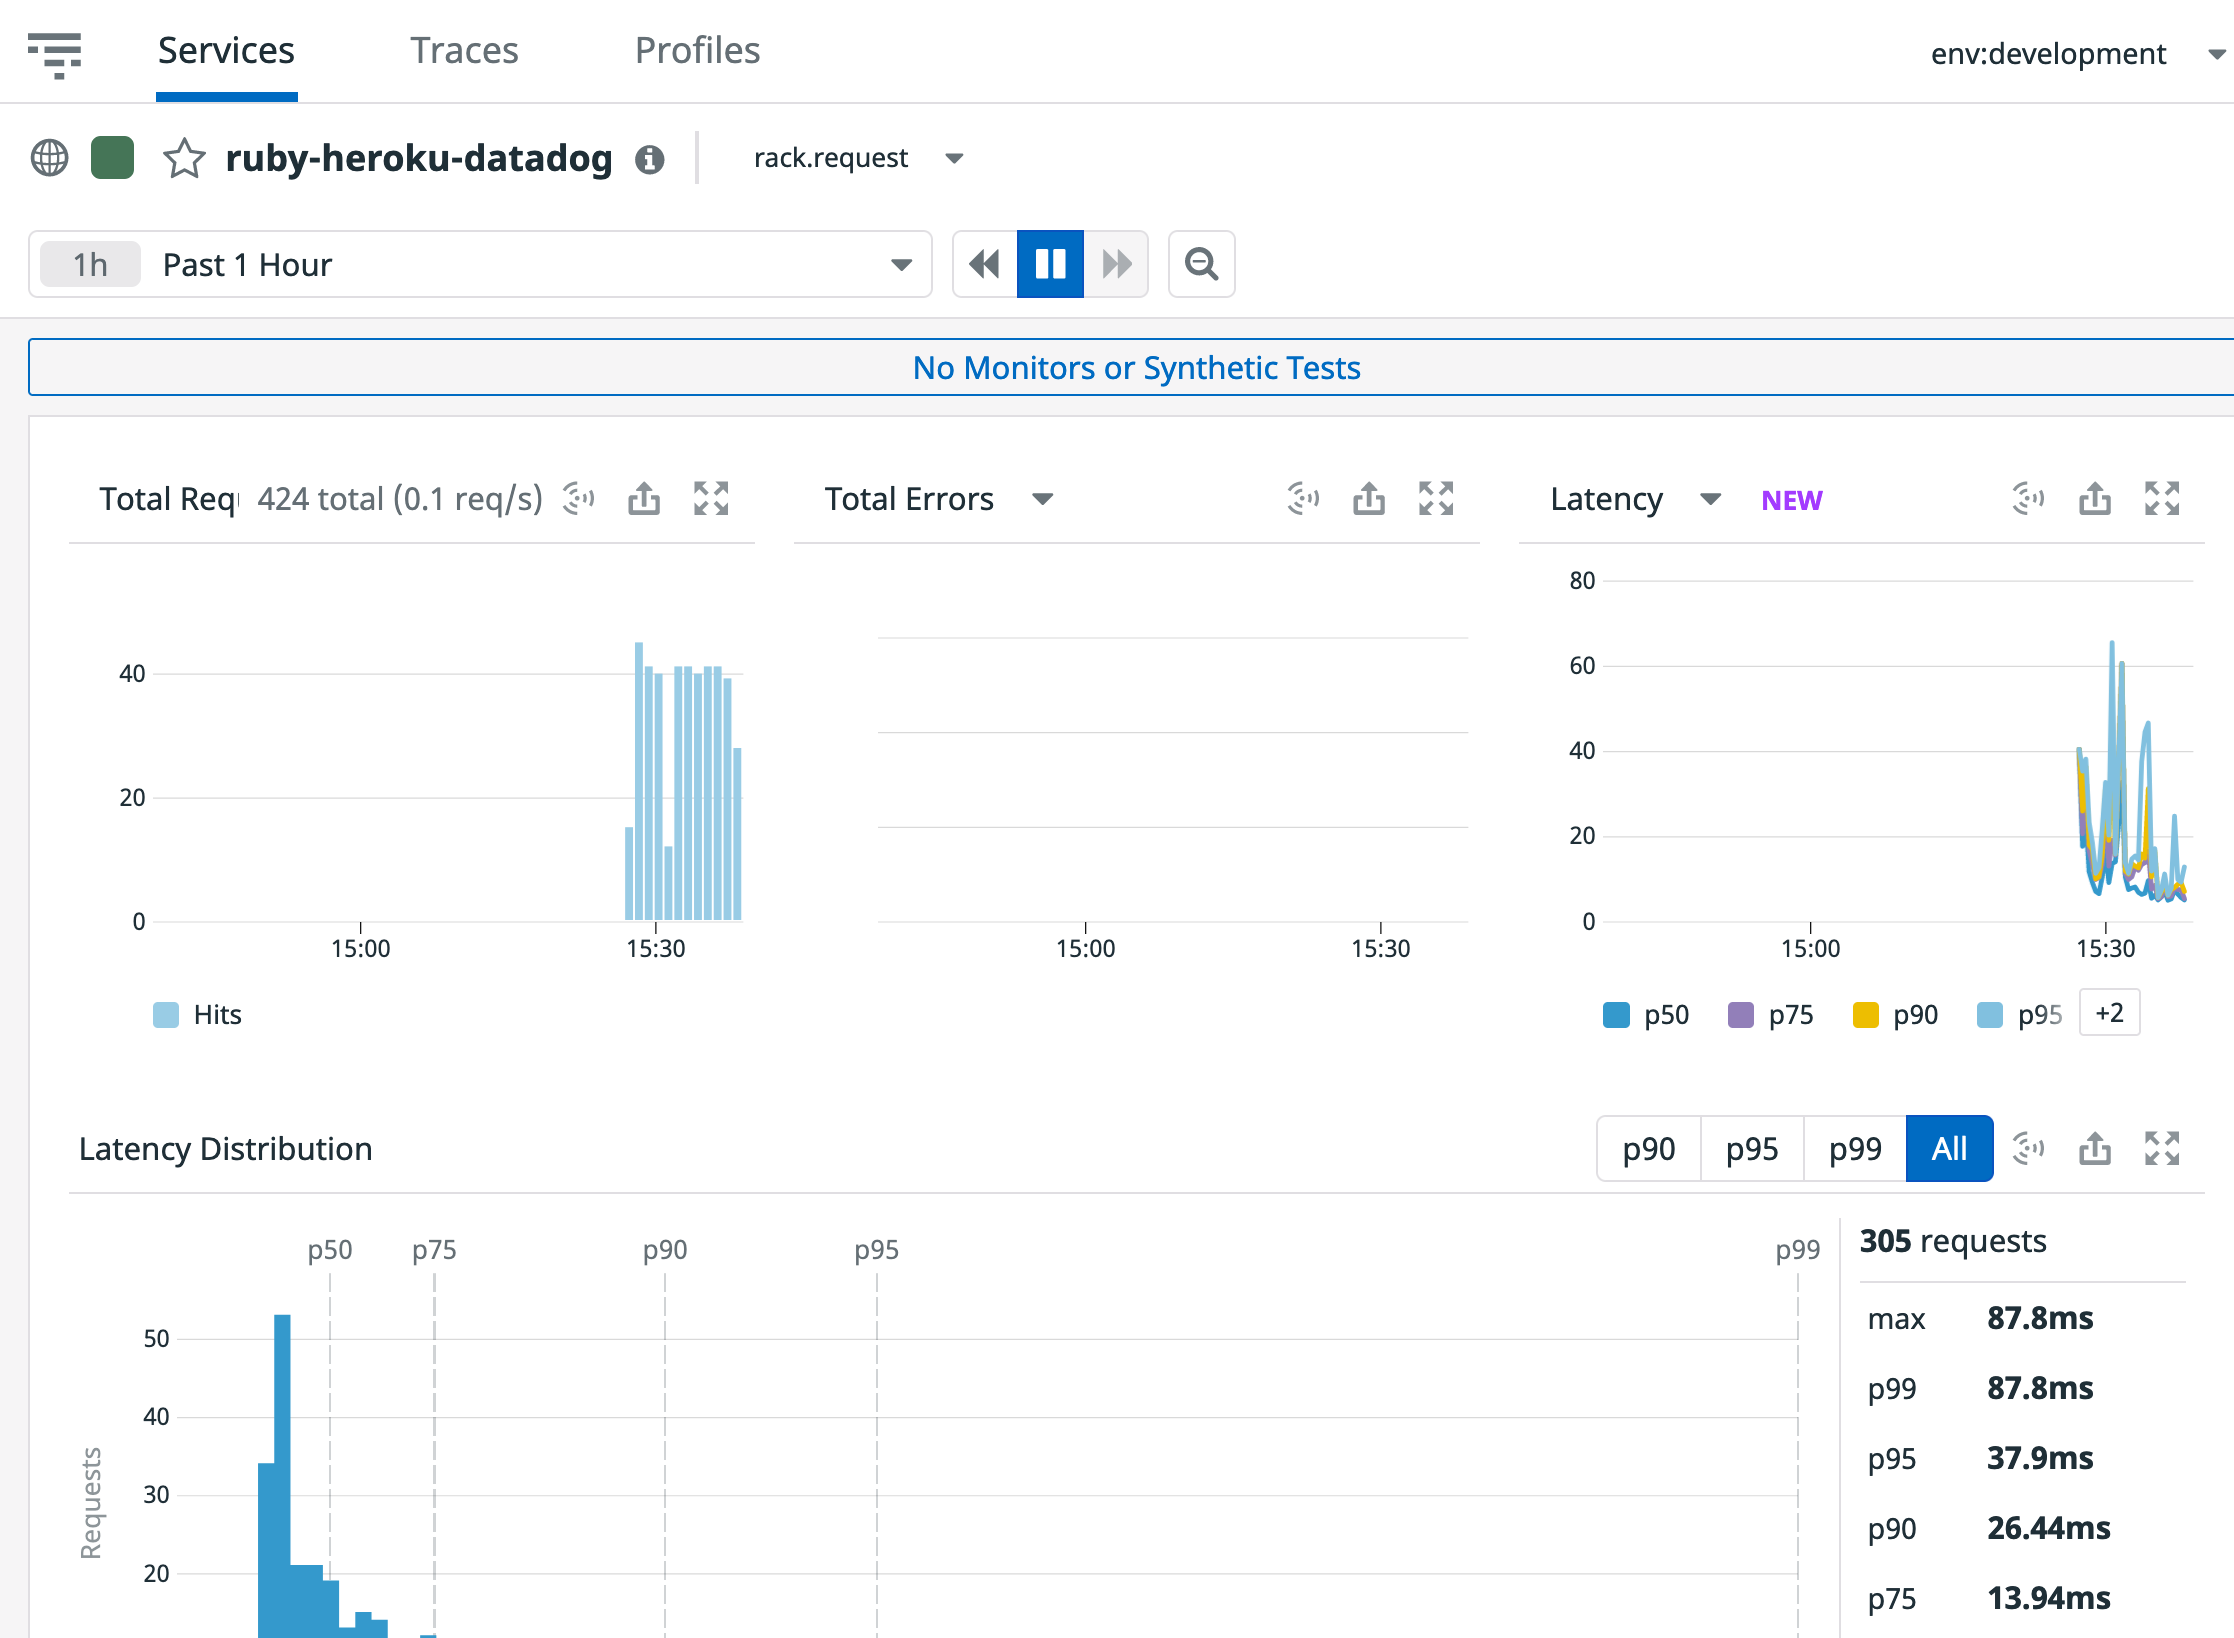
Navigate to the APM traces section to see your traces:
Navigate to the Service Catalog to see all your application services and your application service view:
Logs
Next, enable logs by setting up Heroku log drain.
When using log drain, all logs arrive in Datadog from the same ddsource (usually heroku), so automatic parsing of logs using integrations other than Heroku does not happen.
Generating your Rails logs
To configure your Rails logs, Datadog recommends using Lograge. For this sample application, set it so that logs and traces are correlated.
Ensure that you are in the folder with the application code:
cd ruby-getting-started
Edit your Gemfile and add lograge:
gem 'lograge'
Install the gem with bundle install:
bundle install
To configure Lograge, create a file named config/initializers/lograge.rb and add the following:
Rails.application.configure do
  # Lograge config
  config.lograge.enabled = true

  # This specifies to log in JSON format
  config.lograge.formatter = Lograge::Formatters::Json.new

  ## Disables log coloration
  config.colorize_logging = false

  # Log to STDOUT
  config.lograge.logger = ActiveSupport::Logger.new(STDOUT)

  config.lograge.custom_options = lambda do |event|
    # Retrieves trace information for current thread
    correlation = Datadog::Tracing.correlation

    {
      # Adds IDs as tags to log output
      :dd => {
        # To preserve precision during JSON serialization, use strings for large numbers
        :trace_id => correlation.trace_id.to_s,
        :span_id => correlation.span_id.to_s,
        :env => correlation.env.to_s,
        :service => correlation.service.to_s,
        :version => correlation.version.to_s
      },
      :ddsource => ["ruby"],
      :params => event.payload[:params].reject { |k| %w(controller action).include? k }
    }
  end
end
Deploy to Heroku:
git add .
git commit -m "Add lograge"
git push heroku main
Setting up Heroku log drain
Heroku has a native log router called log drain, which collects logs from all the dynos running in your application and sends them to Heroku. The logs include your application logs, the Heroku router logs, and the Heroku system dyno logs. You can set the log drain to route these logs to Datadog. The log drain sends Heroku system logs to Datadog from ddsource=heroku.
Setting up the Heroku log drain also opens the door to get dyno system metrics (CPU, memory) into Datadog.
To set up the Heroku log drain from a terminal, run the following:
export APPNAME=<YOUR_APPLICATION_NAME>
export DD_ENV=<YOUR_APPLICATION_ENVIRONMENT> # example: production, staging
export DD_SERVICE=<YOUR_SERVICE_NAME>

heroku drains:add "https://http-intake.logs.datadoghq.com/api/v2/logs?dd-api-key=$DD_API_KEY&ddsource=heroku&env=$DD_ENV&service=$DD_SERVICE&host=${APPNAME}.web.1" -a $APPNAME
To get system metrics from your dynos, apart from enabling the log drain, enable log-runtime-metrics as well:
heroku labs:enable log-runtime-metrics -a $APPNAME

# Restart your application
heroku restart -a $APPNAME
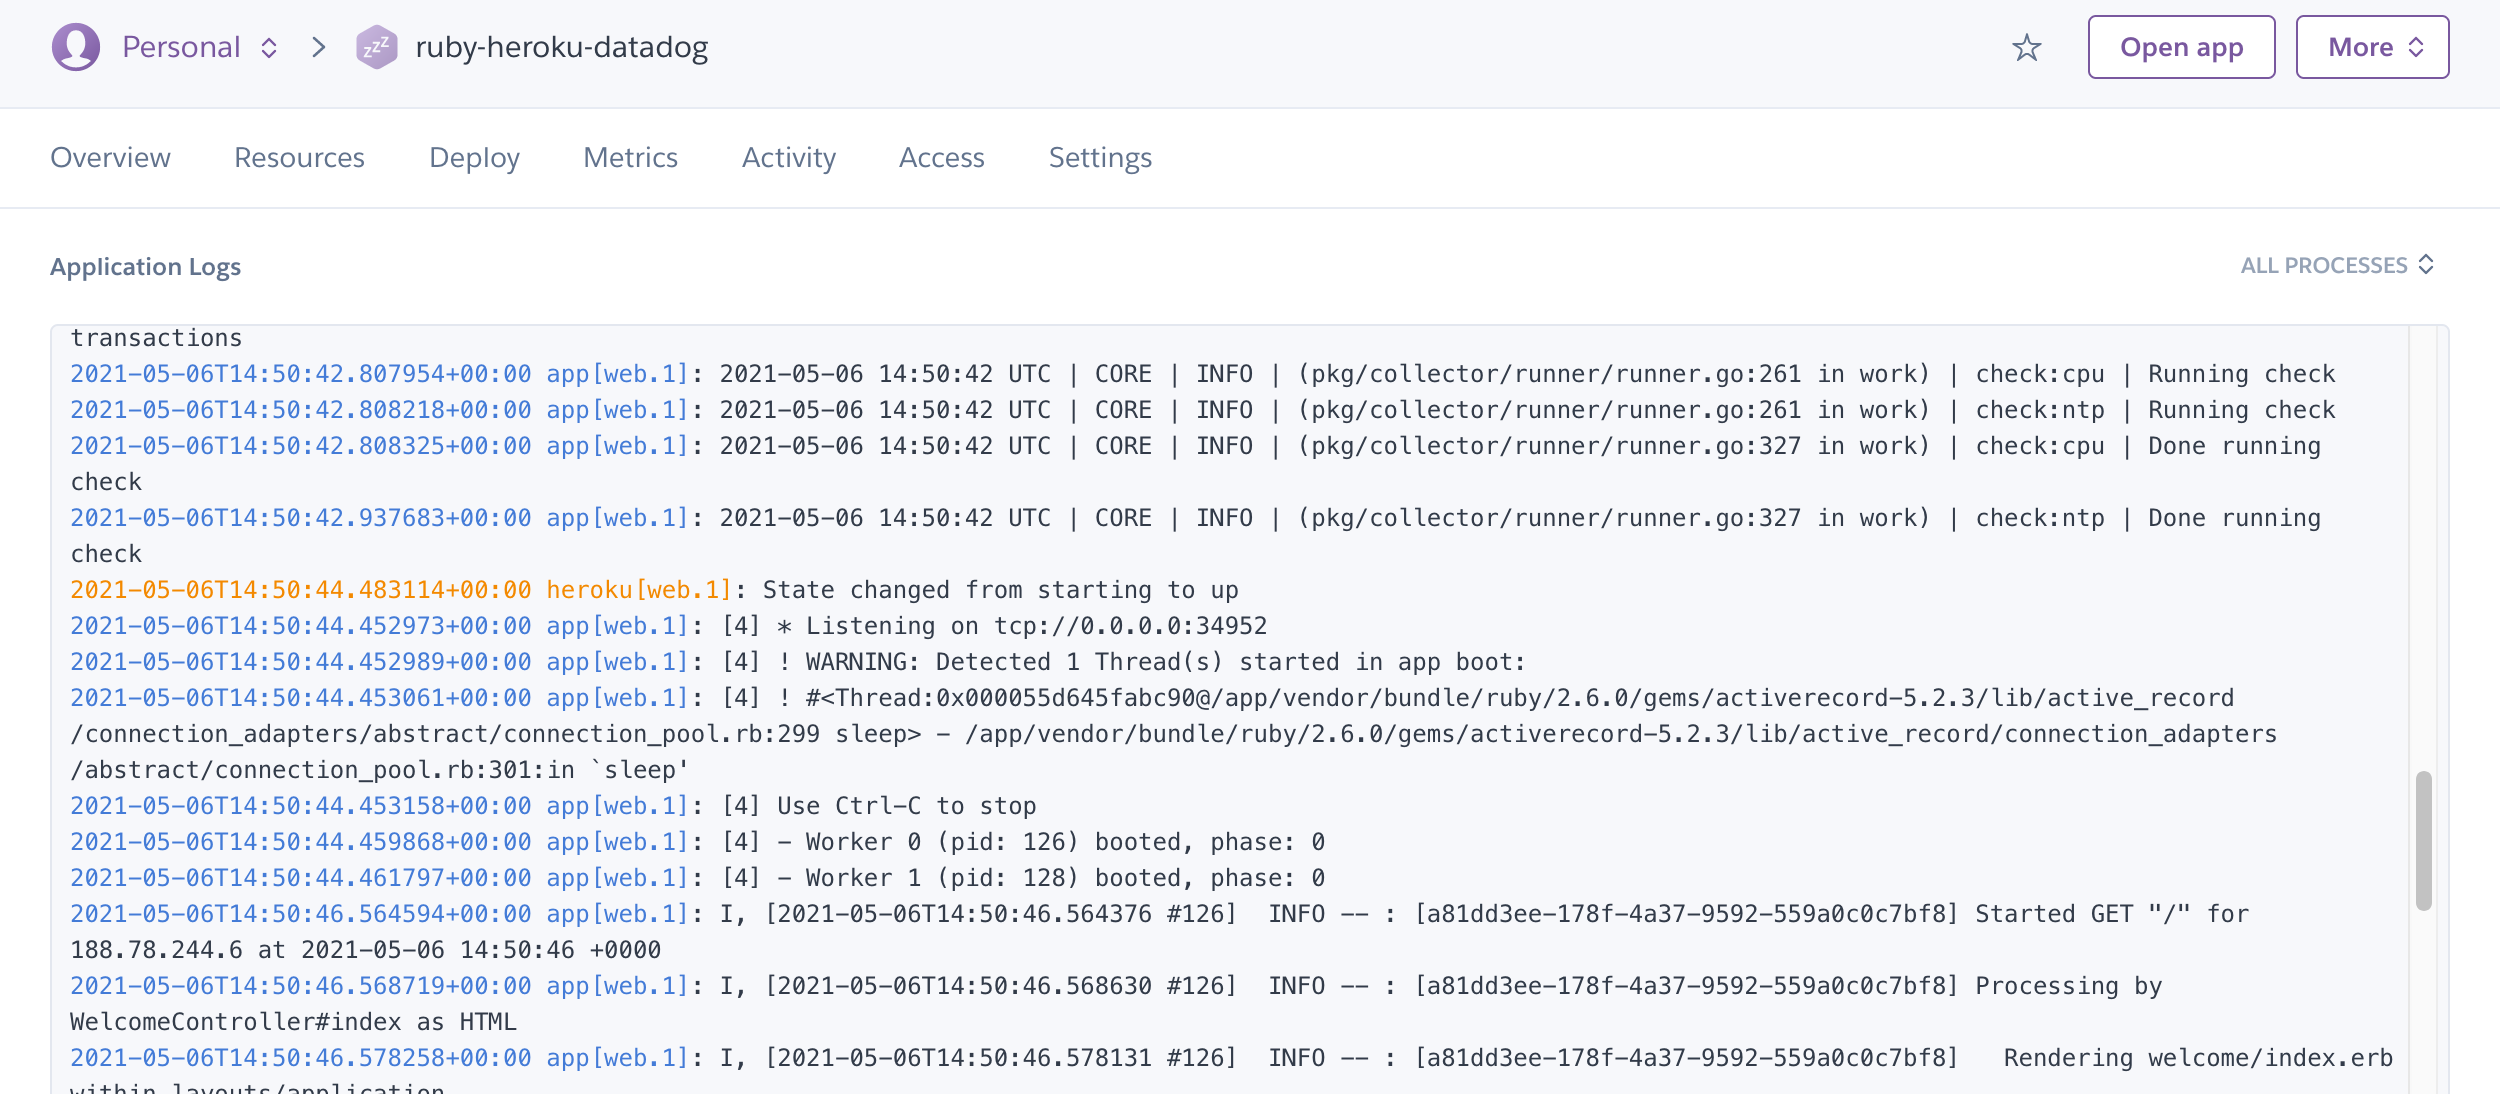
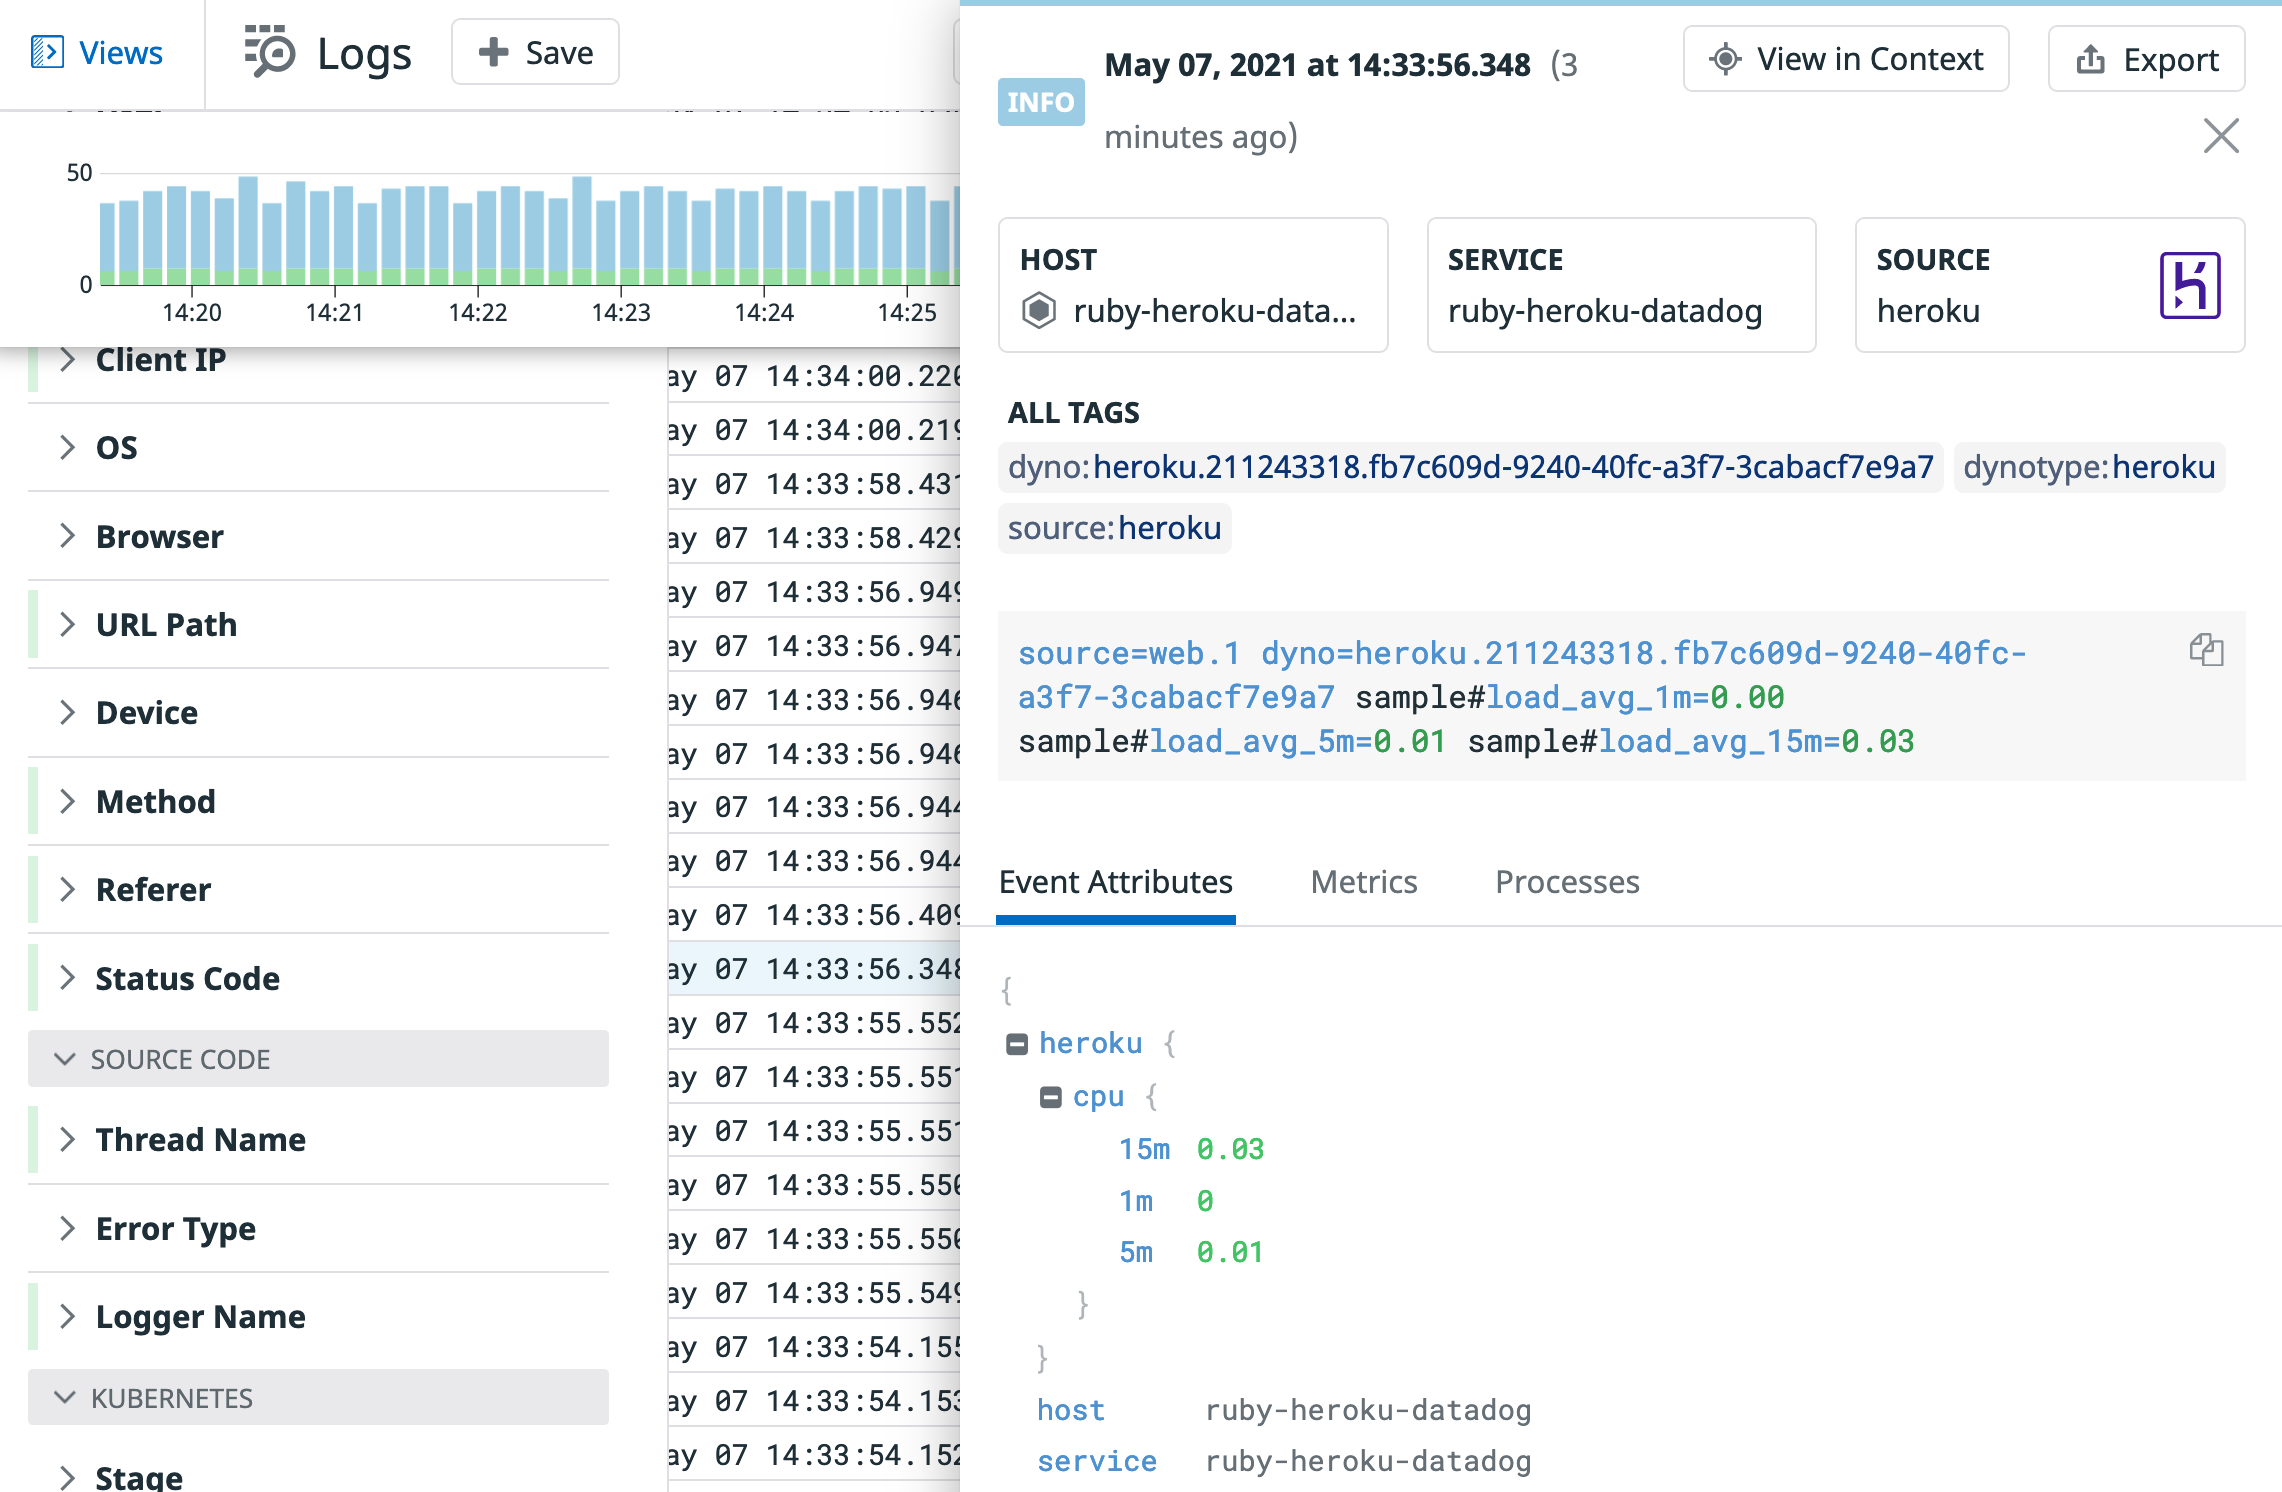
Once the drain has been set up, your Heroku logs appear in the log section of Datadog.
Generating metrics from Heroku router logs
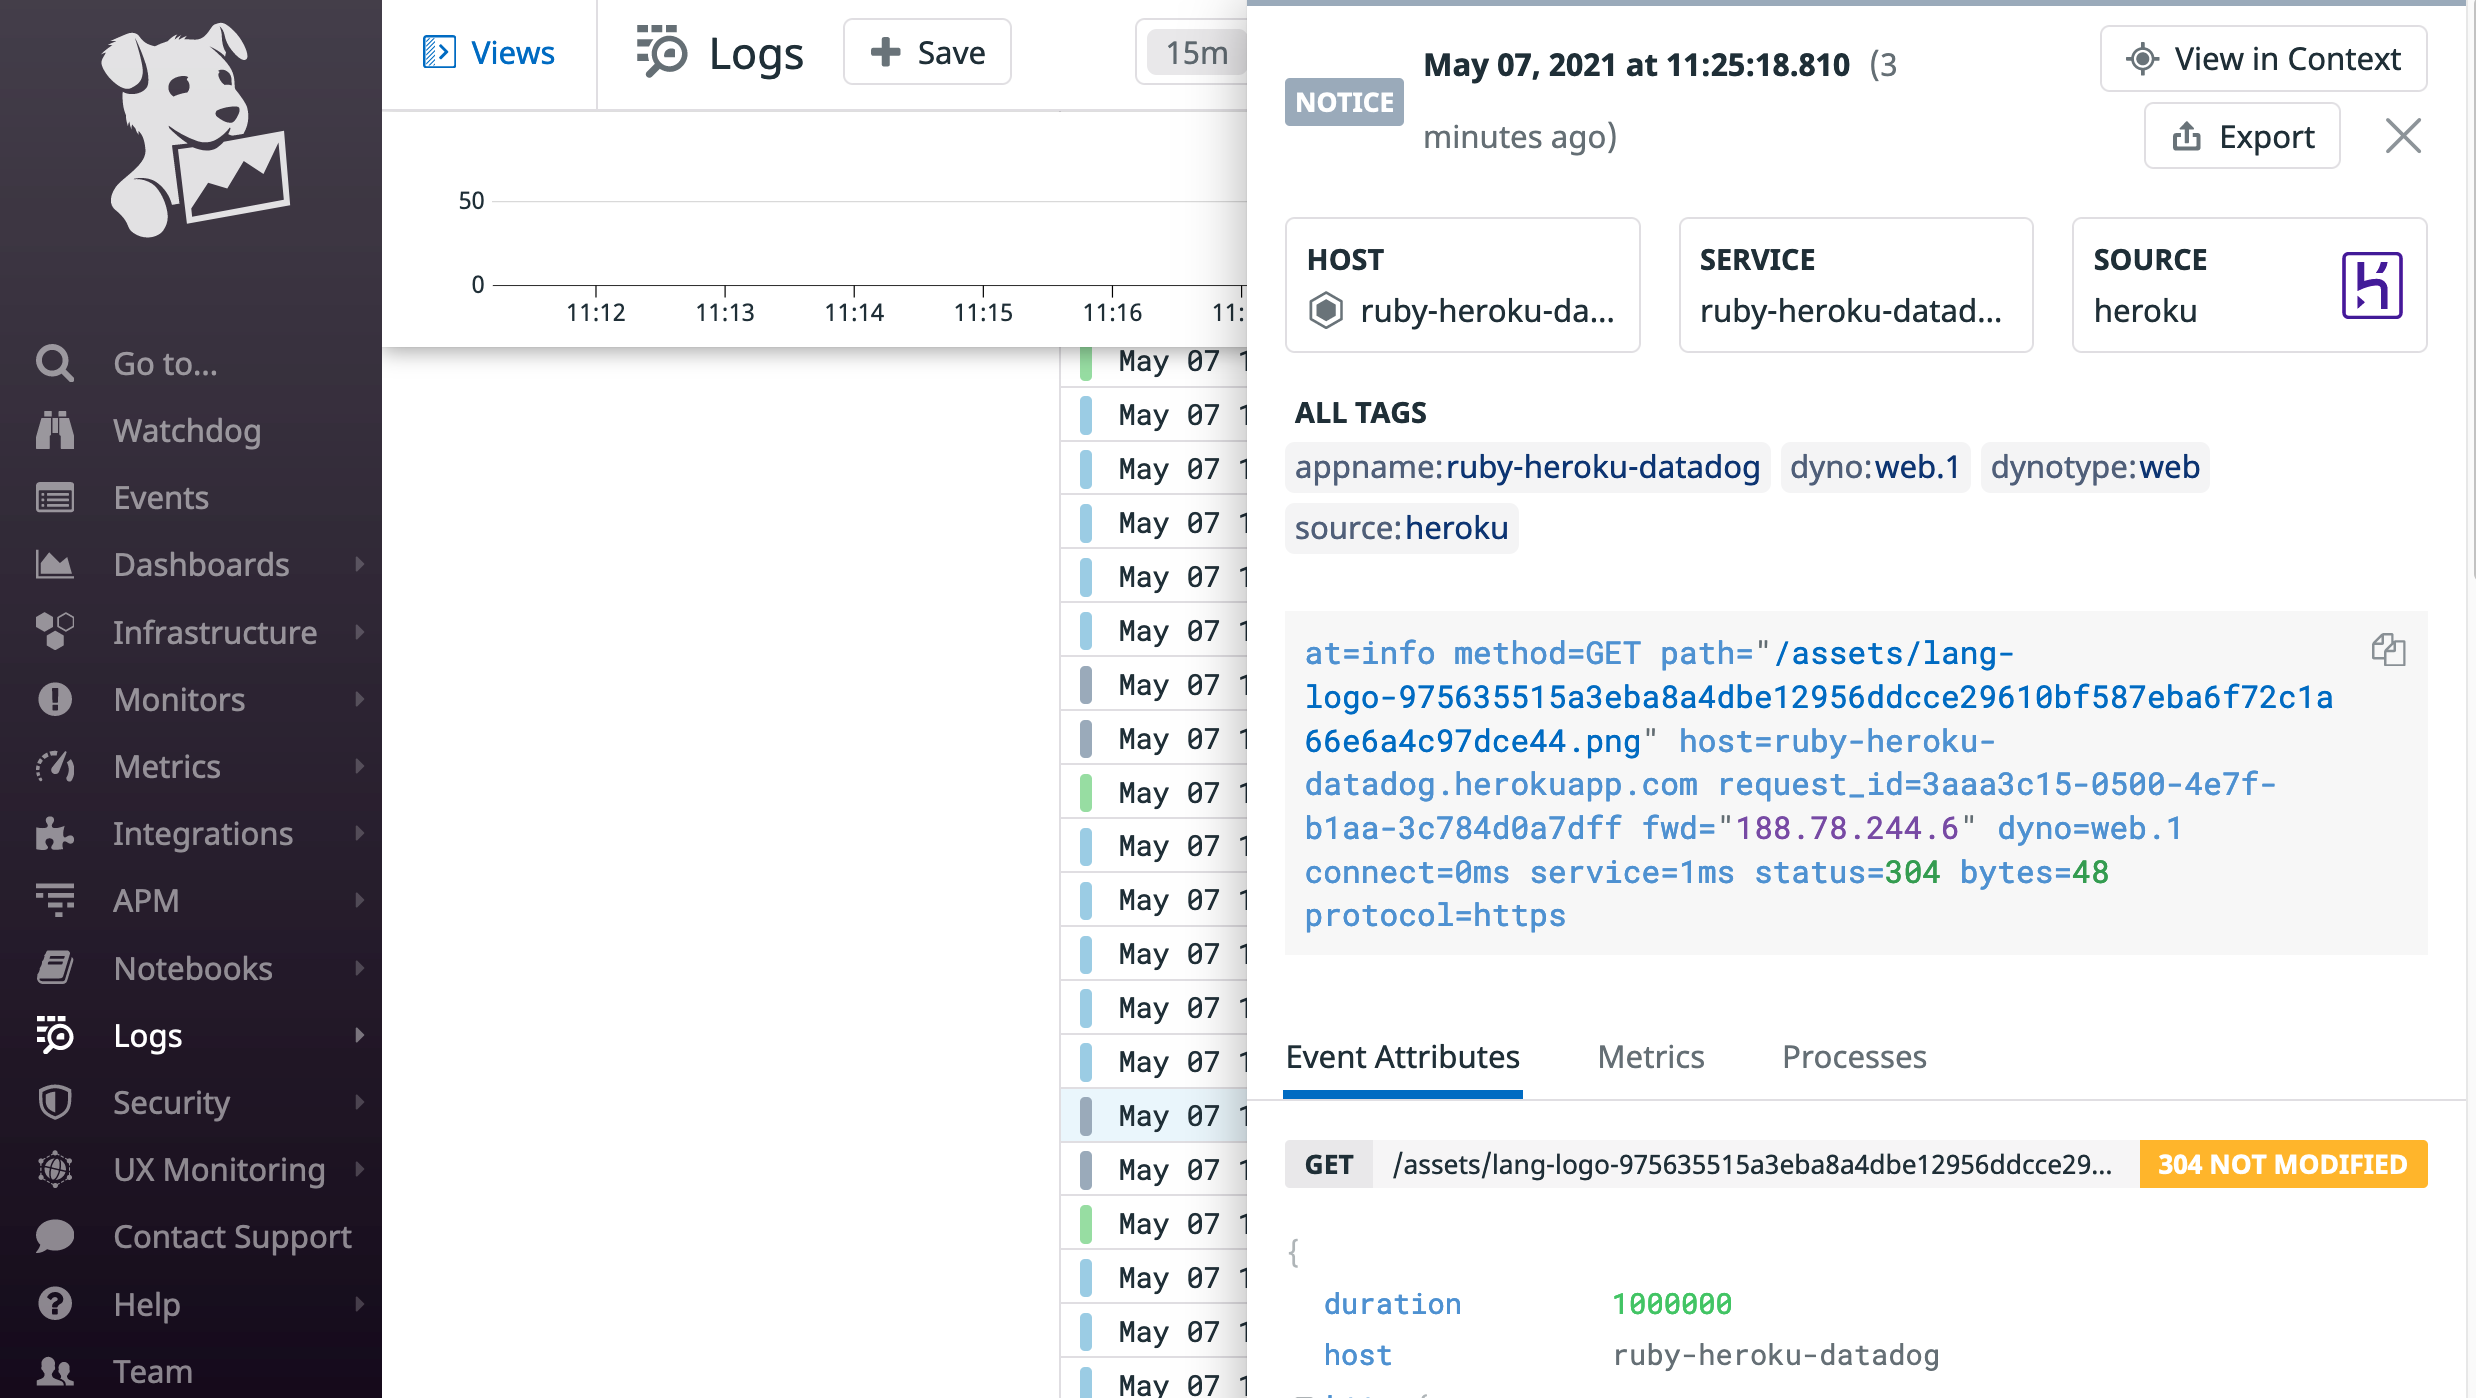
Any traffic routed to your application generates a Heroku router log:
As seen, the Heroku router logs get parsed automatically. With the Heroku integration log pipeline, appname, dyno, and dynotype extracted as tags:
You can generate a latency metric based on those parsed parameters.
Navigate to Logs -> Generate Metrics and click on the “+ New Metric” button:
Define the query as Source:heroku to filter all Heroku logs. Select the Duration measure. Also, you want to be able to group that metric by appname, dyno, dynotype, and @http.status_code. Remember that metrics generated by log parsing are considered Custom Metrics. Datadog recommends generating traffic to your application to get a good flow of new log entries.
Finally, add a name for your metric and click Create Metric:
Once the rule has been created, wait for a few minutes to gather the new metrics. Then, click on “See in Metric Explorer” to have a look to your new metric:
Generating Datadog metrics from Heroku metric logs
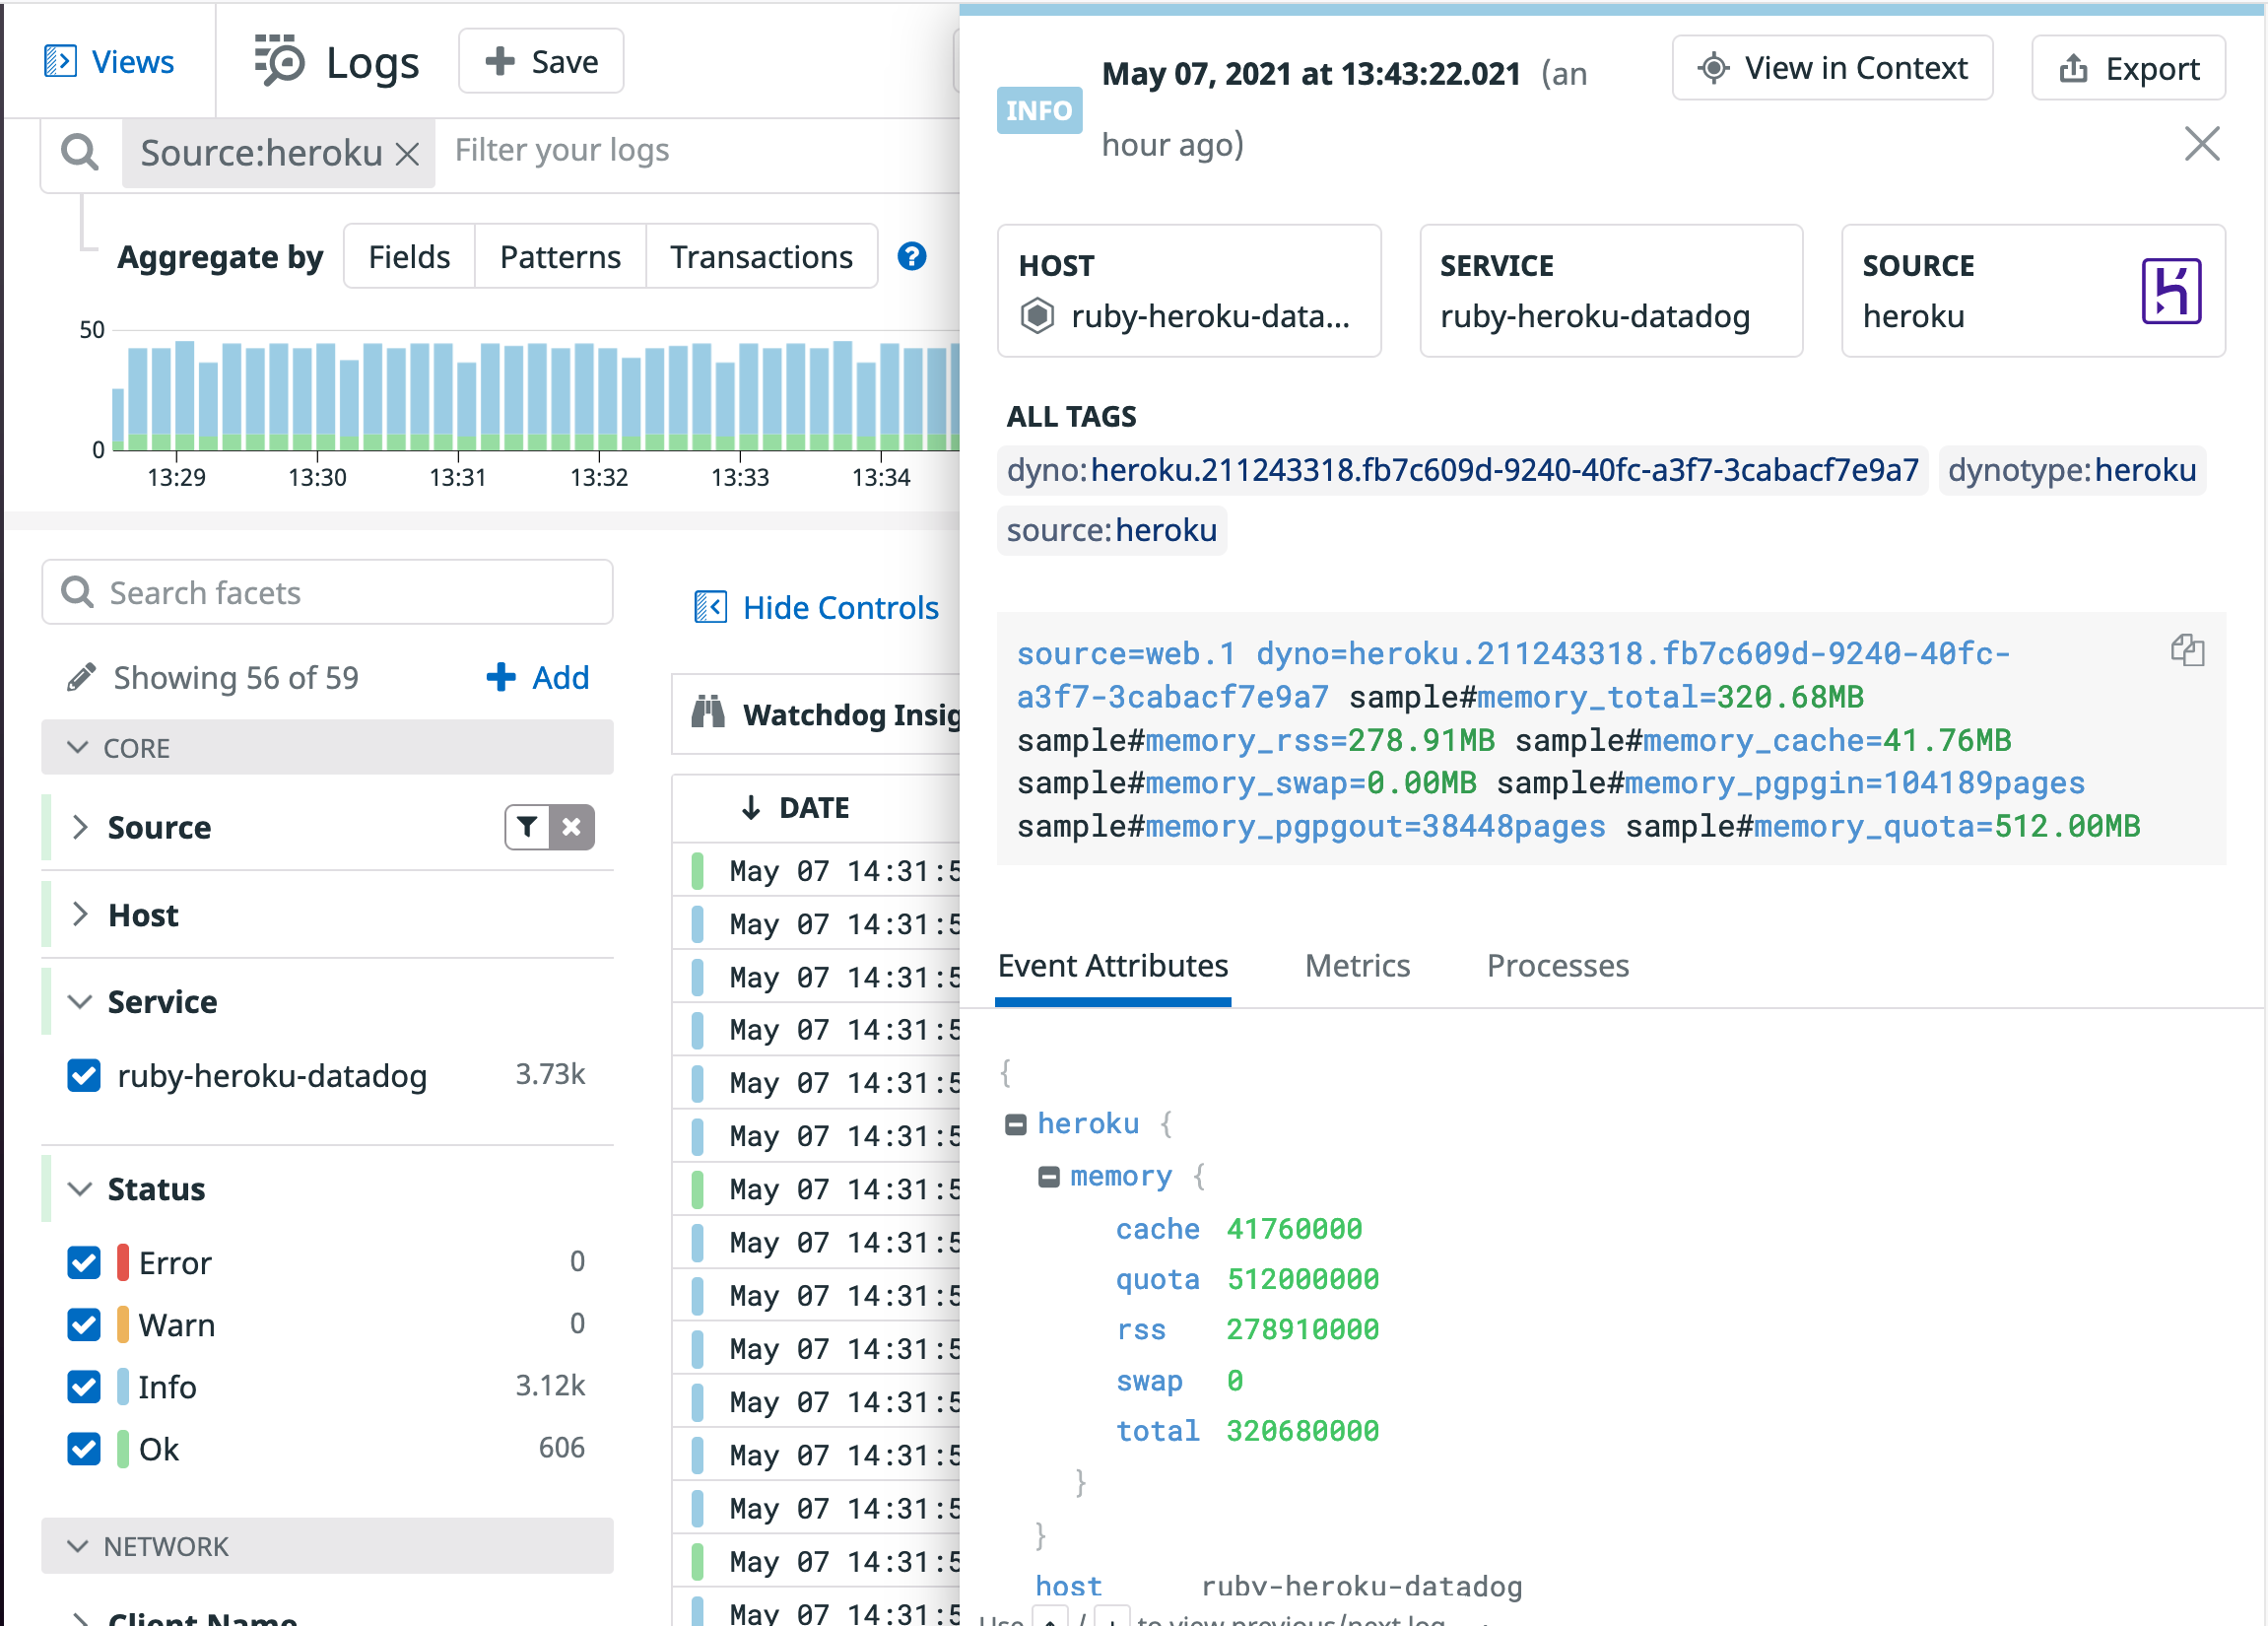
If log-runtime-metrics is set up for your application, Heroku generates log entries with system metrics for each of the dynos:
These logs are also automatically parsed by the Heroku log integration pipeline, extracting the following measures:
@heroku.cpu.1m
@heroku.cpu.5m
@heroku.cpu.15m
@heroku.memory.cache
@heroku.memory.quota
@heroku.memory.rss
@heroku.memory.swap
@heroku.memory.total
You can learn about what each of these values mean in the official Heroku documentation.
Follow the same steps explained on the previous section to generate metrics with 15 month retention for each of those measures.
Correlating logs and traces
If you follow the configuration instructions above, logs sent from the Heroku log drain are correlated to traces.
Note: Heroku router and system logs are generated by Heroku, and correlating them to traces is not possible.
You can check that the configuration was successful by navigating to the Logs view to see that the Rails application logs have their correlated trace:
Summary
In this guide you have taken a sample Rails application, deployed it to Heroku, and instrumented it with Datadog to get metrics, dyno system metrics, logs, traces, and integrations set up.
To continue instrumenting your application with other Datadog integrations, follow the same steps taken for the Postgres integration one, with the configuration files documented in the official integrations documentation.
Appendix: Getting the Datadog Agent status
Getting the Datadog Agent status is a good way to confirm that the Datadog Agent is running correctly and to debug potential issues. First, SSH into your dyno using heroku ps:exec:
heroku ps:exec -a $APPNAME

# Establishing credentials... done
# Connecting to web.1 on ⬢ ruby-heroku-datadog...
# DD_API_KEY environment variable not set. Run: heroku config:add DD_API_KEY=<your API key>
#The Datadog Agent has been disabled. Unset the DISABLE_DATADOG_AGENT or set missing environment variables.

~ $
You can ignore the warnings about the DD_API_KEY not being set. This is normal. The reason is that Heroku doesn’t set configuration variables for the SSH session itself, but the Datadog Agent process was able to access those.
Once inside the SSH session, execute the Datadog status command:
~ $ agent-wrapper status

Getting the status from the agent.

===============
Agent (v7.27.0)
===============

  Status date: 2021-04-30 10:49:50.692 UTC (1619779790692)
  Agent start: 2021-04-30 10:32:54.713 UTC (1619778774713)
  Pid: 52
  Go Version: go1.14.12
  Python Version: 3.8.5
  Build arch: amd64
  Agent flavor: agent
  Check Runners: 4
  Log File: /app/.apt/var/log/datadog/datadog.log
  Log Level: info

[...]
Further Reading
Additional helpful documentation, links, and articles:


