- Essentials
- Getting Started
- Datadog
- Datadog Site
- DevSecOps
- Serverless for AWS Lambda
- Agent
- Integrations
- Containers
- Dashboards
- Monitors
- Logs
- APM Tracing
- Profiler
- Tags
- API
- Service Catalog
- Session Replay
- Continuous Testing
- Synthetic Monitoring
- Incident Management
- Database Monitoring
- Cloud Security Management
- Cloud SIEM
- Application Security Management
- Workflow Automation
- CI Visibility
- Test Visibility
- Test Impact Analysis
- Code Analysis
- Learning Center
- Support
- Glossary
- Standard Attributes
- Guides
- Agent
- Integrations
- OpenTelemetry
- Developers
- Authorization
- DogStatsD
- Custom Checks
- Integrations
- Create an Agent-based Integration
- Create an API Integration
- Create a Log Pipeline
- Integration Assets Reference
- Build a Marketplace Offering
- Create a Tile
- Create an Integration Dashboard
- Create a Recommended Monitor
- Create a Cloud SIEM Detection Rule
- OAuth for Integrations
- Install Agent Integration Developer Tool
- Service Checks
- IDE Plugins
- Community
- Guides
- API
- Datadog Mobile App
- CoScreen
- Cloudcraft
- In The App
- Dashboards
- Notebooks
- DDSQL Editor
- Sheets
- Monitors and Alerting
- Infrastructure
- Metrics
- Watchdog
- Bits AI
- Service Catalog
- API Catalog
- Error Tracking
- Service Management
- Infrastructure
- Application Performance
- APM
- Continuous Profiler
- Database Monitoring
- Data Streams Monitoring
- Data Jobs Monitoring
- Digital Experience
- Real User Monitoring
- Product Analytics
- Synthetic Testing and Monitoring
- Continuous Testing
- Software Delivery
- CI Visibility
- CD Visibility
- Test Optimization
- Code Analysis
- Quality Gates
- DORA Metrics
- Security
- Security Overview
- Cloud SIEM
- Cloud Security Management
- Application Security Management
- AI Observability
- Log Management
- Observability Pipelines
- Log Management
- Administration
Regression
Robust trend
| Function | Description | Example |
|---|---|---|
robust_trend() | Fit a robust regression trend line using Huber loss. | robust_trend(avg:<METRIC_NAME>{*}) |
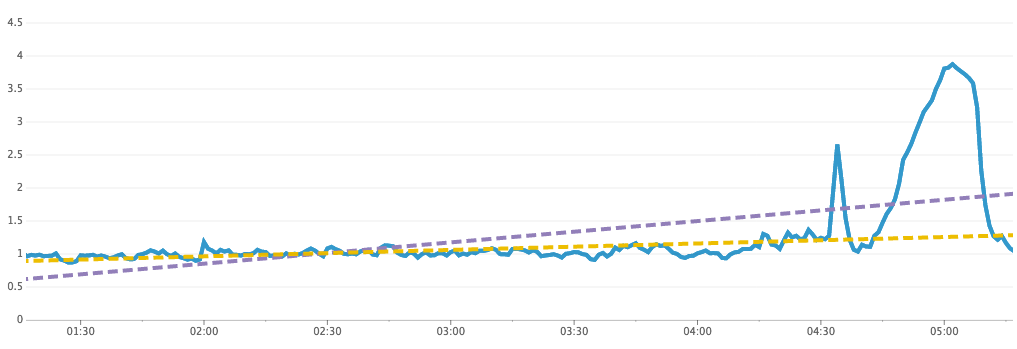
The most common type of linear regression—ordinary least squares (OLS)—can be heavily influenced by a small number of points with extreme values. Robust regression is an alternative method for fitting a regression line; it is not influenced as strongly by a small number of extreme values. As an example, see the following plot.
The original metric is shown as a solid blue line. The purple dashed line is an OLS regression line, and the yellow dashed line is a robust regression line. The one short-lived spike in the metric leads to the OLS regression line trending upward, but the robust regression line ignores the spike and does a better job fitting the overall trend in the metric.
Trend line
| Function | Description | Example |
|---|---|---|
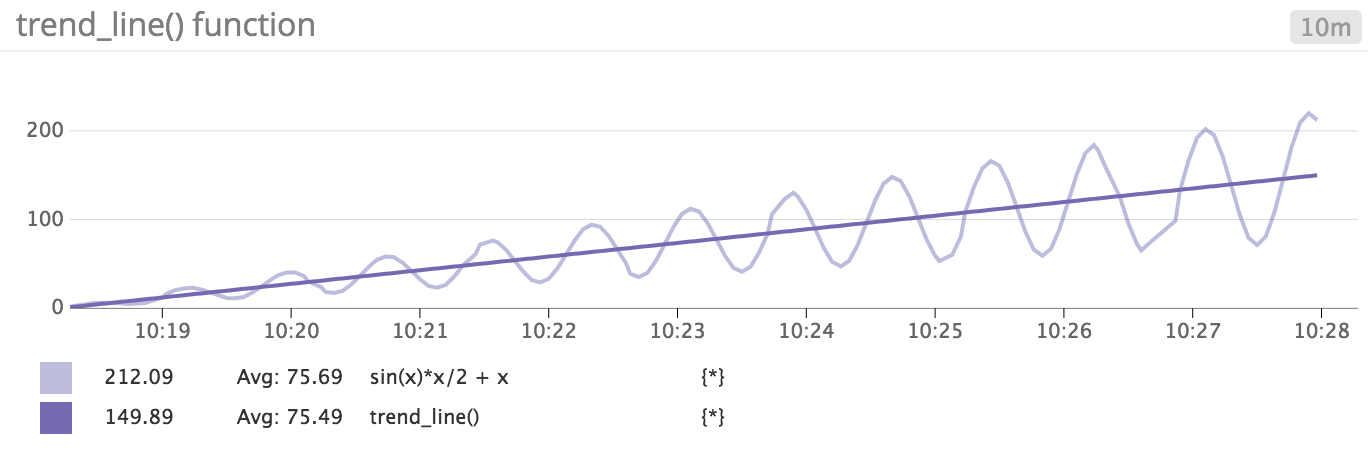
trend_line() | Fit an ordinary least squares regression line through the metric values. | trend_line(avg:<METRIC_NAME>{*}) |
Example:
The function sin(x) * x/2 + x then trend_line(sin(x) * x/2 + x) has the following shape:
Piecewise constant
| Function | Description | Example |
|---|---|---|
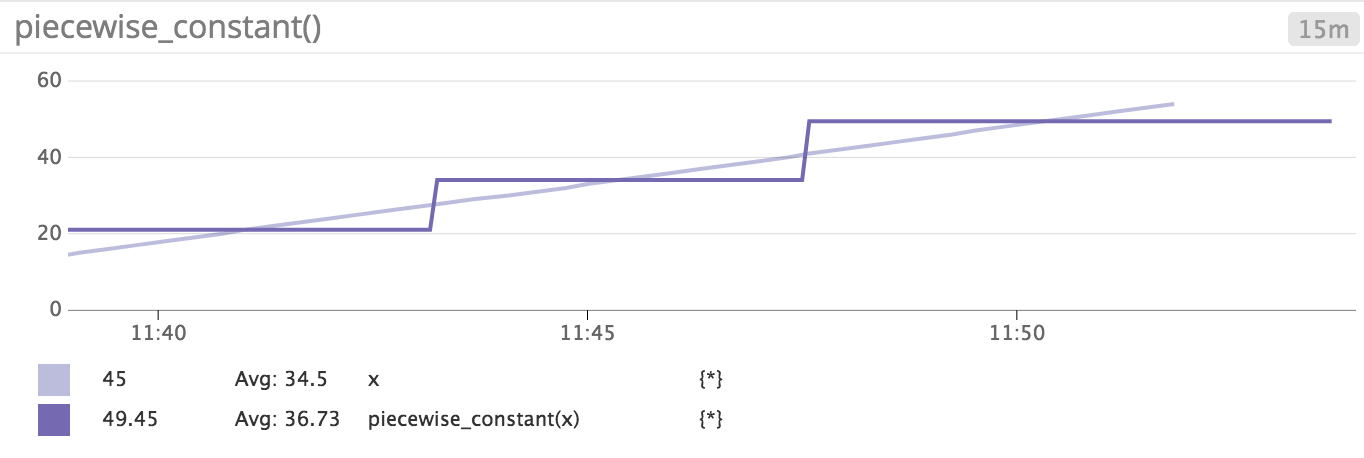
piecewise_constant() | Approximate the metric with a piecewise function composed of constant-valued segments. | piecewise_constant(avg:<METRIC_NAME>{*}) |
Example:
The function x then piecewise_constant(x) has the following shape:
Other functions
Consult the other available functions:
- Algorithmic: Implement Anomaly or Outlier detection on your metric.


