- Essentials
- Getting Started
- Datadog
- Datadog Site
- DevSecOps
- Serverless for AWS Lambda
- Agent
- Integrations
- Containers
- Dashboards
- Monitors
- Logs
- APM Tracing
- Profiler
- Tags
- API
- Service Catalog
- Session Replay
- Continuous Testing
- Synthetic Monitoring
- Incident Management
- Database Monitoring
- Cloud Security Management
- Cloud SIEM
- Application Security Management
- Workflow Automation
- CI Visibility
- Test Visibility
- Test Impact Analysis
- Code Analysis
- Learning Center
- Support
- Glossary
- Standard Attributes
- Guides
- Agent
- Integrations
- OpenTelemetry
- Developers
- Authorization
- DogStatsD
- Custom Checks
- Integrations
- Create an Agent-based Integration
- Create an API Integration
- Create a Log Pipeline
- Integration Assets Reference
- Build a Marketplace Offering
- Create a Tile
- Create an Integration Dashboard
- Create a Recommended Monitor
- Create a Cloud SIEM Detection Rule
- OAuth for Integrations
- Install Agent Integration Developer Tool
- Service Checks
- IDE Plugins
- Community
- Guides
- API
- Datadog Mobile App
- CoScreen
- Cloudcraft
- In The App
- Dashboards
- Notebooks
- DDSQL Editor
- Sheets
- Monitors and Alerting
- Infrastructure
- Metrics
- Watchdog
- Bits AI
- Service Catalog
- API Catalog
- Error Tracking
- Service Management
- Infrastructure
- Application Performance
- APM
- Continuous Profiler
- Database Monitoring
- Data Streams Monitoring
- Data Jobs Monitoring
- Digital Experience
- Real User Monitoring
- Product Analytics
- Synthetic Testing and Monitoring
- Continuous Testing
- Software Delivery
- CI Visibility
- CD Visibility
- Test Optimization
- Code Analysis
- Quality Gates
- DORA Metrics
- Security
- Security Overview
- Cloud SIEM
- Cloud Security Management
- Application Security Management
- AI Observability
- Log Management
- Observability Pipelines
- Log Management
- Administration
Scope metric-based SLO queries
This feature is only available for metric-based SLO queries.
Overview
The SLO widget supports advanced metric query filtering, including the use of template variables to dynamically scope results displayed.
Walk through of an SLO query
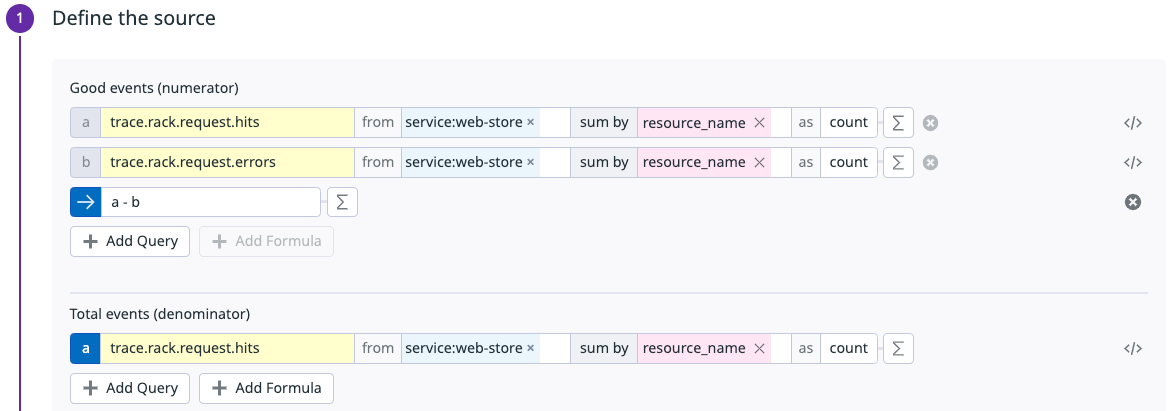
Metric-based SLO query
First, create a metric-based SLO. This example uses APM trace metrics to measure the availability of an example service called web-store.
Good events (numerator)
sum:trace.rack.request.hits{service:web-store} by {resource_name}.as_count()sum:trace.rack.request.errors{service:web-store} by {resource_name}.as_count()
Total events (denominator)
sum:trace.rack.request.hits{service:web-store} by {resource_name}.as_count()
SLO widget
Select the SLO in the SLO widget editor. You can apply additional filters in the widget configuration to further scope the results displayed. This does not modify the original definition of the SLO. In the example, we add the $env and $availability-zone tags to the filter by field of the widget.
With this configuration, what happens when the Dashboard template variable is changed to env:prod and availability-zone:northcentralus?
The SLO widget filters the SLO metric queries by those additional tags for your visualization purposes:
Good events (numerator)
sum:trace.rack.request.hits{service:web-store, env:prod, availability-zone:northcentralus} by {resource_name}.as_count()sum:trace.rack.request.errors{service:web-store, env:prod, availability-zone:northcentralus} by {resource_name}.as_count()
Total events (denominator)
sum:trace.rack.request.hits{service:web-store, env:prod, availability-zone:northcentralus} by {resource_name}.as_count()
Further reading
Additional helpful documentation, links, and articles:


