- Essentials
- Getting Started
- Datadog
- Datadog Site
- DevSecOps
- Serverless for AWS Lambda
- Agent
- Integrations
- Containers
- Dashboards
- Monitors
- Logs
- APM Tracing
- Profiler
- Tags
- API
- Service Catalog
- Session Replay
- Continuous Testing
- Synthetic Monitoring
- Incident Management
- Database Monitoring
- Cloud Security Management
- Cloud SIEM
- Application Security Management
- Workflow Automation
- CI Visibility
- Test Visibility
- Test Impact Analysis
- Code Analysis
- Learning Center
- Support
- Glossary
- Standard Attributes
- Guides
- Agent
- Integrations
- OpenTelemetry
- Developers
- Authorization
- DogStatsD
- Custom Checks
- Integrations
- Create an Agent-based Integration
- Create an API Integration
- Create a Log Pipeline
- Integration Assets Reference
- Build a Marketplace Offering
- Create a Tile
- Create an Integration Dashboard
- Create a Recommended Monitor
- Create a Cloud SIEM Detection Rule
- OAuth for Integrations
- Install Agent Integration Developer Tool
- Service Checks
- IDE Plugins
- Community
- Guides
- API
- Datadog Mobile App
- CoScreen
- Cloudcraft
- In The App
- Dashboards
- Notebooks
- DDSQL Editor
- Sheets
- Monitors and Alerting
- Infrastructure
- Metrics
- Watchdog
- Bits AI
- Service Catalog
- API Catalog
- Error Tracking
- Service Management
- Infrastructure
- Application Performance
- APM
- Continuous Profiler
- Database Monitoring
- Data Streams Monitoring
- Data Jobs Monitoring
- Digital Experience
- Real User Monitoring
- Product Analytics
- Synthetic Testing and Monitoring
- Continuous Testing
- Software Delivery
- CI Visibility
- CD Visibility
- Test Optimization
- Code Analysis
- Quality Gates
- DORA Metrics
- Security
- Security Overview
- Cloud SIEM
- Cloud Security Management
- Application Security Management
- AI Observability
- Log Management
- Observability Pipelines
- Log Management
- Administration
Check Status Widget
Service checks monitor the up or down status of a specific service. Alerts are triggered when the monitoring Agent fails to connect to the service in a specified number of consecutive checks. The Check Status widget can visually display service degradation, service failures, cluster-wide issues, drops in throughput, or increases in latency in your dashboard. For more information, see the Service check documentation.
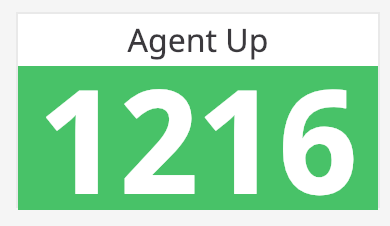
Check status shows the current status or number of results for any check performed:
Setup
Configuration
Select a previously created service check.
Choose a reporting time frame. This time frame always includes up to the present, so you can choose an option such as
The past 10 minutesorThe past 1 dayand it reports a status that includes that time frame up to the present moment. If you chooseGlobal Time, the person using the dashboard can select a range using the time frame selector in the upper right, but they must choose one that includes the present moment, that is anypast Xtime frame. Otherwise the widget is blank.Choose your scope:
- A single check: Select this option if your Check Status widget is for a specific element only, for example: one
host:<HOSTNAME>, oneservice:<SERVICE_NAME>. - A cluster of checks: Select this option if your Check Status widget is for a scope of elements as in all
hosts, or allservices.
- A single check: Select this option if your Check Status widget is for a specific element only, for example: one
After selecting your scope, define your Check Status widget context with the Reported by field.
For the scope A Cluster of checks, you have the option to select a subset with the Group by field. Note: The check status does not show you the count of checks per group, it shows the count of groups running the check. For example, if you are monitoring Agent Up, grouped by
env, the check status shows you the number ofenvthat matches your scope configurations and is running the Agent, not the count of Agents in an environment.
API
This widget can be used with the Dashboards API. See the following table for the widget JSON schema definition:
Field
Type
Description
check [required]
string
Name of the check to use in the widget.
group
string
Group reporting a single check.
group_by
[string]
List of tag prefixes to group by in the case of a cluster check.
grouping [required]
enum
The kind of grouping to use.
Allowed enum values: check,cluster
tags
[string]
List of tags used to filter the groups reporting a cluster check.
time
<oneOf>
Time setting for the widget.
Option 1
object
Wrapper for live span
live_span
enum
The available timeframes depend on the widget you are using.
Allowed enum values: 1m,5m,10m,15m,30m,1h,4h,1d,2d,1w,1mo,3mo,6mo,week_to_date,month_to_date,1y,alert
Option 2
object
Used for arbitrary live span times, such as 17 minutes or 6 hours.
type [required]
enum
Type "live" denotes a live span in the new format.
Allowed enum values: live
unit [required]
enum
Unit of the time span.
Allowed enum values: minute,hour,day,week,month,year
value [required]
int64
Value of the time span.
Option 3
object
Used for fixed span times, such as 'March 1 to March 7'.
from [required]
int64
Start time in seconds since epoch.
to [required]
int64
End time in seconds since epoch.
type [required]
enum
Type "fixed" denotes a fixed span.
Allowed enum values: fixed
title
string
Title of the widget.
title_align
enum
How to align the text on the widget.
Allowed enum values: center,left,right
title_size
string
Size of the title.
type [required]
enum
Type of the check status widget.
Allowed enum values: check_status
default: check_status
{
  "check": "",
  "group": "string",
  "group_by": [],
  "grouping": "check",
  "tags": [],
  "time": {
    "live_span": "5m"
  },
  "title": "string",
  "title_align": "string",
  "title_size": "string",
  "type": "check_status"
}
Further Reading
Additional helpful documentation, links, and articles:

