- Principales informations
- Getting Started
- Datadog
- Site Datadog
- DevSecOps
- Serverless for AWS Lambda
- Agent
- Intégrations
- Conteneurs
- Dashboards
- Monitors
- Logs
- Tracing
- Profileur
- Tags
- API
- Service Catalog
- Session Replay
- Continuous Testing
- Surveillance Synthetic
- Incident Management
- Database Monitoring
- Cloud Security Management
- Cloud SIEM
- Application Security Management
- Workflow Automation
- CI Visibility
- Test Visibility
- Intelligent Test Runner
- Code Analysis
- Learning Center
- Support
- Glossary
- Standard Attributes
- Guides
- Agent
- Intégrations
- OpenTelemetry
- Développeurs
- Authorization
- DogStatsD
- Checks custom
- Intégrations
- Create an Agent-based Integration
- Create an API Integration
- Create a Log Pipeline
- Integration Assets Reference
- Build a Marketplace Offering
- Create a Tile
- Create an Integration Dashboard
- Create a Recommended Monitor
- Create a Cloud SIEM Detection Rule
- OAuth for Integrations
- Install Agent Integration Developer Tool
- Checks de service
- IDE Plugins
- Communauté
- Guides
- API
- Application mobile
- CoScreen
- Cloudcraft
- In The App
- Dashboards
- Notebooks
- DDSQL Editor
- Alertes
- Infrastructure
- Métriques
- Watchdog
- Bits AI
- Service Catalog
- API Catalog
- Error Tracking
- Service Management
- Infrastructure
- Universal Service Monitoring
- Conteneurs
- Sans serveur
- Surveillance réseau
- Cloud Cost
- Application Performance
- APM
- Profileur en continu
- Database Monitoring
- Agent Integration Overhead
- Setup Architectures
- Configuration de Postgres
- Configuration de MySQL
- Configuration de SQL Server
- Setting Up Oracle
- Setting Up MongoDB
- Connecting DBM and Traces
- Données collectées
- Exploring Database Hosts
- Explorer les métriques de requête
- Explorer des échantillons de requêtes
- Dépannage
- Guides
- Data Streams Monitoring
- Data Jobs Monitoring
- Digital Experience
- RUM et Session Replay
- Product Analytics
- Surveillance Synthetic
- Continuous Testing
- Software Delivery
- CI Visibility
- CD Visibility
- Test Visibility
- Exécuteur de tests intelligent
- Code Analysis
- Quality Gates
- DORA Metrics
- Securité
- Security Overview
- Cloud SIEM
- Cloud Security Management
- Application Security Management
- AI Observability
- Log Management
- Pipelines d'observabilité
- Log Management
- Administration
Correlate Infrastructure Metrics with GitLab Jobs in Datadog
Cette page n'est pas encore disponible en français, sa traduction est en cours.
Si vous avez des questions ou des retours sur notre projet de traduction actuel, n'hésitez pas à nous contacter.
Si vous avez des questions ou des retours sur notre projet de traduction actuel, n'hésitez pas à nous contacter.
Note: This method only applies to runners using the "Instance" or "Docker Autoscaler" executors.
Overview
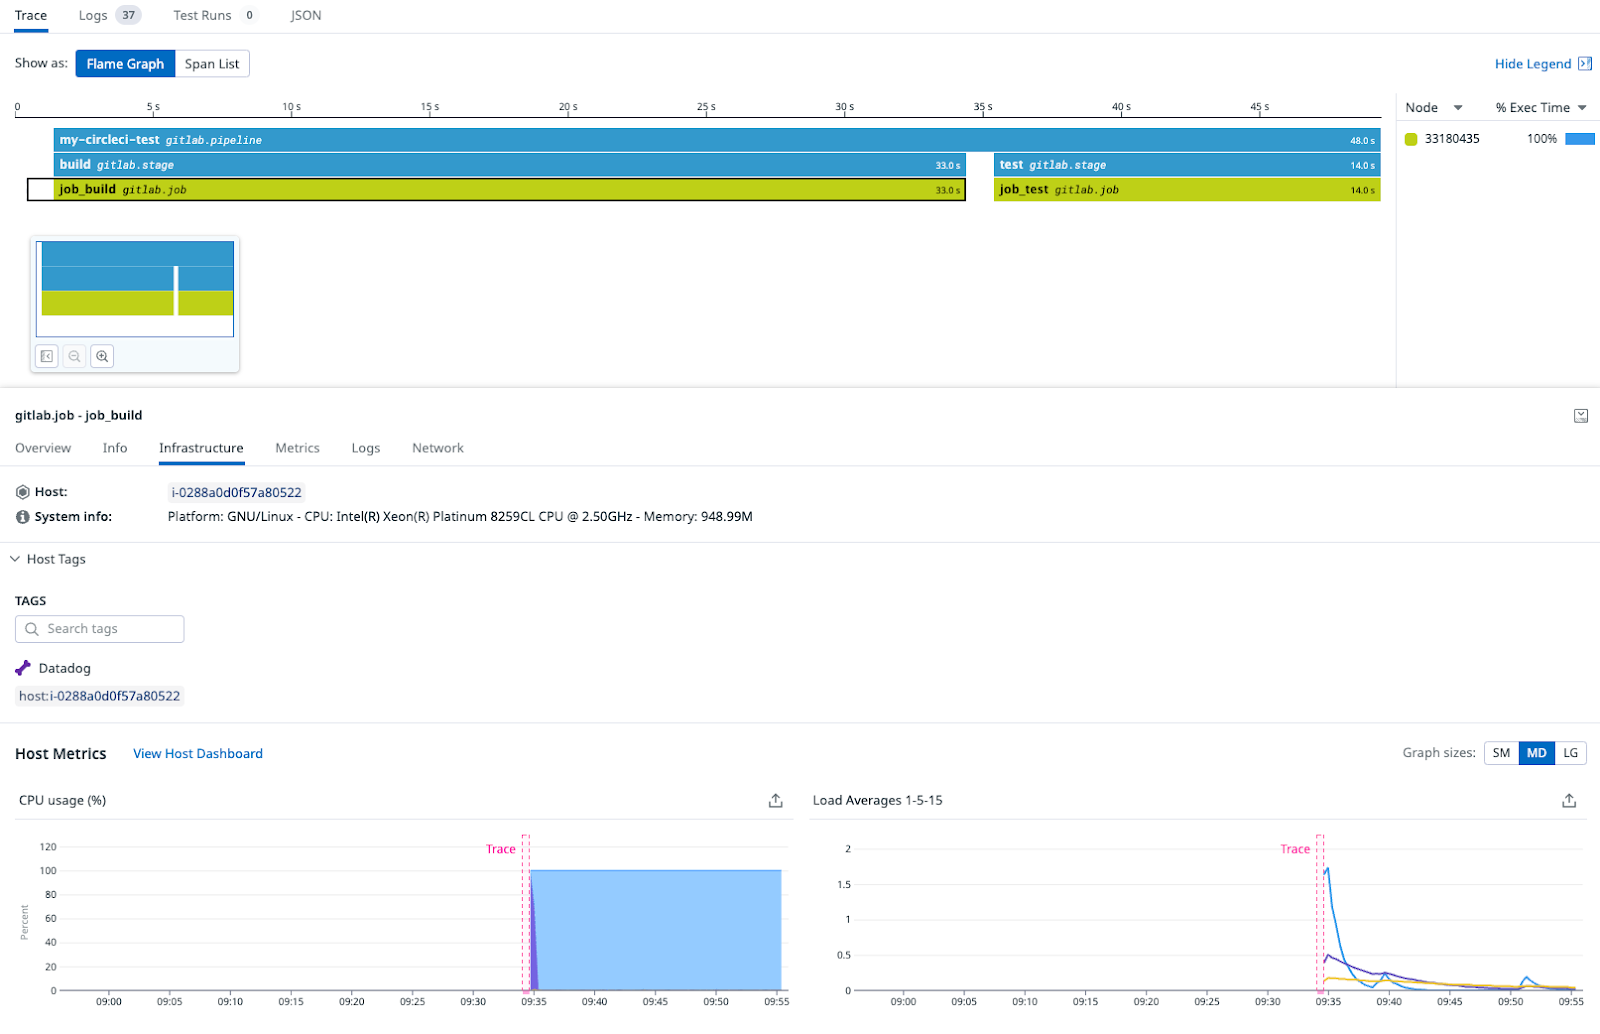
When you click on a GitLab job in the CI Visibility Explorer, you can access an Infrastructure tab with information about the host, system, host tags, host metrics, and more.
This guide explains how to correlate infrastructure metrics with your GitLab jobs if you are using GitLab “Instance” or “Docker Autoscaler” executors and CI Visibility.
Prerequisites
The Datadog Agent must be installed in the virtual machines (VM) where the GitLab jobs will be run. This is not where the GitLab instance or the Docker Autoscaler executor is running, but in the VMs that are created with the fleeting plugin.
Ensure that the Datadog Agent is installed in your instances
If you are using an AWS Autoscaling Group, you should make sure that the machine image that is configured in the template launches with the Datadog Agent.
To test that you have performed this step successfully, you can try executing a job and you should see the host appear on the Infrastructure List page.
If you are using AWS, make sure that the host name is in the format “i-xxxxx”. If this is not the case, you should check that your instance is compatible with IMDSv1. For more information, see the official AWS documentation.
You can set this up inside the template of your AWS Autoscaling Group. The Datadog Agent uses the metadata service endpoint to resolve the host name.
Set up CI Visibility and log collection for your GitLab jobs
For instructions on setting up CI Visibility for your GitLab jobs, see Set up Pipeline Visibility on a GitLab Pipeline.
To test that you have performed the setup successfully, you can try running a GitLab pipeline and checking if it appears on the Executions page.
You are required to enable the collection of job logs. You can check if Datadog is receiving the logs correctly by clicking on the Logs tab of your pipeline execution.
After you have completed these steps, your GitLab jobs should be correlated with infrastructure metrics. The correlation is per job and not pipeline, as different jobs may run on different hosts. The Infrastructure tab appears after the job is finished and Datadog receives the logs for that job.
Further reading
Documentation, liens et articles supplémentaires utiles:

