- Principales informations
- Getting Started
- Datadog
- Site Datadog
- DevSecOps
- Serverless for AWS Lambda
- Agent
- Intégrations
- Conteneurs
- Dashboards
- Monitors
- Logs
- Tracing
- Profileur
- Tags
- API
- Service Catalog
- Session Replay
- Continuous Testing
- Surveillance Synthetic
- Incident Management
- Database Monitoring
- Cloud Security Management
- Cloud SIEM
- Application Security Management
- Workflow Automation
- CI Visibility
- Test Visibility
- Intelligent Test Runner
- Code Analysis
- Learning Center
- Support
- Glossary
- Standard Attributes
- Guides
- Agent
- Intégrations
- OpenTelemetry
- Développeurs
- Authorization
- DogStatsD
- Checks custom
- Intégrations
- Create an Agent-based Integration
- Create an API Integration
- Create a Log Pipeline
- Integration Assets Reference
- Build a Marketplace Offering
- Create a Tile
- Create an Integration Dashboard
- Create a Recommended Monitor
- Create a Cloud SIEM Detection Rule
- OAuth for Integrations
- Install Agent Integration Developer Tool
- Checks de service
- IDE Plugins
- Communauté
- Guides
- API
- Application mobile
- CoScreen
- Cloudcraft
- In The App
- Dashboards
- Notebooks
- DDSQL Editor
- Alertes
- Infrastructure
- Métriques
- Watchdog
- Bits AI
- Service Catalog
- API Catalog
- Error Tracking
- Service Management
- Infrastructure
- Universal Service Monitoring
- Conteneurs
- Sans serveur
- Surveillance réseau
- Cloud Cost
- Application Performance
- APM
- Profileur en continu
- Database Monitoring
- Agent Integration Overhead
- Setup Architectures
- Configuration de Postgres
- Configuration de MySQL
- Configuration de SQL Server
- Setting Up Oracle
- Setting Up MongoDB
- Connecting DBM and Traces
- Données collectées
- Exploring Database Hosts
- Explorer les métriques de requête
- Explorer des échantillons de requêtes
- Dépannage
- Guides
- Data Streams Monitoring
- Data Jobs Monitoring
- Digital Experience
- RUM et Session Replay
- Product Analytics
- Surveillance Synthetic
- Continuous Testing
- Software Delivery
- CI Visibility
- CD Visibility
- Test Visibility
- Exécuteur de tests intelligent
- Code Analysis
- Quality Gates
- DORA Metrics
- Securité
- Security Overview
- Cloud SIEM
- Cloud Security Management
- Application Security Management
- AI Observability
- Log Management
- Pipelines d'observabilité
- Log Management
- Administration
Metric Correlations
Cette page n'est pas encore disponible en français, sa traduction est en cours.
Si vous avez des questions ou des retours sur notre projet de traduction actuel, n'hésitez pas à nous contacter.
Si vous avez des questions ou des retours sur notre projet de traduction actuel, n'hésitez pas à nous contacter.
Overview
Metric Correlations is available for Timeseries widgets with the Metric data source.
Metric Correlations can help you find potential root causes for an observed issue by searching for other metrics that exhibited irregular behavior around the same time. Correlations scans your metrics from different sources such as dashboards, integrations, APM, and custom metrics.
Find correlated metrics
You can start your metric correlations exploration from any of your dashboards, notebooks, APM, Watchdog alerts, or monitor status pages.
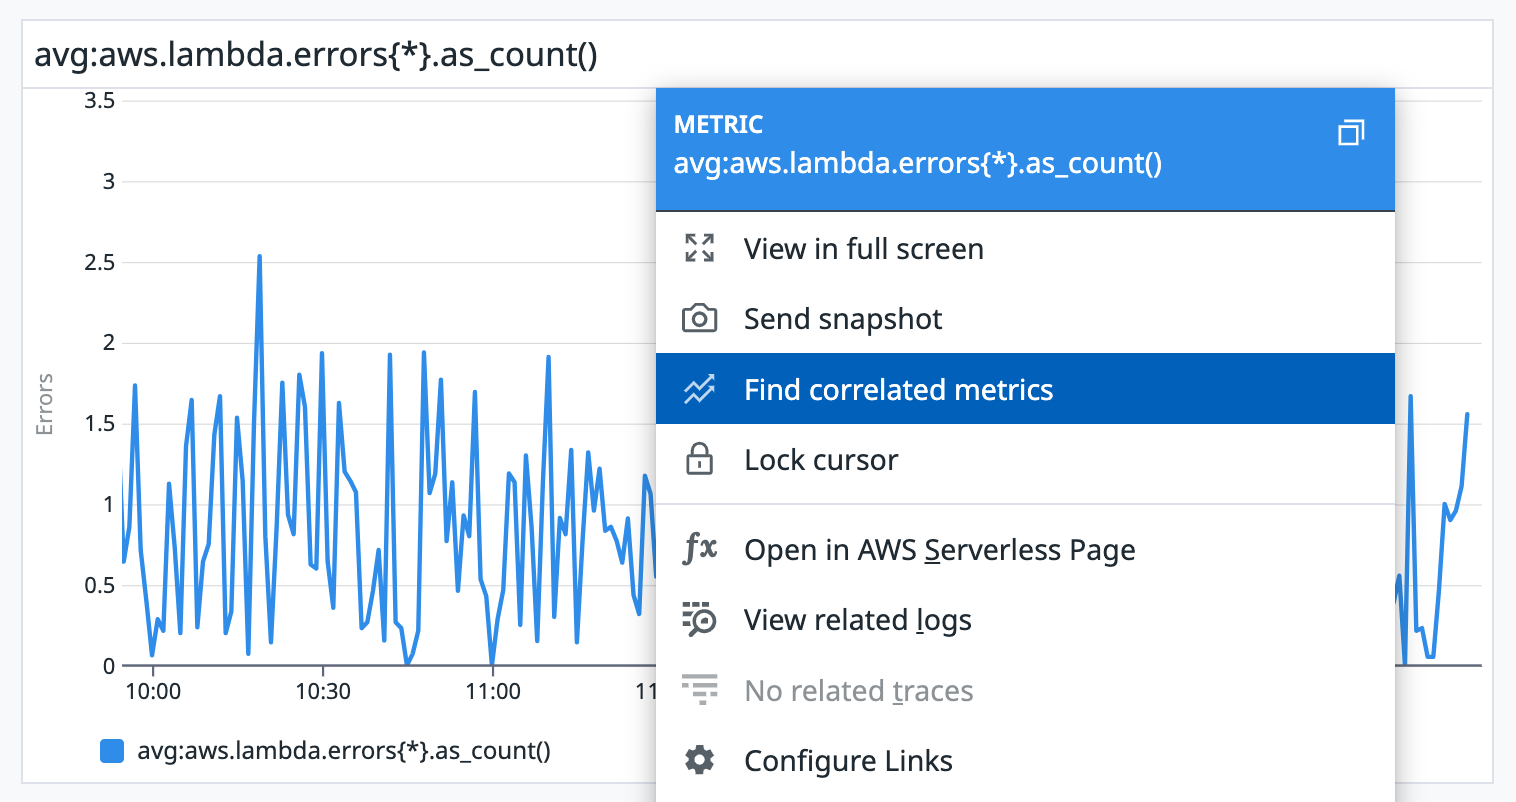
- Left click on any graph and select Find correlated metrics.
- From a full-screen graph, click the Correlations tab.
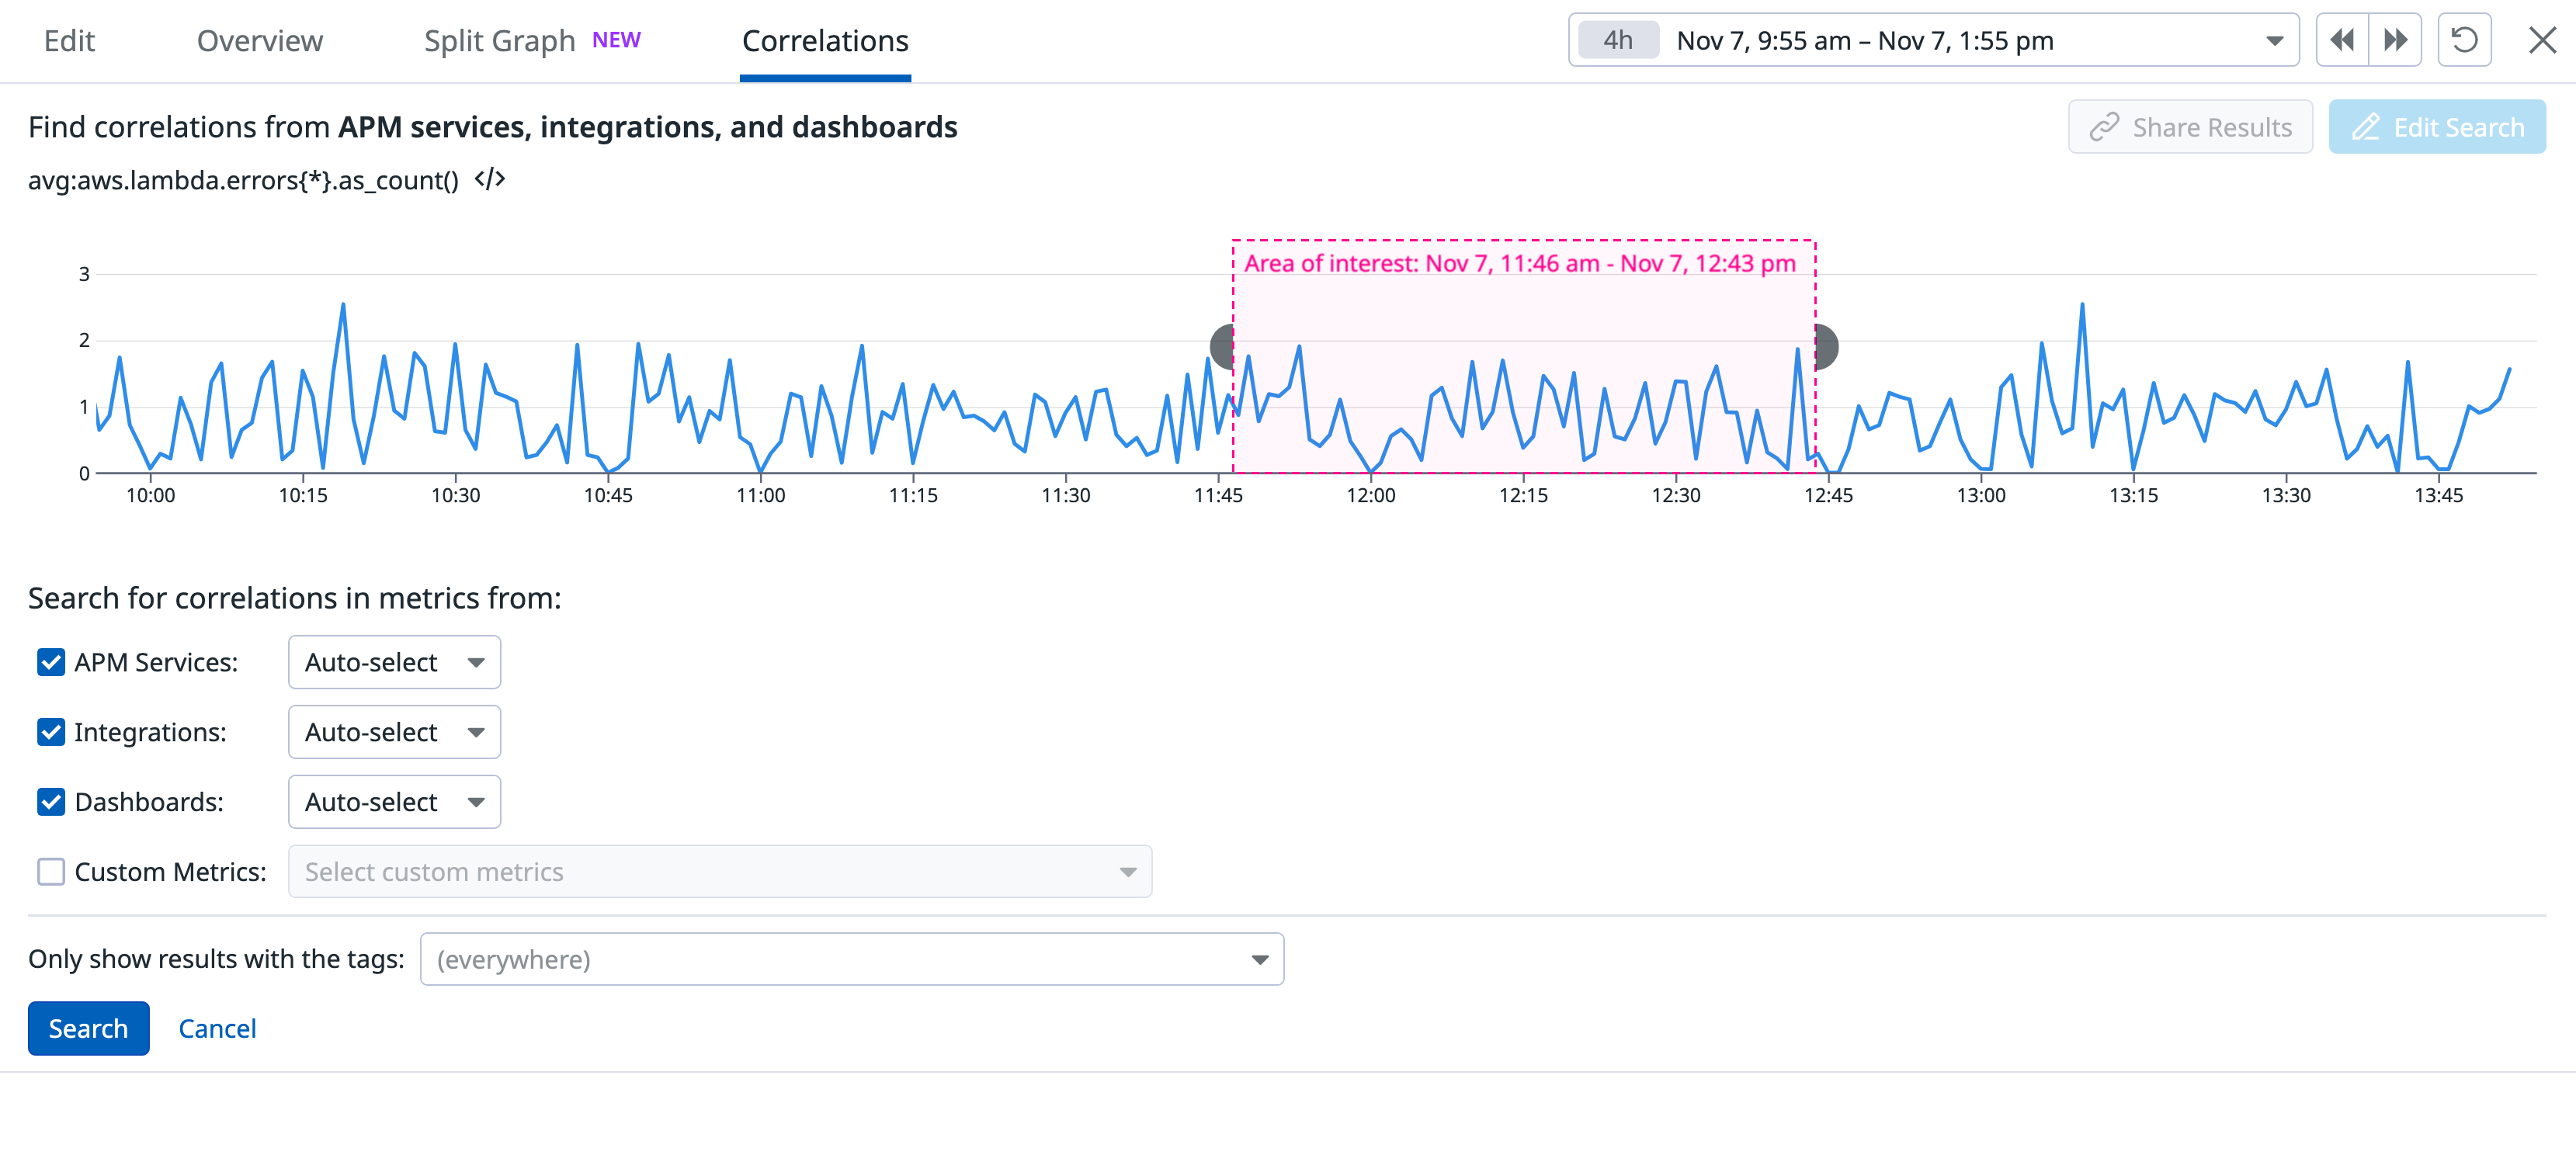
Correlations tries to automatically detect the area of interest (anomalous behavior) for your metric. If the area of interest is not selected automatically or needs adjustment, you can manually draw the area of interest from the edit search option. Datadog searches for other metrics that exhibit anomalous behavior at times matching the area of interest.
Note: Correlation searches are available for a single metric. For graphs with multiple metrics, select the series of interest. From a full-screen graph, select one series on the graph legend, then click the Correlations tab.
Customize your search
You can customize the default search parameters of correlations. From a full-screen graph, on the Correlations tab, click the Edit Search button, or click directly on the graph.
- Click and drag on the graph to set the time frame for your correlations search.
- Define the sources you want correlations to search from (APM services, integrations, dashboards, or custom metrics).
- Select Auto-select or Custom select from specific categories. For custom metrics, at least one selection is required.
- Custom metrics is the only category not selected by default. Choose metric namespaces or single metrics to search correlations upon.
- Use the tag filter box to scope the search by a tag.
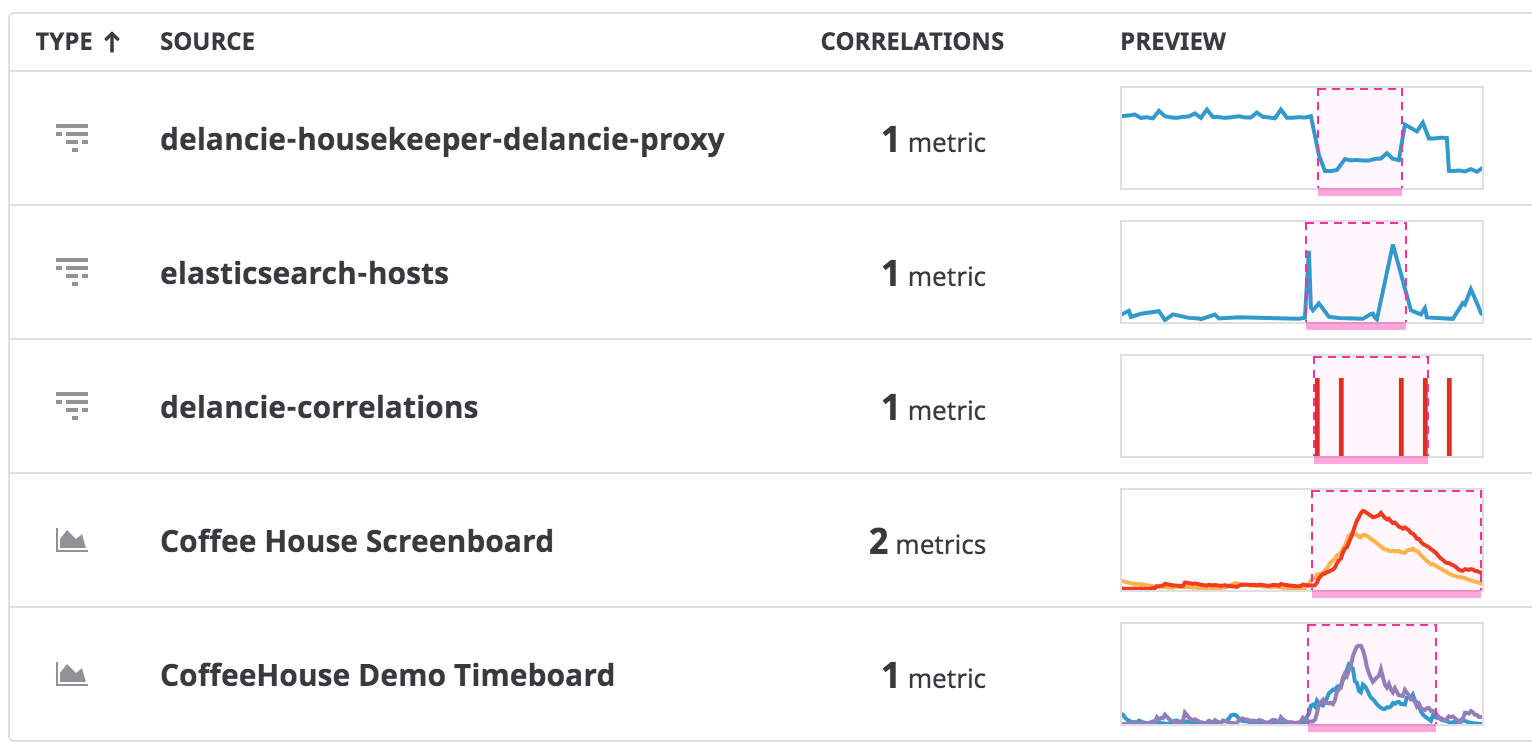
A list of search results is displayed below the search graph with the following:
- Type: A graphic representing the source type (APM service, integration, dashboard, or custom metric).
- Source: The name of the source for the correlated metrics.
- Correlations: The number of correlated metrics found.
- Preview: A preview graph of the correlated metrics.
As results load, you can explore the details without waiting for all results.
Investigate
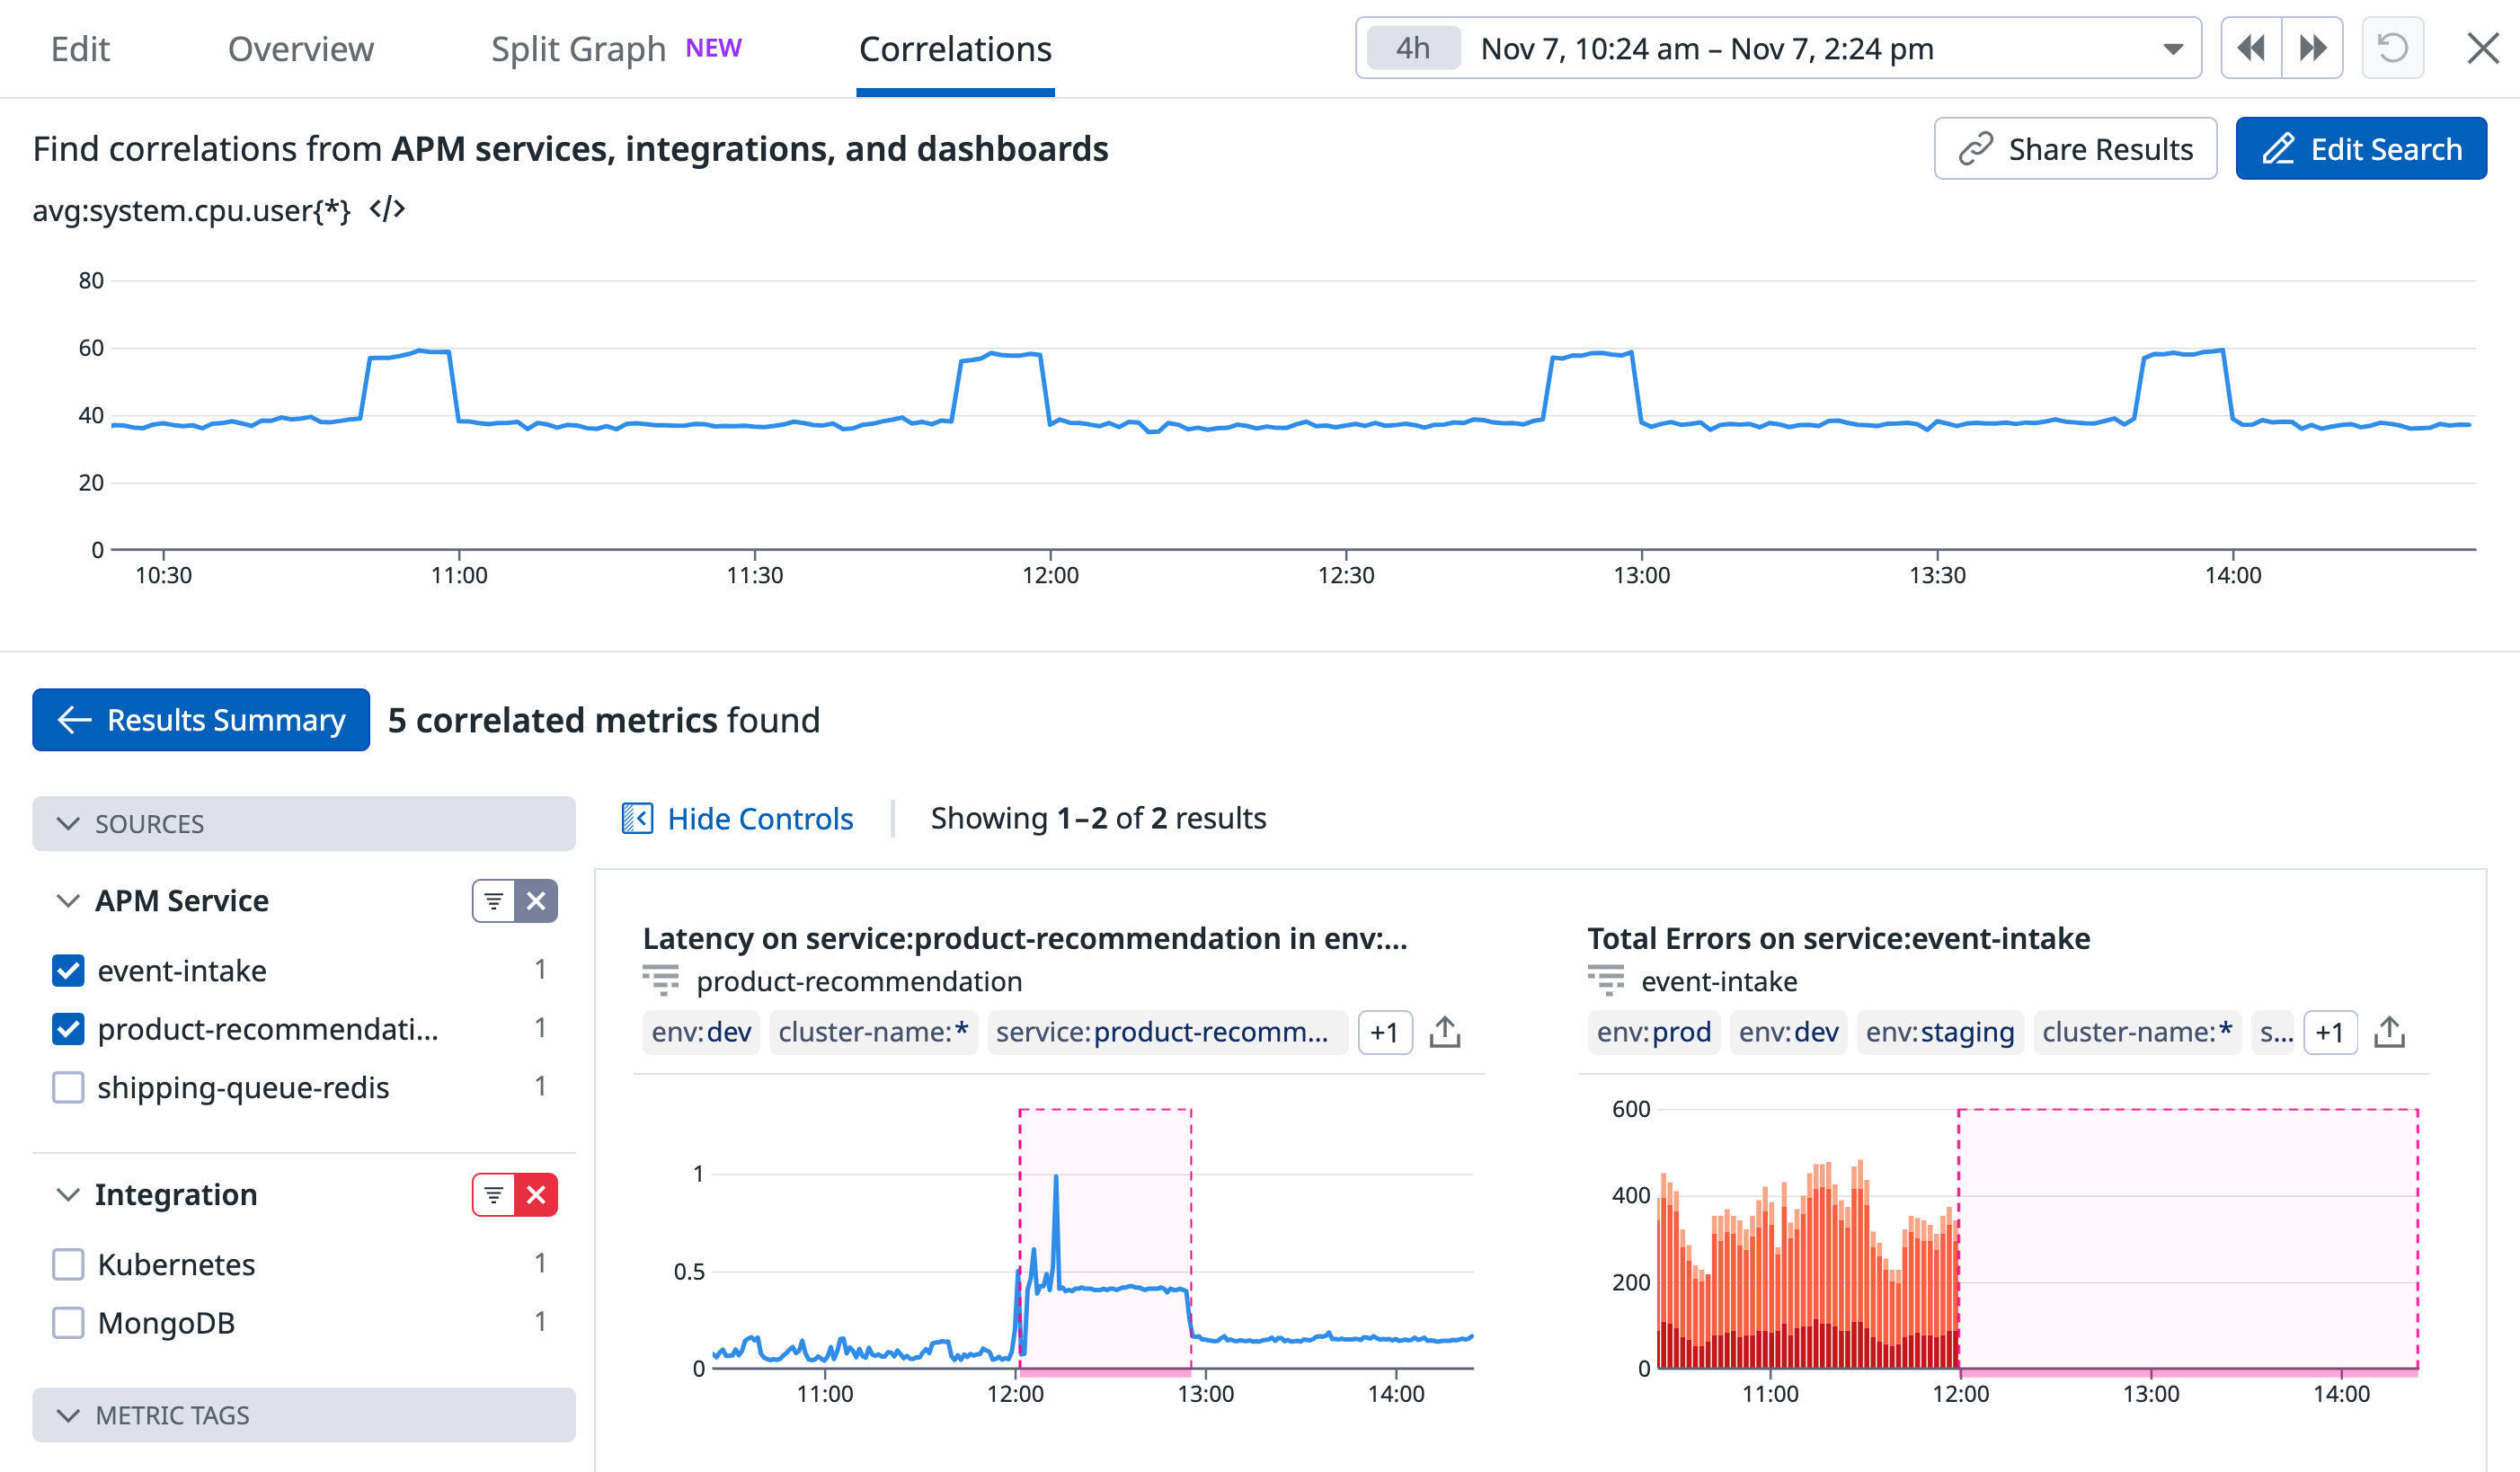
From the results list, select a row to investigate the details of that correlation.
- Similar to dashboards, hovering over a graph creates a time-synced line on all other graphs.
- To view all sources, remove the filter in the menu.
- Sources for each metric are linked by name. For example, dashboard names link to the dashboard.
- Use the export icon to export the graph to a dashboard, notebook, or copy the query.
Further Reading
Documentation, liens et articles supplémentaires utiles:


