- Principales informations
- Getting Started
- Datadog
- Site Datadog
- DevSecOps
- Serverless for AWS Lambda
- Agent
- Intégrations
- Conteneurs
- Dashboards
- Monitors
- Logs
- Tracing
- Profileur
- Tags
- API
- Service Catalog
- Session Replay
- Continuous Testing
- Surveillance Synthetic
- Incident Management
- Database Monitoring
- Cloud Security Management
- Cloud SIEM
- Application Security Management
- Workflow Automation
- CI Visibility
- Test Visibility
- Intelligent Test Runner
- Code Analysis
- Learning Center
- Support
- Glossary
- Standard Attributes
- Guides
- Agent
- Intégrations
- OpenTelemetry
- Développeurs
- Authorization
- DogStatsD
- Checks custom
- Intégrations
- Create an Agent-based Integration
- Create an API Integration
- Create a Log Pipeline
- Integration Assets Reference
- Build a Marketplace Offering
- Create a Tile
- Create an Integration Dashboard
- Create a Recommended Monitor
- Create a Cloud SIEM Detection Rule
- OAuth for Integrations
- Install Agent Integration Developer Tool
- Checks de service
- IDE Plugins
- Communauté
- Guides
- API
- Application mobile
- CoScreen
- Cloudcraft
- In The App
- Dashboards
- Notebooks
- DDSQL Editor
- Alertes
- Infrastructure
- Métriques
- Watchdog
- Bits AI
- Service Catalog
- API Catalog
- Error Tracking
- Service Management
- Infrastructure
- Universal Service Monitoring
- Conteneurs
- Sans serveur
- Surveillance réseau
- Cloud Cost
- Application Performance
- APM
- Profileur en continu
- Database Monitoring
- Agent Integration Overhead
- Setup Architectures
- Configuration de Postgres
- Configuration de MySQL
- Configuration de SQL Server
- Setting Up Oracle
- Setting Up MongoDB
- Connecting DBM and Traces
- Données collectées
- Exploring Database Hosts
- Explorer les métriques de requête
- Explorer des échantillons de requêtes
- Dépannage
- Guides
- Data Streams Monitoring
- Data Jobs Monitoring
- Digital Experience
- RUM et Session Replay
- Product Analytics
- Surveillance Synthetic
- Continuous Testing
- Software Delivery
- CI Visibility
- CD Visibility
- Test Visibility
- Exécuteur de tests intelligent
- Code Analysis
- Quality Gates
- DORA Metrics
- Securité
- Security Overview
- Cloud SIEM
- Cloud Security Management
- Application Security Management
- AI Observability
- Log Management
- Pipelines d'observabilité
- Log Management
- Administration
Using LLM Observability and APM
Cette page n'est pas encore disponible en français, sa traduction est en cours.
Si vous avez des questions ou des retours sur notre projet de traduction actuel, n'hésitez pas à nous contacter.
Si vous avez des questions ou des retours sur notre projet de traduction actuel, n'hésitez pas à nous contacter.
Overview
This guide explains how you can use both LLM Observability and APM to link LLM Observability and APM spans in Datadog.
By instrumenting your LLM-specific operations with LLM Observability and your broader application with APM, you can accomplish the following:
- Understand end-to-end visibility: Explore upstream and downstream requests of your LLM applications within the context of your entire application.
- From APM, dive deeper into LLM Observability: Investigate whether or not an issue with your application is specific to LLM-specific applications, such as a call to OpenAI.
Setup
The LLM Observability SDK is built on APM’s dd-tracer. This allows you to use LLM Observability with Application Performance Monitoring (APM)
If you are using the LLM Observability SDK for Python along with APM’s dd-tracer, you can navigate between spans in Datadog APM and LLM Observability without additional setup.
If you are using the LLM Observability API with dd-tracer for APM:
- Use the appropriate method to obtain the span ID from the tracer (for example, using
span.Context().SpanID()for the Go tracer). - Include the captured span IDs in all of the LLM Observability API requests. This links APM and LLM Observability spans in Datadog.
Navigate between spans
By using this integration, you can correlate data across your application stack and understand how your LLM applications interact with other components. You can also resolve issues more quickly and optimize your application’s performance.
From LLM Observability to APM
To understand the broader context of your LLM operations within your application ecosystem, select an LLM Observability span in the LLM Observability Explorer and click APM span to navigate to the relevant APM span.
From APM to LLM Observability
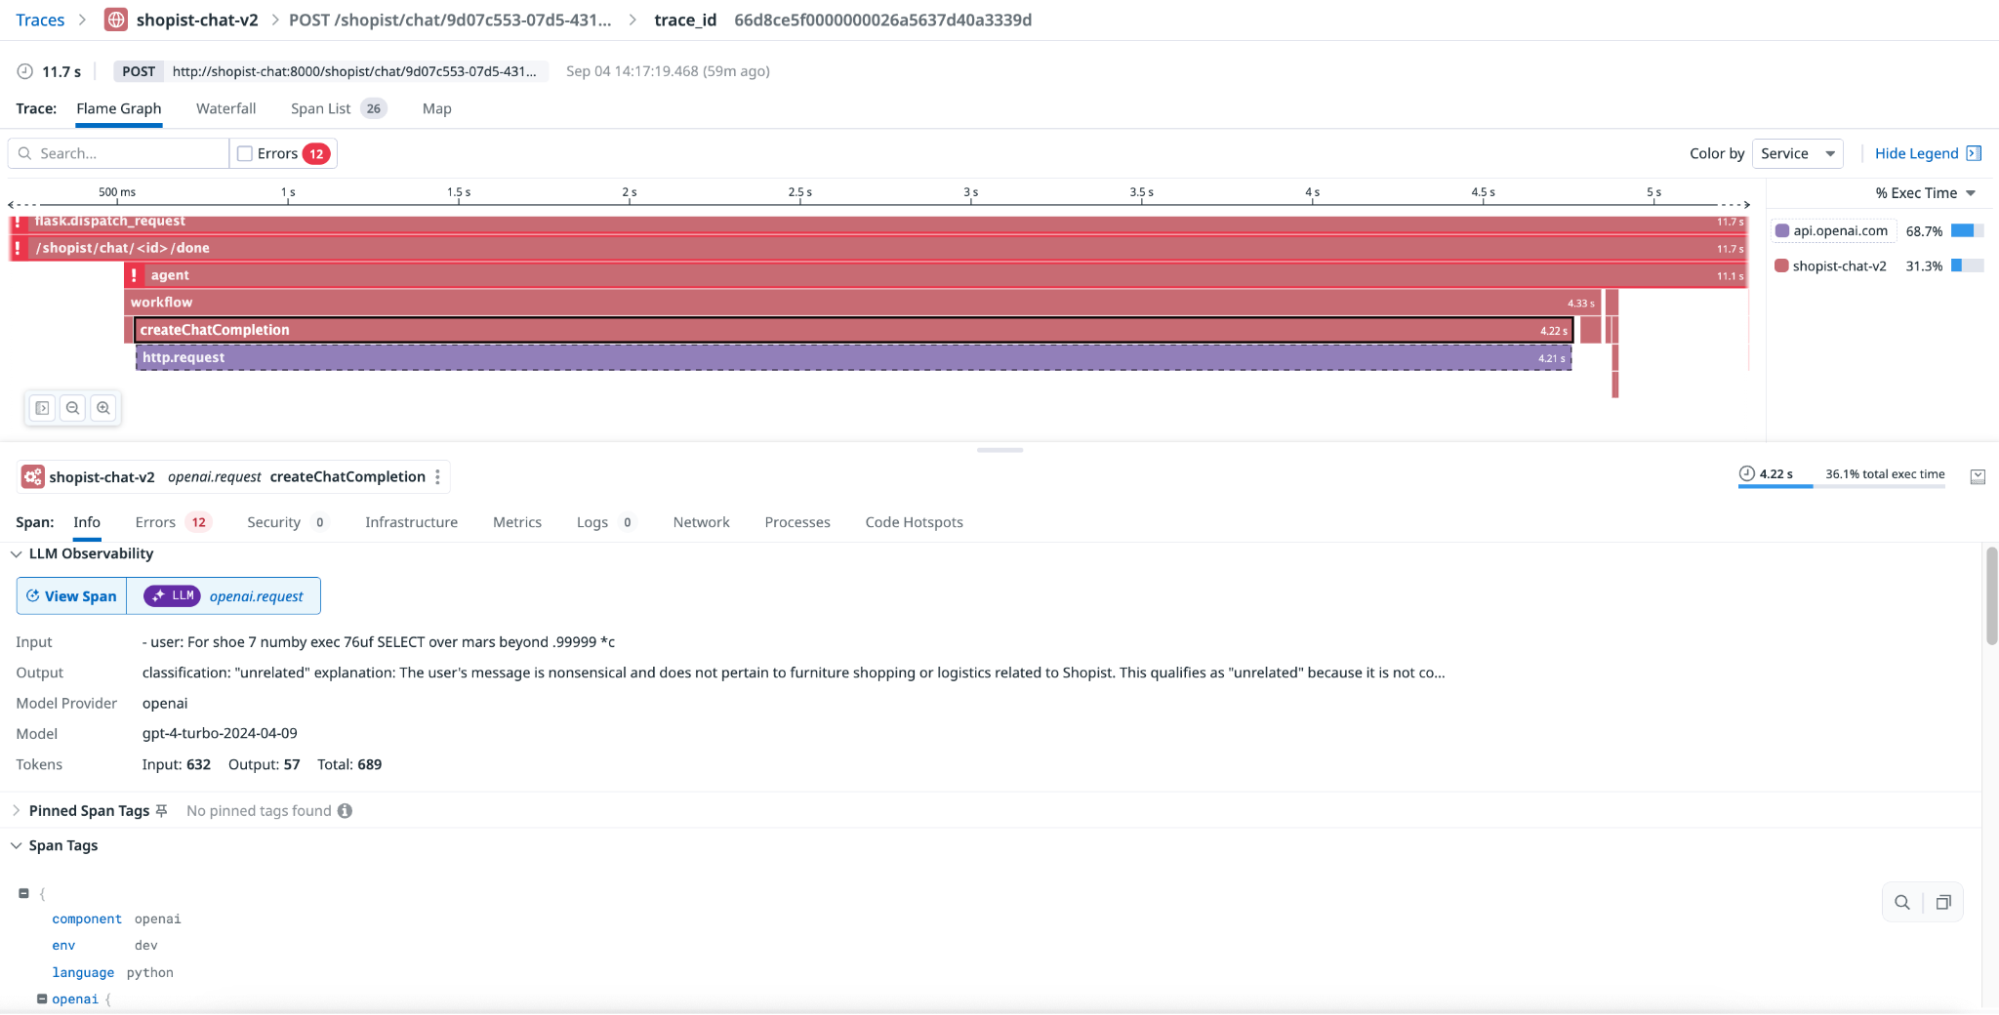
To access LLM-specific insights, select an APM span in the Trace Explorer and click View Span in the LLM Observability section on the Info tab to navigate to the corresponding LLM Observability span.
Further Reading
Documentation, liens et articles supplémentaires utiles:


