- Principales informations
- Getting Started
- Datadog
- Site Datadog
- DevSecOps
- Serverless for AWS Lambda
- Agent
- Intégrations
- Conteneurs
- Dashboards
- Monitors
- Logs
- Tracing
- Profileur
- Tags
- API
- Service Catalog
- Session Replay
- Continuous Testing
- Surveillance Synthetic
- Incident Management
- Database Monitoring
- Cloud Security Management
- Cloud SIEM
- Application Security Management
- Workflow Automation
- CI Visibility
- Test Visibility
- Intelligent Test Runner
- Code Analysis
- Learning Center
- Support
- Glossary
- Standard Attributes
- Guides
- Agent
- Intégrations
- OpenTelemetry
- Développeurs
- Authorization
- DogStatsD
- Checks custom
- Intégrations
- Create an Agent-based Integration
- Create an API Integration
- Create a Log Pipeline
- Integration Assets Reference
- Build a Marketplace Offering
- Create a Tile
- Create an Integration Dashboard
- Create a Recommended Monitor
- Create a Cloud SIEM Detection Rule
- OAuth for Integrations
- Install Agent Integration Developer Tool
- Checks de service
- IDE Plugins
- Communauté
- Guides
- API
- Application mobile
- CoScreen
- Cloudcraft
- In The App
- Dashboards
- Notebooks
- DDSQL Editor
- Alertes
- Infrastructure
- Métriques
- Watchdog
- Bits AI
- Service Catalog
- API Catalog
- Error Tracking
- Service Management
- Infrastructure
- Universal Service Monitoring
- Conteneurs
- Sans serveur
- Surveillance réseau
- Cloud Cost
- Application Performance
- APM
- Profileur en continu
- Database Monitoring
- Agent Integration Overhead
- Setup Architectures
- Configuration de Postgres
- Configuration de MySQL
- Configuration de SQL Server
- Setting Up Oracle
- Setting Up MongoDB
- Connecting DBM and Traces
- Données collectées
- Exploring Database Hosts
- Explorer les métriques de requête
- Explorer des échantillons de requêtes
- Dépannage
- Guides
- Data Streams Monitoring
- Data Jobs Monitoring
- Digital Experience
- RUM et Session Replay
- Product Analytics
- Surveillance Synthetic
- Continuous Testing
- Software Delivery
- CI Visibility
- CD Visibility
- Test Visibility
- Exécuteur de tests intelligent
- Code Analysis
- Quality Gates
- DORA Metrics
- Securité
- Security Overview
- Cloud SIEM
- Cloud Security Management
- Application Security Management
- AI Observability
- Log Management
- Pipelines d'observabilité
- Log Management
- Administration
Sending Data from the OpenTelemetry Demo to Datadog
Cette page n'est pas encore disponible en français, sa traduction est en cours.
Si vous avez des questions ou des retours sur notre projet de traduction actuel, n'hésitez pas à nous contacter.
Si vous avez des questions ou des retours sur notre projet de traduction actuel, n'hésitez pas à nous contacter.
Overview
The OpenTelemetry Demo is a microservices demo application developed by the community to demonstrate OpenTelemetry (OTel) instrumentation and its observability capabilities. It is an e-commerce web page composed of multiple microservices communicating with each other through HTTP and gRPC. All services are instrumented with OpenTelemetry and produce traces, metrics, and logs.
This page guides you through the steps required to deploy the OpenTelemetry Demo and send its data to Datadog.
Prerequisites
To complete this guide, ensure you have the following:
- Create a Datadog account if you haven’t yet.
- Find or create your Datadog API key.
- 6 GB of free RAM for the application.
You can deploy the demo using Docker or Kubernetes (with Helm). Choose your preferred deployment method and make sure you have the necessary tools installed:
- Docker
- Docker Compose v2.0.0+
- Make (optional)
- Kubernetes 1.24+
- Helm 3.9+
- An active Kubernetes cluster with kubectl configured to connect to it
Configuring and deploying the demo
Cloning the repository
Clone the opentelemetry-demo repository to your device:
git clone https://github.com/open-telemetry/opentelemetry-demo.git
Configuring the OpenTelemetry Collector
To send the demo’s telemetry data to Datadog you need to add three components to the the OpenTelemetry Collector configuration:
Resource Processoris anoptionalcomponent which is recommended, used to set theenvtag for Datadog.Datadog Connectoris responsible for computing Datadog APM Trace Metrics.Datadog Exporteris responsible for exporting Traces, Metrics and Logs to Datadog.
Complete the following steps to configure these three components.
Open the demo repository. Create a file called
docker-compose.override.ymlin the root folder.Open the created file. Paste the following content and set the Datadog site and Datadog API key environment variables:
services:
  otelcol:
    command:
      - "--config=/etc/otelcol-config.yml"
      - "--config=/etc/otelcol-config-extras.yml"
      - "--feature-gates=exporter.datadogexporter.UseLogsAgentExporter"
    environment:
      - DD_SITE_PARAMETER=<Your API Site>
      - DD_API_KEY=<Your API Key>
To configure the OpenTelemetry Collector, open
src/otelcollector/otelcol-config-extras.ymland add the following to the file:exporters: datadog: traces: span_name_as_resource_name: true trace_buffer: 500 hostname: "otelcol-docker" api: site: ${env:DD_SITE_PARAMETER} key: ${env:DD_API_KEY} processors: resource: attributes: - key: deployment.environment value: "otel" action: upsert connectors: datadog/connector: traces: span_name_as_resource_name: true service: pipelines: traces: processors: [resource, batch] exporters: [otlp, debug, spanmetrics, datadog, datadog/connector] metrics: receivers: [docker_stats, httpcheck/frontendproxy, otlp, prometheus, redis, spanmetrics, datadog/connector] processors: [resource, batch] exporters: [otlphttp/prometheus, debug, datadog] logs: processors: [resource, batch] exporters: [opensearch, debug, datadog]By default, the collector in the demo application merges the configuration from two files:
src/otelcollector/otelcol-config.yml: contains the default configuration for the collector.src/otelcollector/otelcol-config-extras.yml: used to add extra configuration to the collector.
When merging YAML values, objects are merged and arrays are replaced. That's why there are more components specified in the pipelines than actually configured. The previous configuration does not replace the values configured in the mainotelcol-configfile.
Create a secret named
dd-secretsto store Datadog Site and API Key secrets:kubectl create secret generic dd-secrets --from-literal="DD_SITE_PARAMETER=<Your API Site>" --from-literal="DD_API_KEY=<Your API Key>"Add the OpenTelemetry Helm chart to your repo to manage and deploy the OpenTelemetry Demo:
helm repo add open-telemetry https://open-telemetry.github.io/opentelemetry-helm-chartsCreate a file named
my-values-file.ymlwith the following content:opentelemetry-collector: extraEnvsFrom: - secretRef: name: dd-secrets config: exporters: datadog: traces: span_name_as_resource_name: true trace_buffer: 500 hostname: "otelcol-helm" api: site: ${DD_SITE_PARAMETER} key: ${DD_API_KEY} processors: resource: attributes: - key: deployment.environment value: "otel" action: upsert connectors: datadog/connector: traces: span_name_as_resource_name: true service: pipelines: traces: processors: [resource, batch] exporters: [otlp, debug, spanmetrics, datadog, datadog/connector] metrics: receivers: [httpcheck/frontendproxy, otlp, redis, spanmetrics, datadog/connector] processors: [resource, batch] exporters: [otlphttp/prometheus, debug, datadog] logs: processors: [resource, batch] exporters: [opensearch, debug, datadog]When merging YAML values, objects are merged and arrays are replaced. That's why there are more components specified in the pipelines than actually configured. The previous configuration does not replace the values configured in the mainotelcol-configfile.
Running the demo
If you have make installed, you can use the following command to start the demo:
make start
If you don’t have make installed, you can use the the docker compose command directly:
docker compose up --force-recreate --remove-orphans --detach
To deploy the demo application on Kubernetes using Helm, run the following command:
helm install my-otel-demo open-telemetry/opentelemetry-demo --values my-values-file.yml
Navigating the application
You can access the Astronomy Shop web UI to explore the application and observe how the telemetry data is generated.
Go to http://localhost:8080.
If you are running a local cluster, you need to port forward the frontend proxy:
kubectl port-forward svc/my-otel-demo-frontendproxy 8080:8080Go to http://localhost:8080.
Telemetry data correlation
The instrumentation steps used in all services from the Demo can be found on the main OpenTelemetry documentation.
You can find the language in which each service was implemented as well as its documentation in the language feature reference table.
Exploring OpenTelemetry data in Datadog
When the OTel Demo is running, the built-in load generator simulates traffic in the application. After a couple of seconds you can see data arriving in Datadog.
Service Catalog
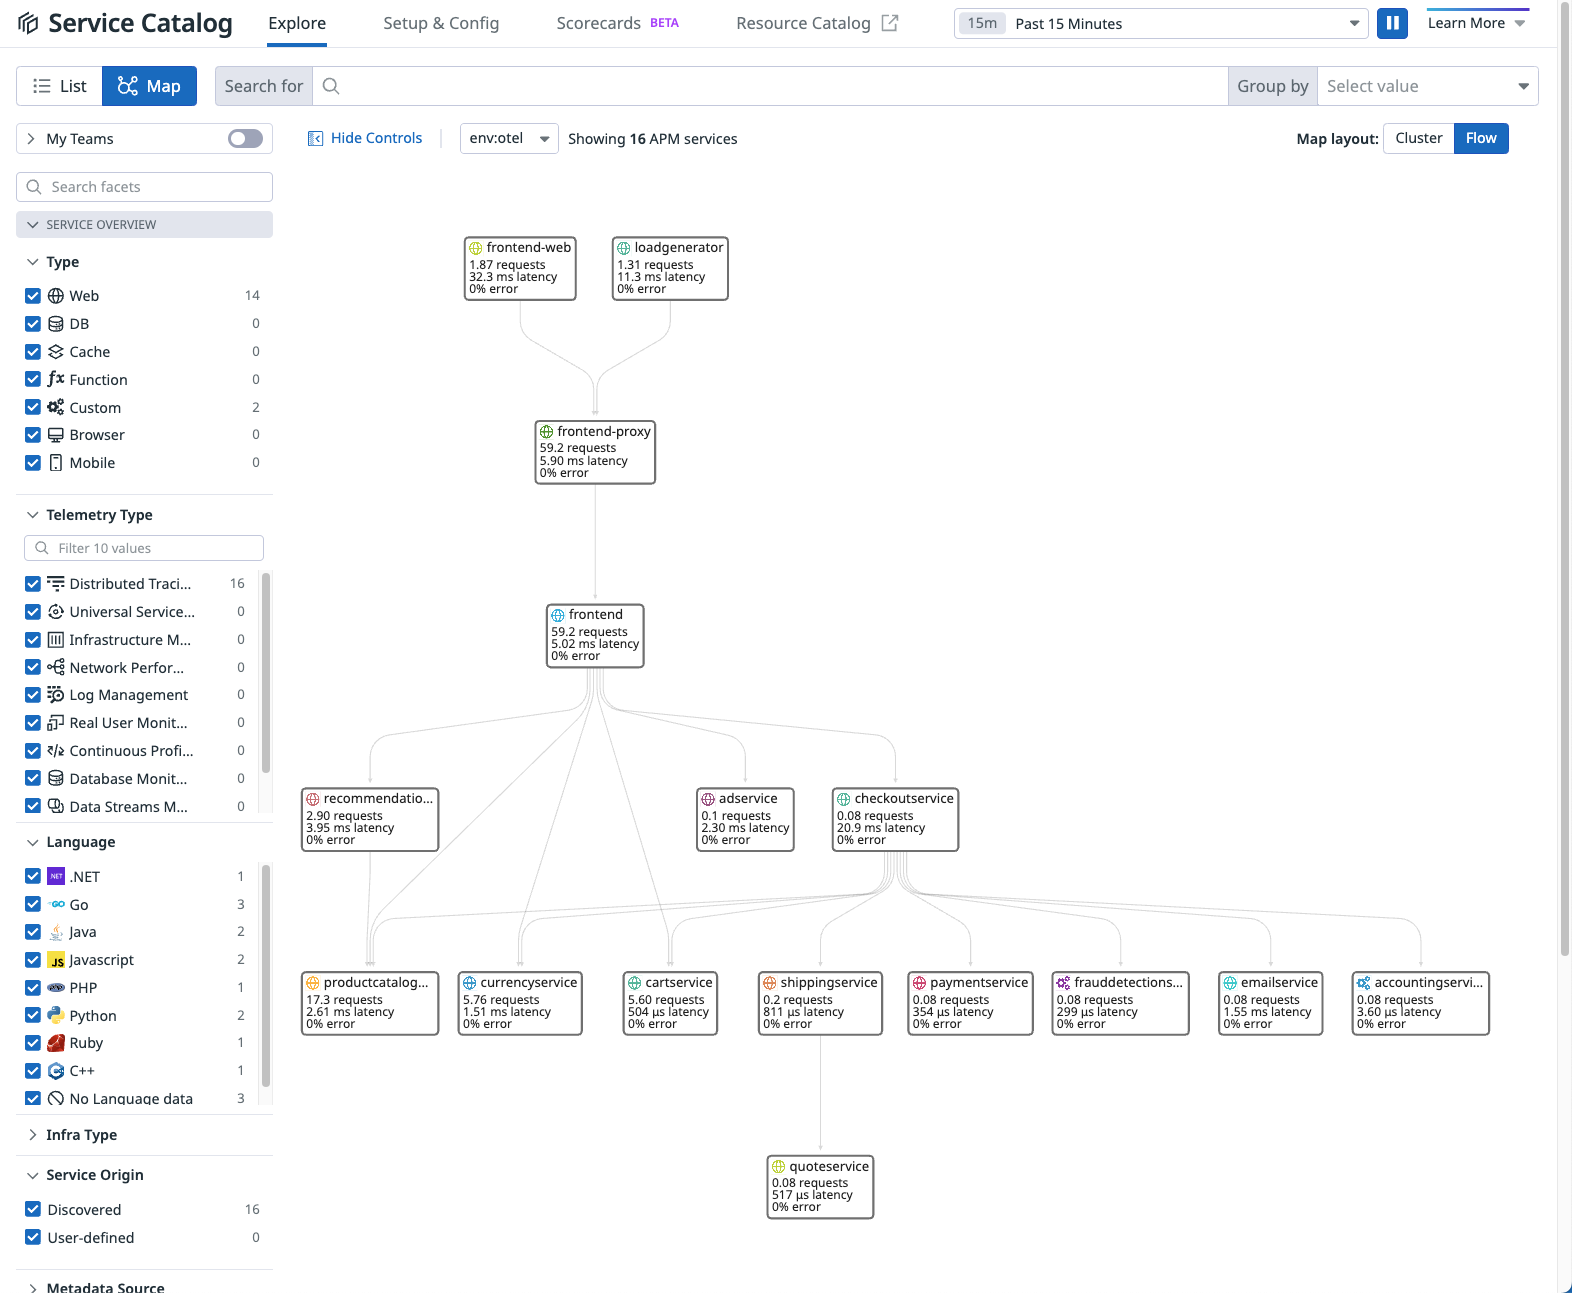
View all services that are part of the OTel Demo:
- Go to APM > Service Catalog.
- Select Map to see how the services are connected. Change the Map layout to Cluster or Flow to view the map in different modes.
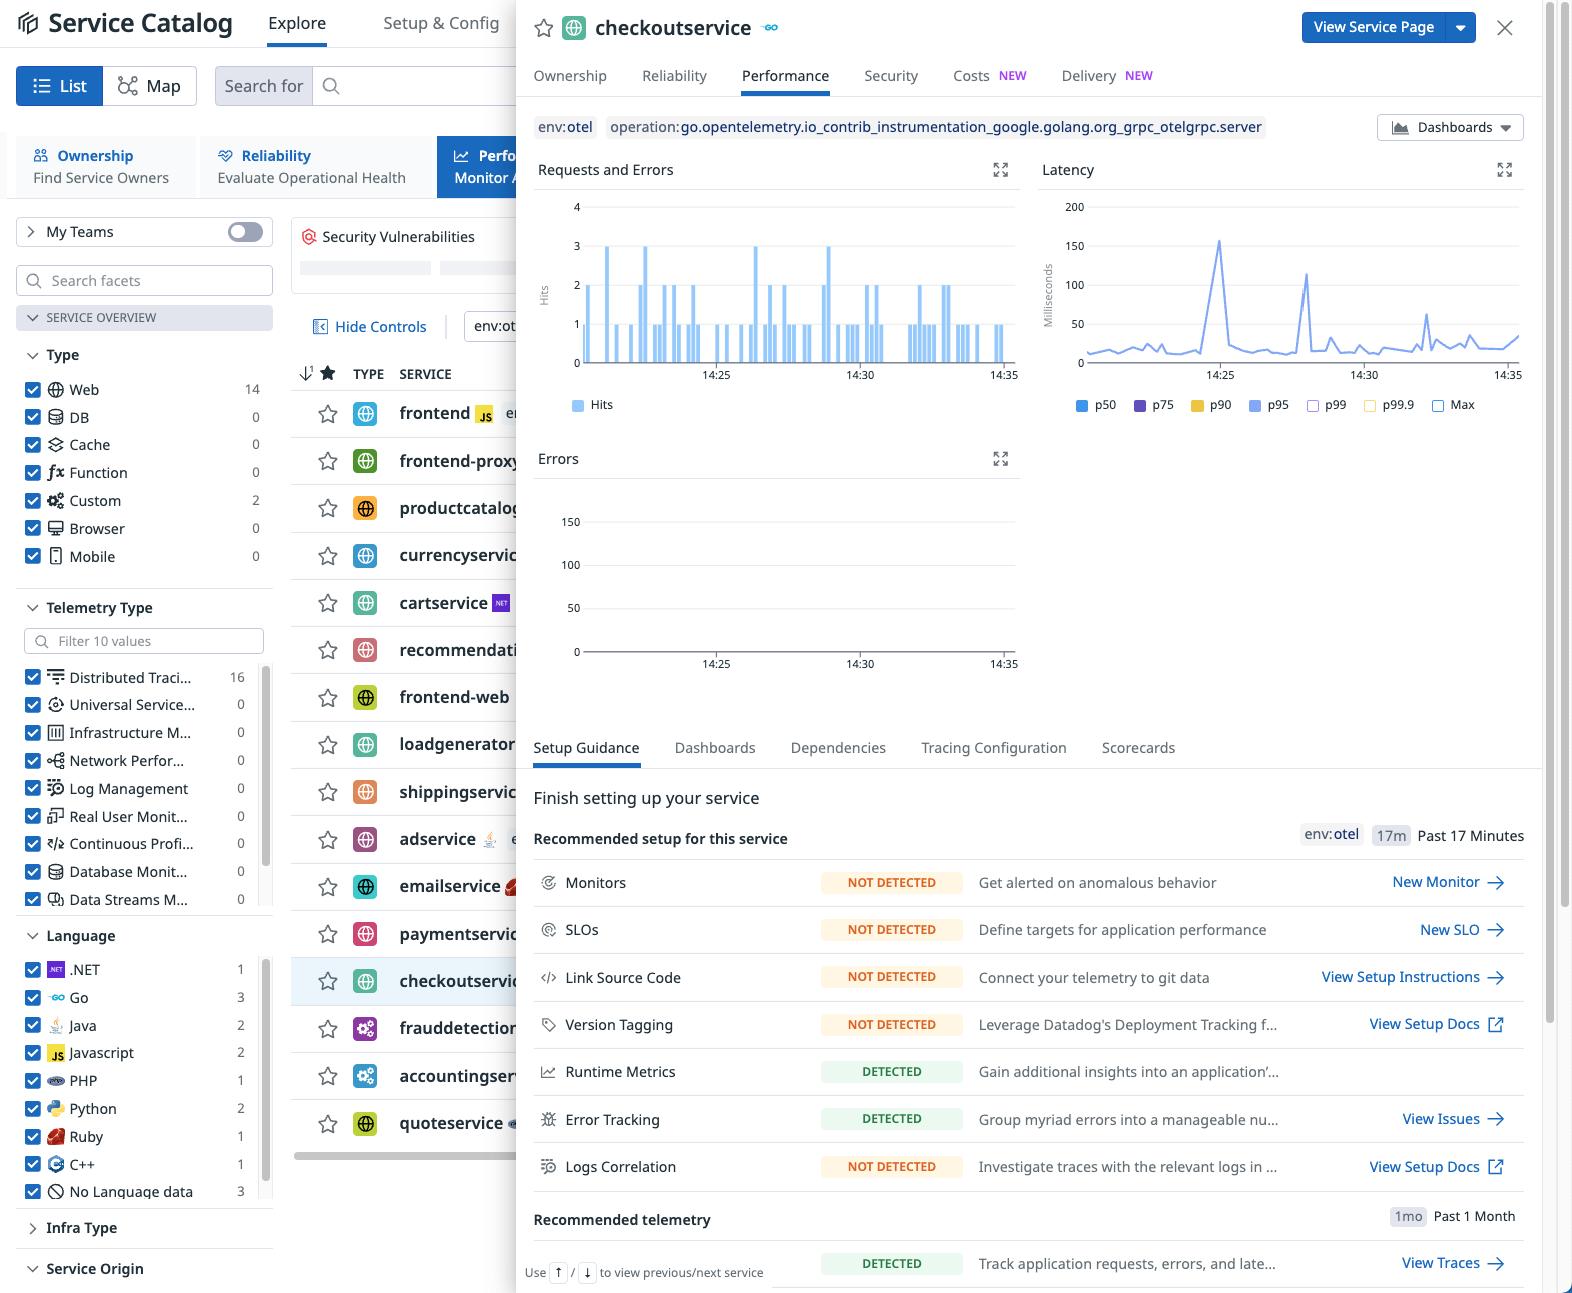
- Select the List view, then select a service to view a performance summary in the side panel.
Trace Explorer
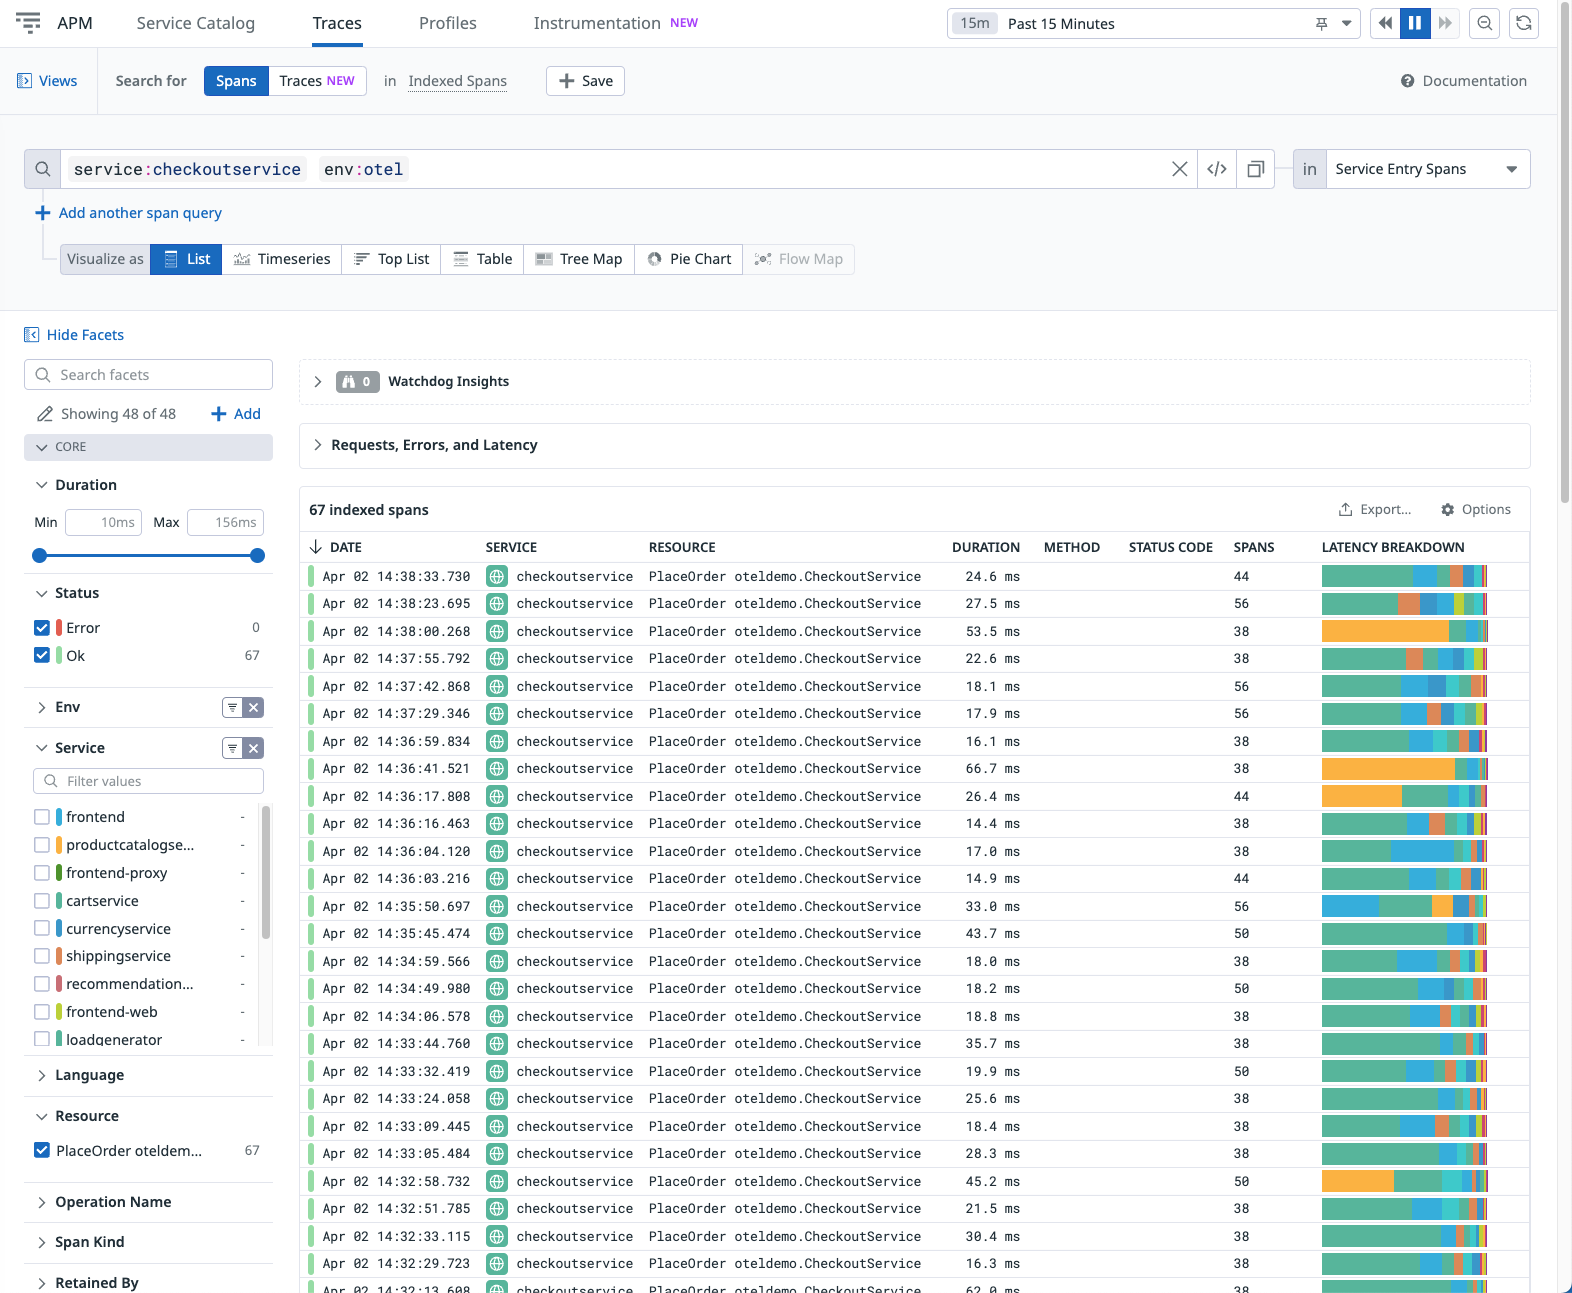
Explore traces received from the OTel Demo:
- From Performance > Setup Guidance, click View Traces to open the Trace Explorer, with the selected service applied as a filter.
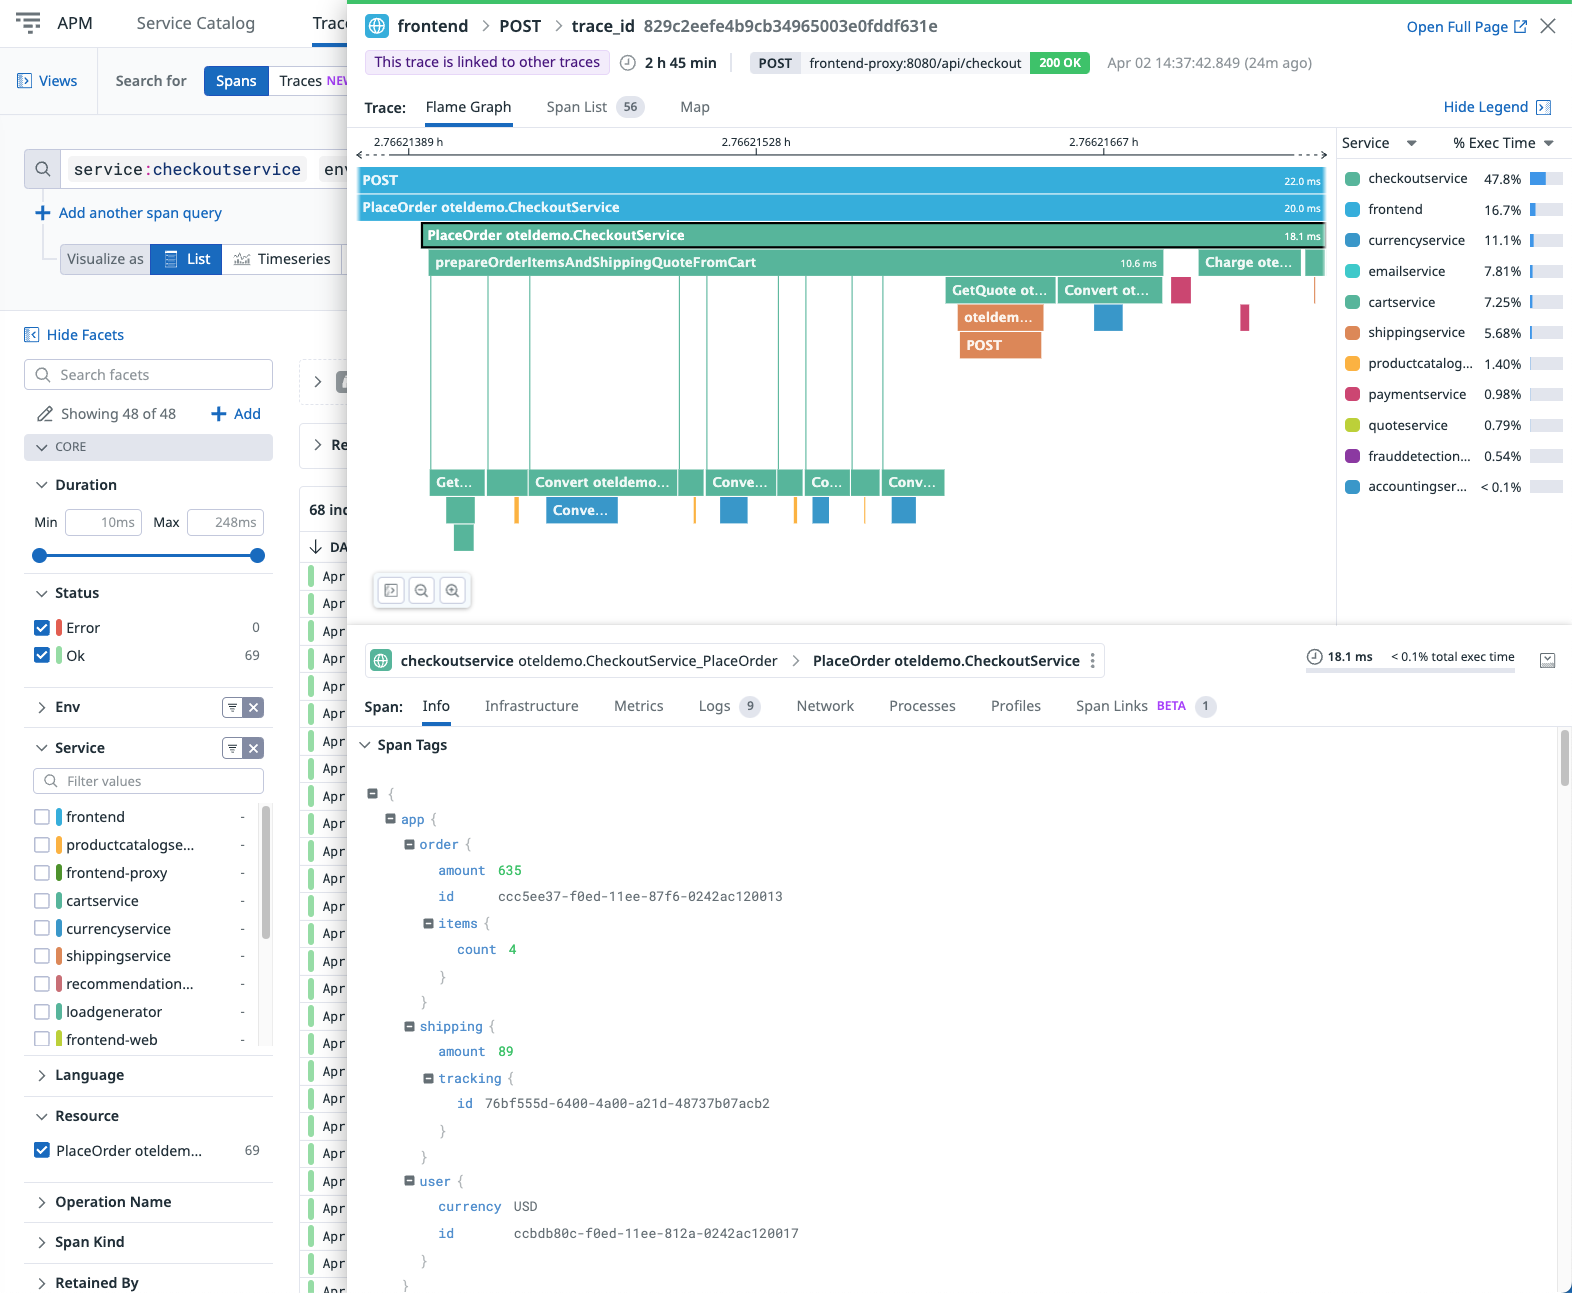
- Select an indexed span to view the full trace details for this transaction.
- Navigate through the tabs to view additional details:
- Infrastructure metrics for the services reporting Host Metrics.
- Runtime metrics for the services that have already been implemented.
- Log entries correlated with this trace.
- Span links linked to this trace.
Trace Queries
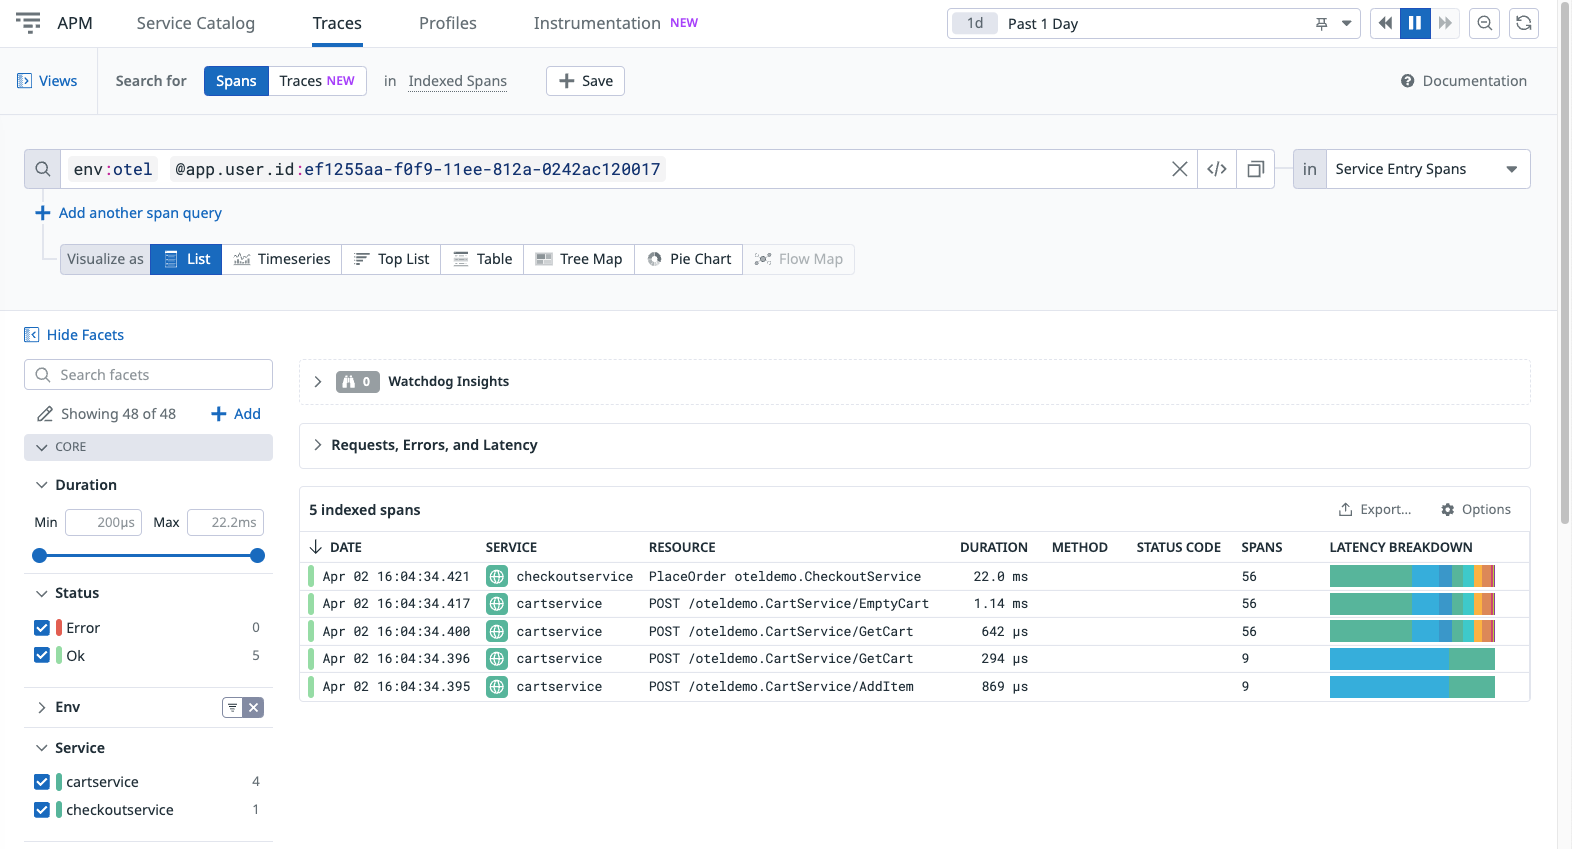
Datadog allows you to filter and group the received OpenTelemetry data. For example, to find all transactions from a specific user, you can use Trace Queries.
The OTel Demo sends user.id as span tags, so you can use this to filter all transactions triggered by the user:
From Info in the side panel, hover over the line with the user ID, click the cog icon, and select filter by @app.user.id:<user_id>.
Remove any previous filters, leaving only @app.user.id applied to view all transactions containing spans with the specified user ID.
Error Tracking
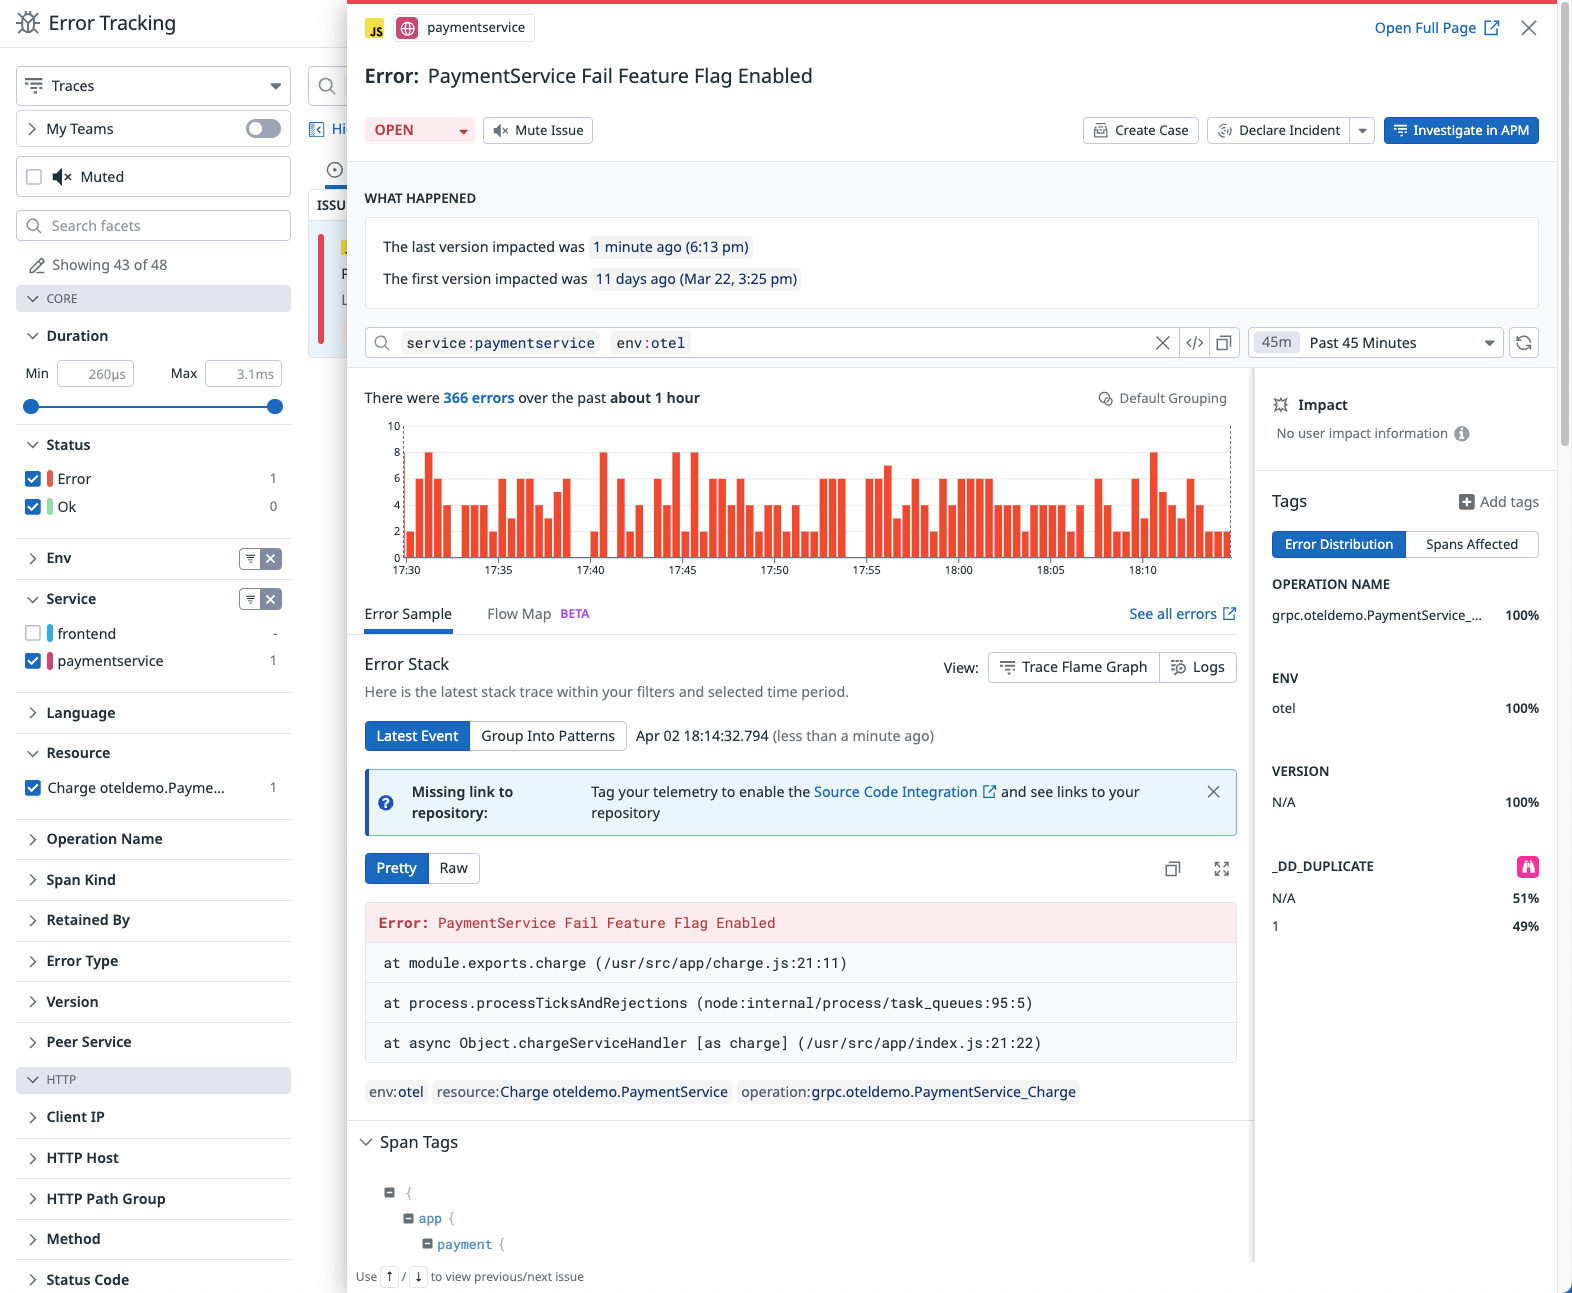
The OpenTelemetry Demo includes flagd, a feature flag evaluation engine for simulating error scenarios.
- Open the
src/flagd/demo.flagd.jsonfile and set thedefaultVarianttoonfor one of the cases. See the OpenTelemetry Demo documentation for available cases. - After the demo starts producing errors, you can visualize and track down the affected services in Datadog.
Further Reading
Documentation, liens et articles supplémentaires utiles:

