- Principales informations
- Getting Started
- Datadog
- Site Datadog
- DevSecOps
- Serverless for AWS Lambda
- Agent
- Intégrations
- Conteneurs
- Dashboards
- Monitors
- Logs
- Tracing
- Profileur
- Tags
- API
- Service Catalog
- Session Replay
- Continuous Testing
- Surveillance Synthetic
- Incident Management
- Database Monitoring
- Cloud Security Management
- Cloud SIEM
- Application Security Management
- Workflow Automation
- CI Visibility
- Test Visibility
- Intelligent Test Runner
- Code Analysis
- Learning Center
- Support
- Glossary
- Standard Attributes
- Guides
- Agent
- Intégrations
- OpenTelemetry
- Développeurs
- Authorization
- DogStatsD
- Checks custom
- Intégrations
- Create an Agent-based Integration
- Create an API Integration
- Create a Log Pipeline
- Integration Assets Reference
- Build a Marketplace Offering
- Create a Tile
- Create an Integration Dashboard
- Create a Recommended Monitor
- Create a Cloud SIEM Detection Rule
- OAuth for Integrations
- Install Agent Integration Developer Tool
- Checks de service
- IDE Plugins
- Communauté
- Guides
- API
- Application mobile
- CoScreen
- Cloudcraft
- In The App
- Dashboards
- Notebooks
- DDSQL Editor
- Alertes
- Infrastructure
- Métriques
- Watchdog
- Bits AI
- Service Catalog
- API Catalog
- Error Tracking
- Service Management
- Infrastructure
- Universal Service Monitoring
- Conteneurs
- Sans serveur
- Surveillance réseau
- Cloud Cost
- Application Performance
- APM
- Profileur en continu
- Database Monitoring
- Agent Integration Overhead
- Setup Architectures
- Configuration de Postgres
- Configuration de MySQL
- Configuration de SQL Server
- Setting Up Oracle
- Setting Up MongoDB
- Connecting DBM and Traces
- Données collectées
- Exploring Database Hosts
- Explorer les métriques de requête
- Explorer des échantillons de requêtes
- Dépannage
- Guides
- Data Streams Monitoring
- Data Jobs Monitoring
- Digital Experience
- RUM et Session Replay
- Product Analytics
- Surveillance Synthetic
- Continuous Testing
- Software Delivery
- CI Visibility
- CD Visibility
- Test Visibility
- Exécuteur de tests intelligent
- Code Analysis
- Quality Gates
- DORA Metrics
- Securité
- Security Overview
- Cloud SIEM
- Cloud Security Management
- Application Security Management
- AI Observability
- Log Management
- Pipelines d'observabilité
- Log Management
- Administration
Investigate Agent Events
Cette page n'est pas encore disponible en français, sa traduction est en cours.
Si vous avez des questions ou des retours sur notre projet de traduction actuel, n'hésitez pas à nous contacter.
Si vous avez des questions ou des retours sur notre projet de traduction actuel, n'hésitez pas à nous contacter.
This topic explains how to use the Agent Events explorer to query and review the Datadog Agent threat detection events generated by the out-of-the-box (OOTB) detection rules.
The Datadog Agent evaluates system activity on the Agent host. When activity matches an Agent rule expression, the Agent generates a detection event and passes it to the Datadog backend.
If an event matches an Agent detection rule and a backend Threat detection rule, a signal is created and displayed in Signals (Agent detection rule + backend Threat detection rule = Signal).
With the Agent Events explorer, you can investigate Agent Events separately from signals. You can review the host path where the event happened, and view the event’s attributes, metrics, and processes. You can also review the Agent rule that generated the event and view triage and response instructions.
Proactively block threats with Active Protection
By default, all OOTB Agent crypto mining threat detection rules are enabled and actively monitoring for threats.
Active Protection enables you to proactively block and terminate crypto mining threats identified by the Datadog Agent threat detection rules.
View Agent events
To view Agent events, go to the Agent Events explorer.
Agent events are queried and displayed using the standard explorer controls in the Datadog Events explorer.
Investigate Agent events
To investigate why an event is listed on the Agent Events explorer, select an event.
The event details include the attributes, metrics, and processes. Metrics links to the host dashboard and Processes links to the host process dashboard and process agent installation steps.
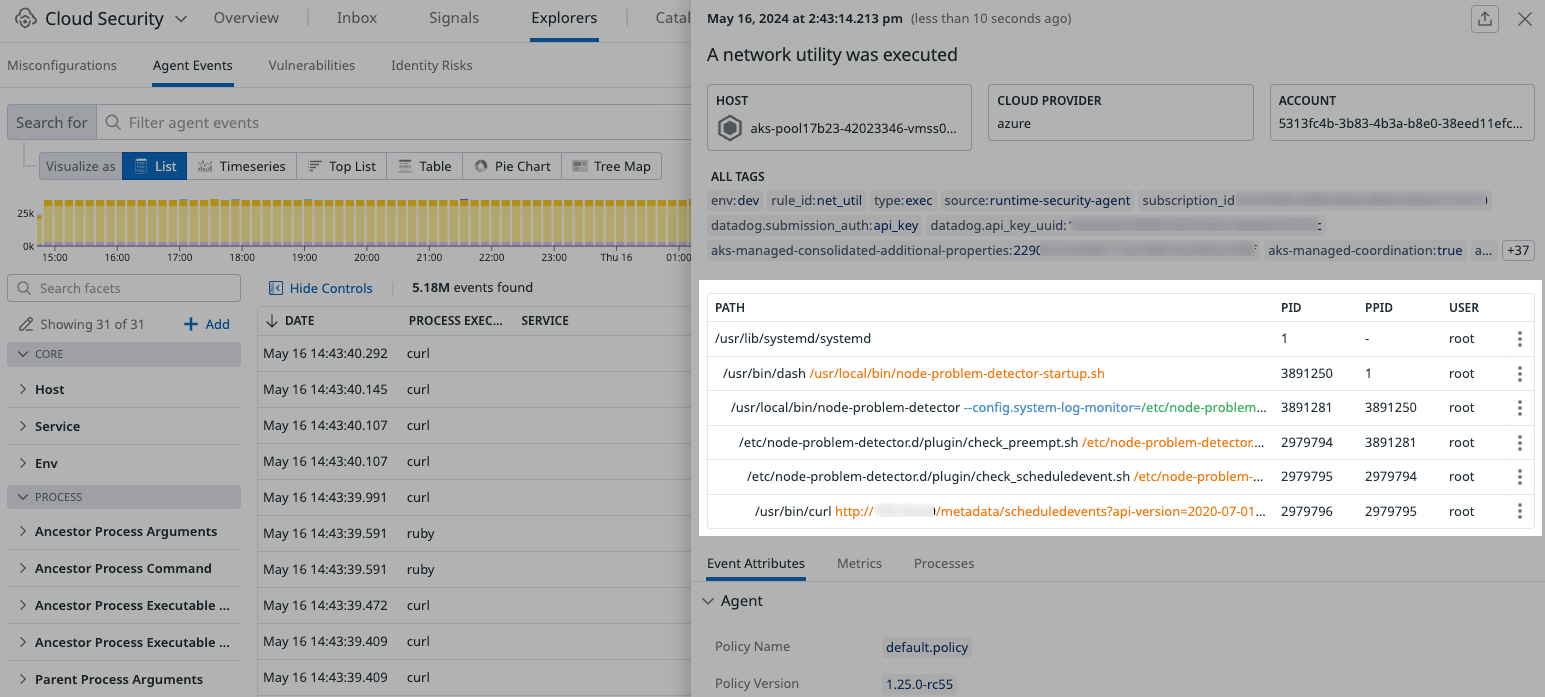
In Path, the latest process tree is displayed. This gives you the best overview of what occurred by showing you all of the commands that led to the command that initiated the event.
Path is often the best place to start your investigation of an event.
Triage Agent events
To triage an event:
- Select the event in the AGENT RULE column in the Agent Events explorer.
- Select Click to copy.
- Open the OOTB rules documention.
- In the search field, paste the copied rule name.
- Select the rule from the results.
- Review the rule Goal, Strategy, and follow the steps in Triage and response.
Further Reading
Documentation, liens et articles supplémentaires utiles:

