- Essentials
- Getting Started
- Datadog
- Datadog Site
- DevSecOps
- Serverless for AWS Lambda
- Agent
- Integrations
- Containers
- Dashboards
- Monitors
- Logs
- APM Tracing
- Profiler
- Tags
- API
- Service Catalog
- Session Replay
- Continuous Testing
- Synthetic Monitoring
- Incident Management
- Database Monitoring
- Cloud Security Management
- Cloud SIEM
- Application Security Management
- Workflow Automation
- CI Visibility
- Test Visibility
- Test Impact Analysis
- Code Analysis
- Learning Center
- Support
- Glossary
- Standard Attributes
- Guides
- Agent
- Integrations
- OpenTelemetry
- Developers
- Authorization
- DogStatsD
- Custom Checks
- Integrations
- Create an Agent-based Integration
- Create an API Integration
- Create a Log Pipeline
- Integration Assets Reference
- Build a Marketplace Offering
- Create a Tile
- Create an Integration Dashboard
- Create a Recommended Monitor
- Create a Cloud SIEM Detection Rule
- OAuth for Integrations
- Install Agent Integration Developer Tool
- Service Checks
- IDE Plugins
- Community
- Guides
- API
- Datadog Mobile App
- CoScreen
- Cloudcraft
- In The App
- Dashboards
- Notebooks
- DDSQL Editor
- Sheets
- Monitors and Alerting
- Infrastructure
- Metrics
- Watchdog
- Bits AI
- Service Catalog
- API Catalog
- Error Tracking
- Service Management
- Infrastructure
- Application Performance
- APM
- Continuous Profiler
- Database Monitoring
- Data Streams Monitoring
- Data Jobs Monitoring
- Digital Experience
- Real User Monitoring
- Product Analytics
- Synthetic Testing and Monitoring
- Continuous Testing
- Software Delivery
- CI Visibility
- CD Visibility
- Test Optimization
- Code Analysis
- Quality Gates
- DORA Metrics
- Security
- Security Overview
- Cloud SIEM
- Cloud Security Management
- Application Security Management
- AI Observability
- Log Management
- Observability Pipelines
- Log Management
- Administration
AWS App Runner
Overview
AWS App Runner enables you to deploy an application from source code or a container image to AWS.
Enable this integration to see all your App Runner metrics in Datadog.
Setup
Installation
If you haven’t already, set up the Amazon Web Services integration first.
Metric collection
- In the AWS integration page, ensure that
AppRunneris enabled under theMetric Collectiontab. - Install the Datadog - AWS App Runner integration.
Log collection
There are two types of logs you can integrate with Datadog from your applications managed by AWS App Runner. These logs are sent to CloudWatch under two different log groups. The first is the service log group that captures all lifecycle activity logs for your App Runner service such as application builds and deployments. The second is the application log group that contains log output from the code of your running application.
Send logs to Datadog
- If you haven’t already, set up the Datadog Forwarder Lambda function.
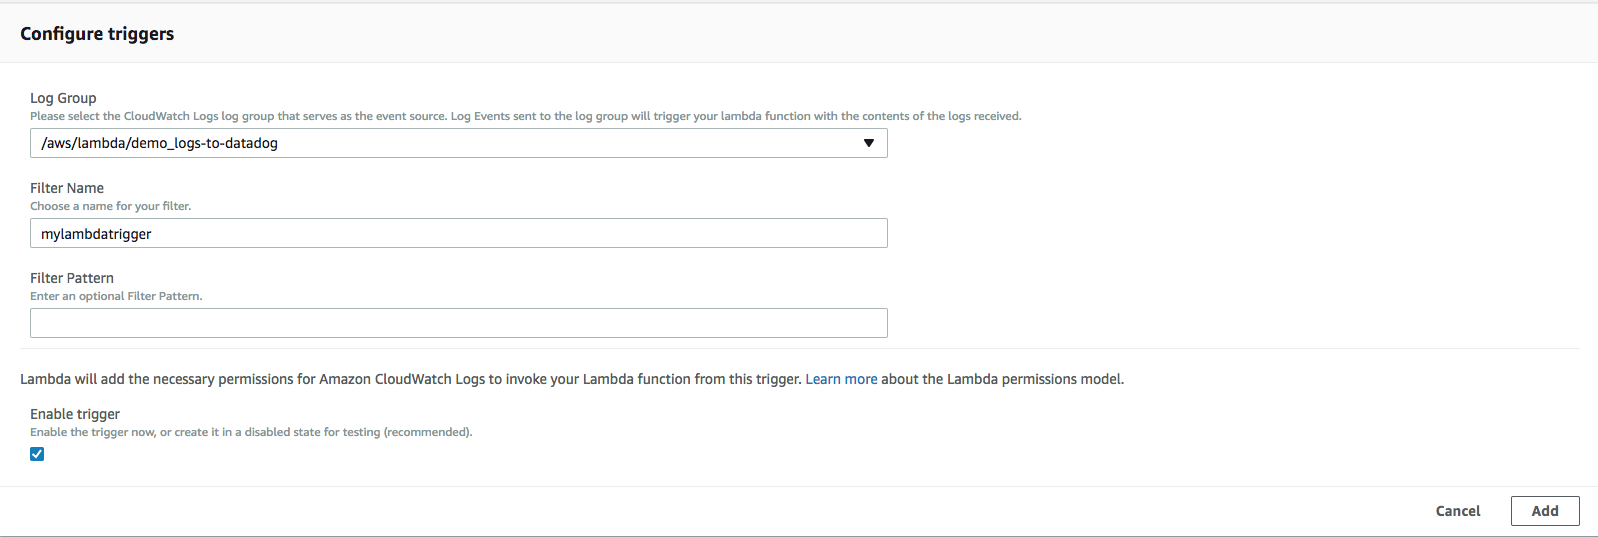
- Once the Lambda function is installed, manually add a trigger on the App Runner service or application CloudWatch log group in the AWS console:Select the corresponding CloudWatch Log group, add a filter name (but feel free to leave the filter empty) and add the trigger:
- Repeat step 2 to add the additional log group.
- Once done, go in your Datadog Log section to start exploring your logs!
Event collection
AWS App Runner sends both service and operation status change events to EventBridge, which you can forward to Datadog for viewing in the Event Stream. To send these events to Datadog, do the following:
- Create an EventBridge API Destination for Datadog Events.
- Create an EventBridge rule to act on AWS App Runner events (see Handling App Runner events in EventBridge). Choose the API Destination as the target.
- Start viewing new status change events in the Datadog Event Stream.
Data Collected
Metrics
| aws.apprunner.2xx_status_responses (count) | The number of 2XX HTTP responses. Shown as response |
| aws.apprunner.4xx_status_responses (count) | The number of 4XX HTTP responses. Shown as response |
| aws.apprunner.5xx_status_responses (count) | The number of 5XX HTTP responses. Shown as response |
| aws.apprunner.active_instances (gauge) | The number of active instances. Shown as instance |
| aws.apprunner.cpuutilization (gauge) | Average CPU usage over one-minute periods. Shown as percent |
| aws.apprunner.memory_utilization (gauge) | Average memory usage over one-minute periods. Shown as percent |
| aws.apprunner.request_latency (gauge) | The time it took your web service to process HTTP requests. Shown as millisecond |
| aws.apprunner.request_latency.p50 (gauge) | 50th percentile of the time it took your web service to process HTTP requests. Shown as millisecond |
| aws.apprunner.request_latency.p95 (gauge) | 95th percentile of the time it took your web service to process HTTP requests. Shown as millisecond |
| aws.apprunner.request_latency.p99 (gauge) | 99th percentile of the time it took your web service to process HTTP requests. Shown as millisecond |
| aws.apprunner.requests (count) | The number of HTTP requests that the service received. Shown as request |
Events
The AWS App Runner integration supports both service and operation status change events from EventBridge.
Service Checks
The AWS App Runner integration does not include any service checks.
Troubleshooting
Need help? Contact Datadog support.


