- Essentials
- Getting Started
- Datadog
- Datadog Site
- DevSecOps
- Serverless for AWS Lambda
- Agent
- Integrations
- Containers
- Dashboards
- Monitors
- Logs
- APM Tracing
- Profiler
- Tags
- API
- Service Catalog
- Session Replay
- Continuous Testing
- Synthetic Monitoring
- Incident Management
- Database Monitoring
- Cloud Security Management
- Cloud SIEM
- Application Security Management
- Workflow Automation
- CI Visibility
- Test Visibility
- Test Impact Analysis
- Code Analysis
- Learning Center
- Support
- Glossary
- Standard Attributes
- Guides
- Agent
- Integrations
- OpenTelemetry
- Developers
- Authorization
- DogStatsD
- Custom Checks
- Integrations
- Create an Agent-based Integration
- Create an API Integration
- Create a Log Pipeline
- Integration Assets Reference
- Build a Marketplace Offering
- Create a Tile
- Create an Integration Dashboard
- Create a Recommended Monitor
- Create a Cloud SIEM Detection Rule
- OAuth for Integrations
- Install Agent Integration Developer Tool
- Service Checks
- IDE Plugins
- Community
- Guides
- API
- Datadog Mobile App
- CoScreen
- Cloudcraft
- In The App
- Dashboards
- Notebooks
- DDSQL Editor
- Sheets
- Monitors and Alerting
- Infrastructure
- Metrics
- Watchdog
- Bits AI
- Service Catalog
- API Catalog
- Error Tracking
- Service Management
- Infrastructure
- Application Performance
- APM
- Continuous Profiler
- Database Monitoring
- Data Streams Monitoring
- Data Jobs Monitoring
- Digital Experience
- Real User Monitoring
- Product Analytics
- Synthetic Testing and Monitoring
- Continuous Testing
- Software Delivery
- CI Visibility
- CD Visibility
- Test Optimization
- Code Analysis
- Quality Gates
- DORA Metrics
- Security
- Security Overview
- Cloud SIEM
- Cloud Security Management
- Application Security Management
- AI Observability
- Log Management
- Observability Pipelines
- Log Management
- Administration
Azure Integration Architecture and Configuration
Overview
This guide provides detailed information and reference architectures for users configuring Datadog’s Azure integration, as well as alternative configuration options for specific use cases.
Reference architectures
The diagrams in this guide provide a visual representation of the configuration process and outcome when following the steps in the Azure integration page. This guide provides a detailed overview of Datadog’s interaction with your Azure environment and answers common security, compliance, and governance questions.
Alternate configurations
The setup processes documented in the Azure integration page are the recommended steps and result in the ideal configuration for the majority of users. Alternate configuration options in this document may be preferable for certain use cases. Any trade-offs in performance, features, or ease-of-management are outlined as needed.
Azure metric and data collection
Enabling Datadog’s Azure integration allows Datadog to:
- Discover and monitor all resources in all subscriptions within the given scope
- Automatically update discovered metric definitions, to ensure that all of the metrics available from Azure Monitor are collected
- Ingest a range of both general and resource-specific metadata (including custom Azure tags), and apply it to the associated resource metrics in Datadog as tags
- Query Azure metadata APIs and use the responses to generate useful metrics in Datadog for insights that Azure Monitor does not support
The Azure APIs used and data collected are identical regardless of whether you use the standard or Azure Native version of the integration.
Standard Azure integration metric and data collection
Available in all Datadog Sites
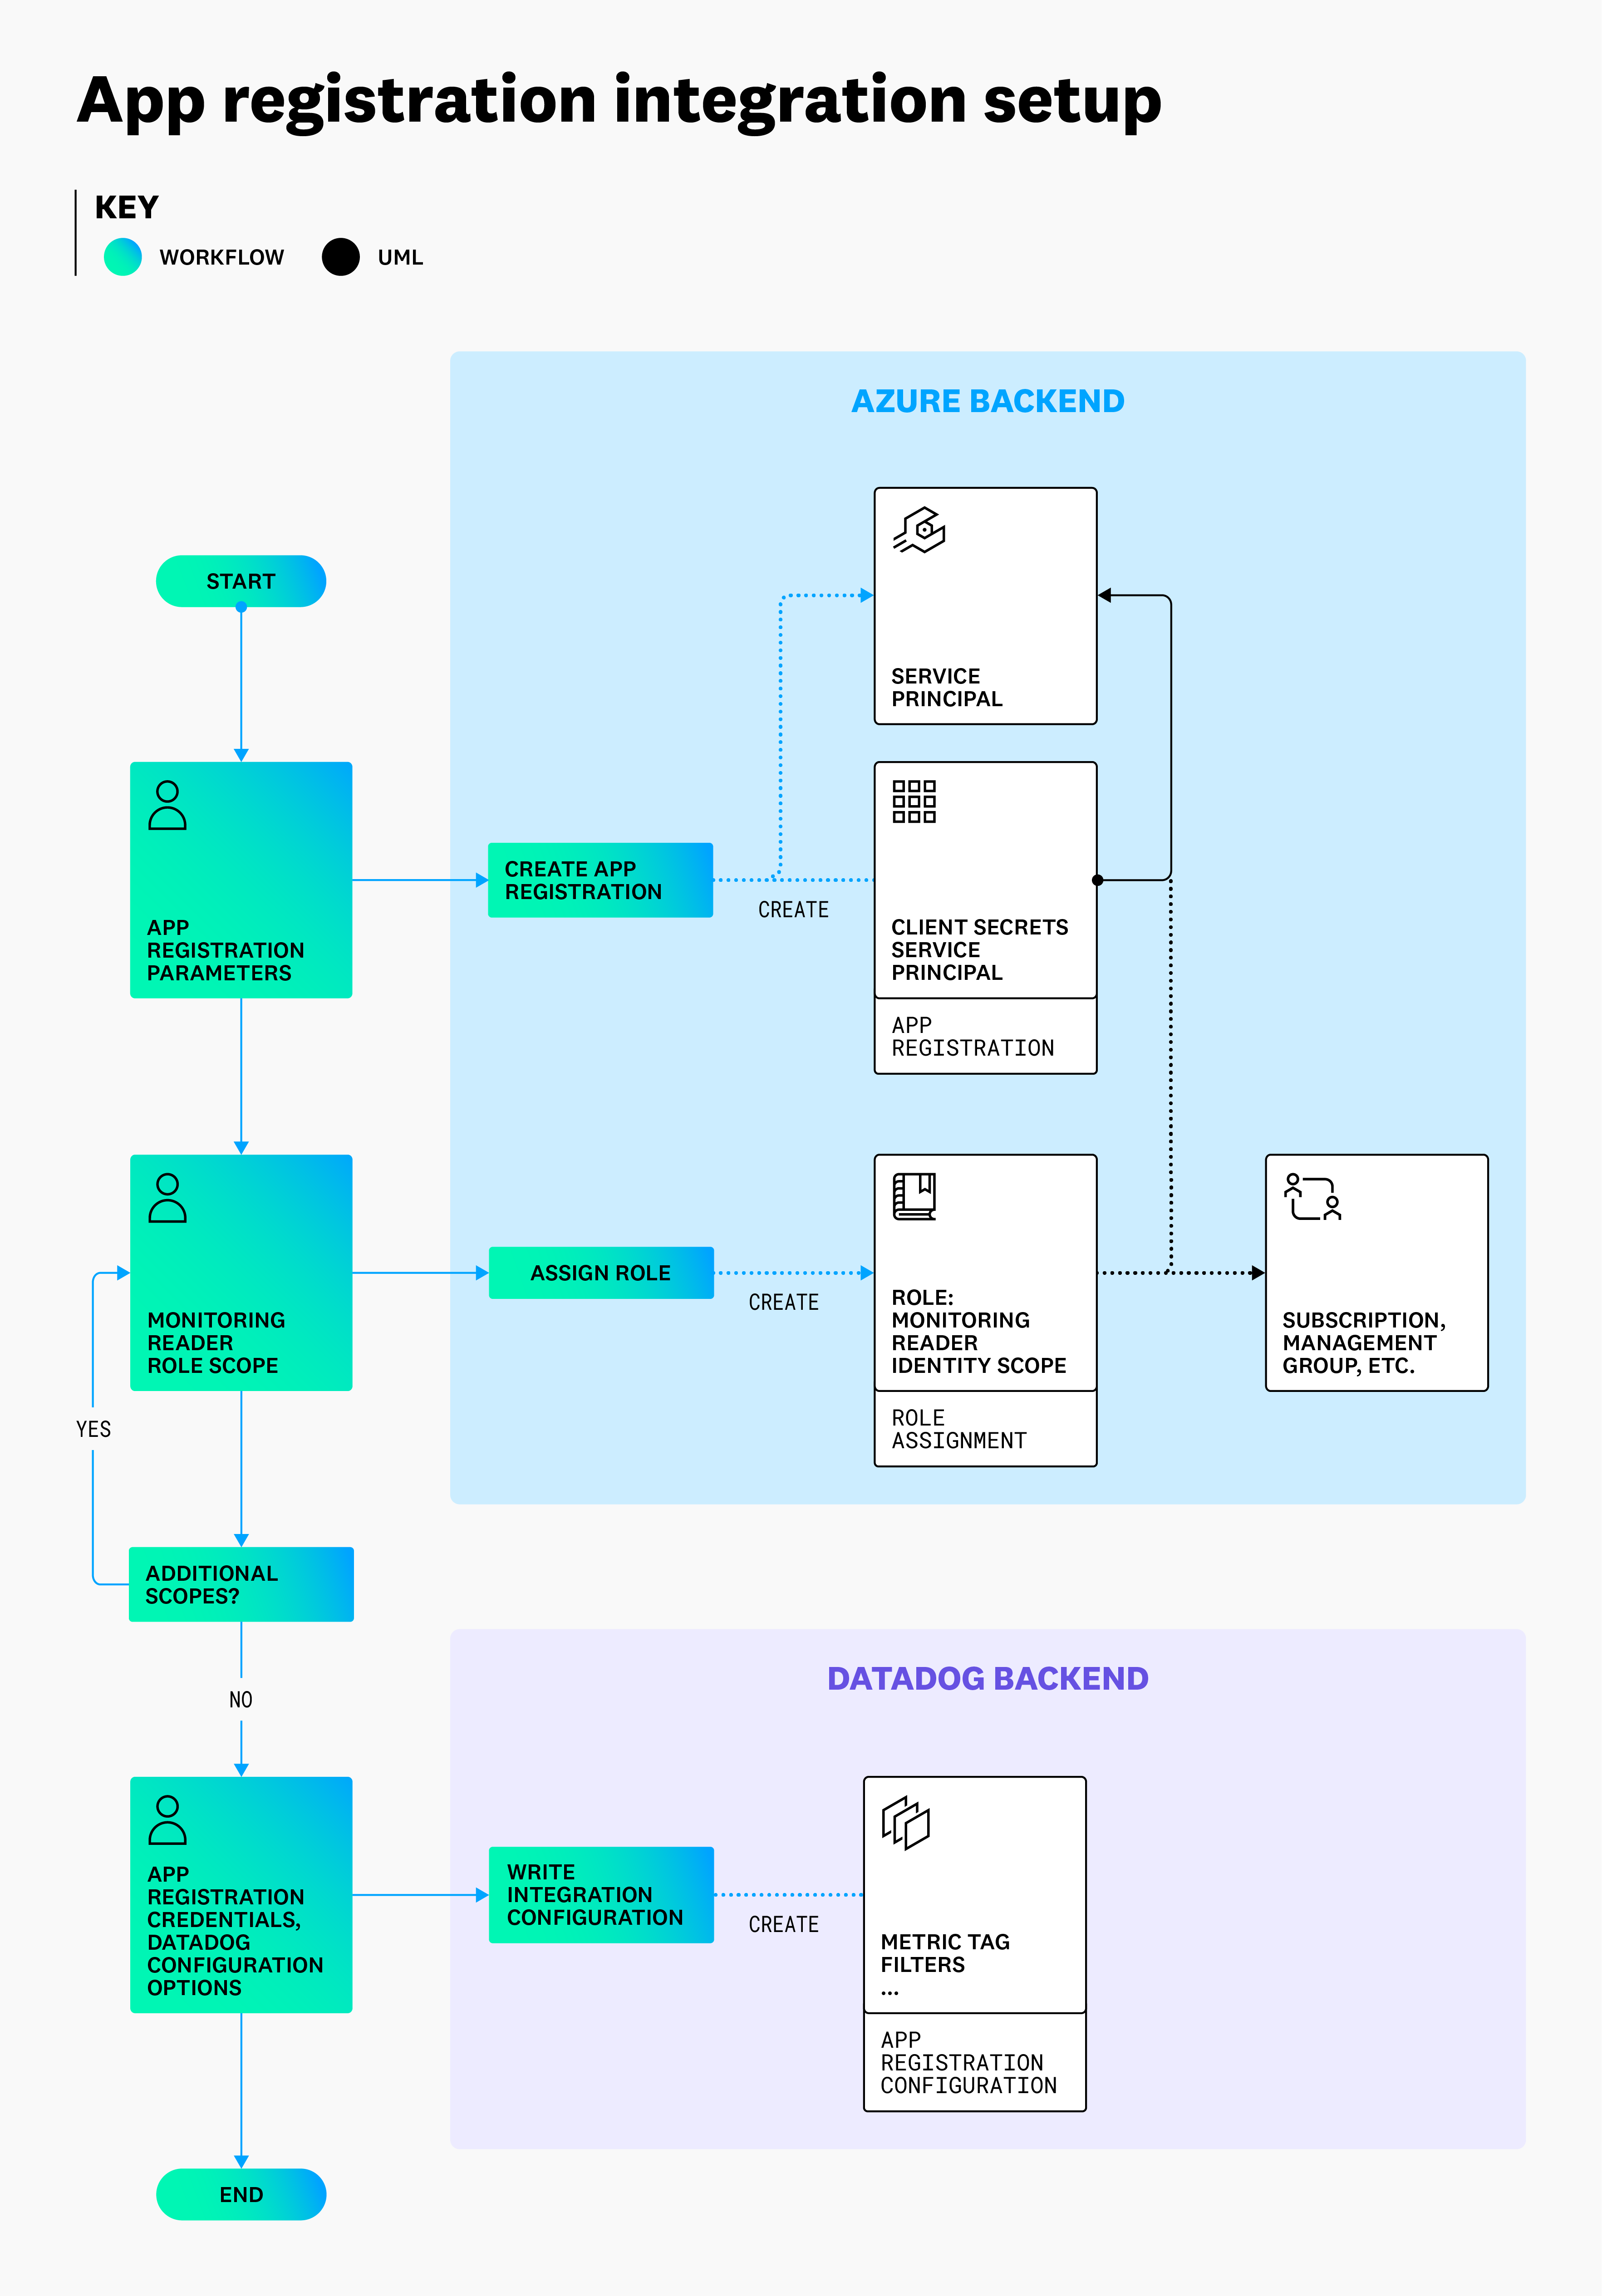
Follow these steps to enable the standard Azure integration:
- Create an app registration in your Active Directory and enter the credentials in the Datadog Azure integration page.
- Give the application read access (
Monitoring Readerrole) to the subscriptions or management group you would like to monitor.
The diagram below outlines the process and resulting architecture of the Azure integration configuration described in the main documentation.
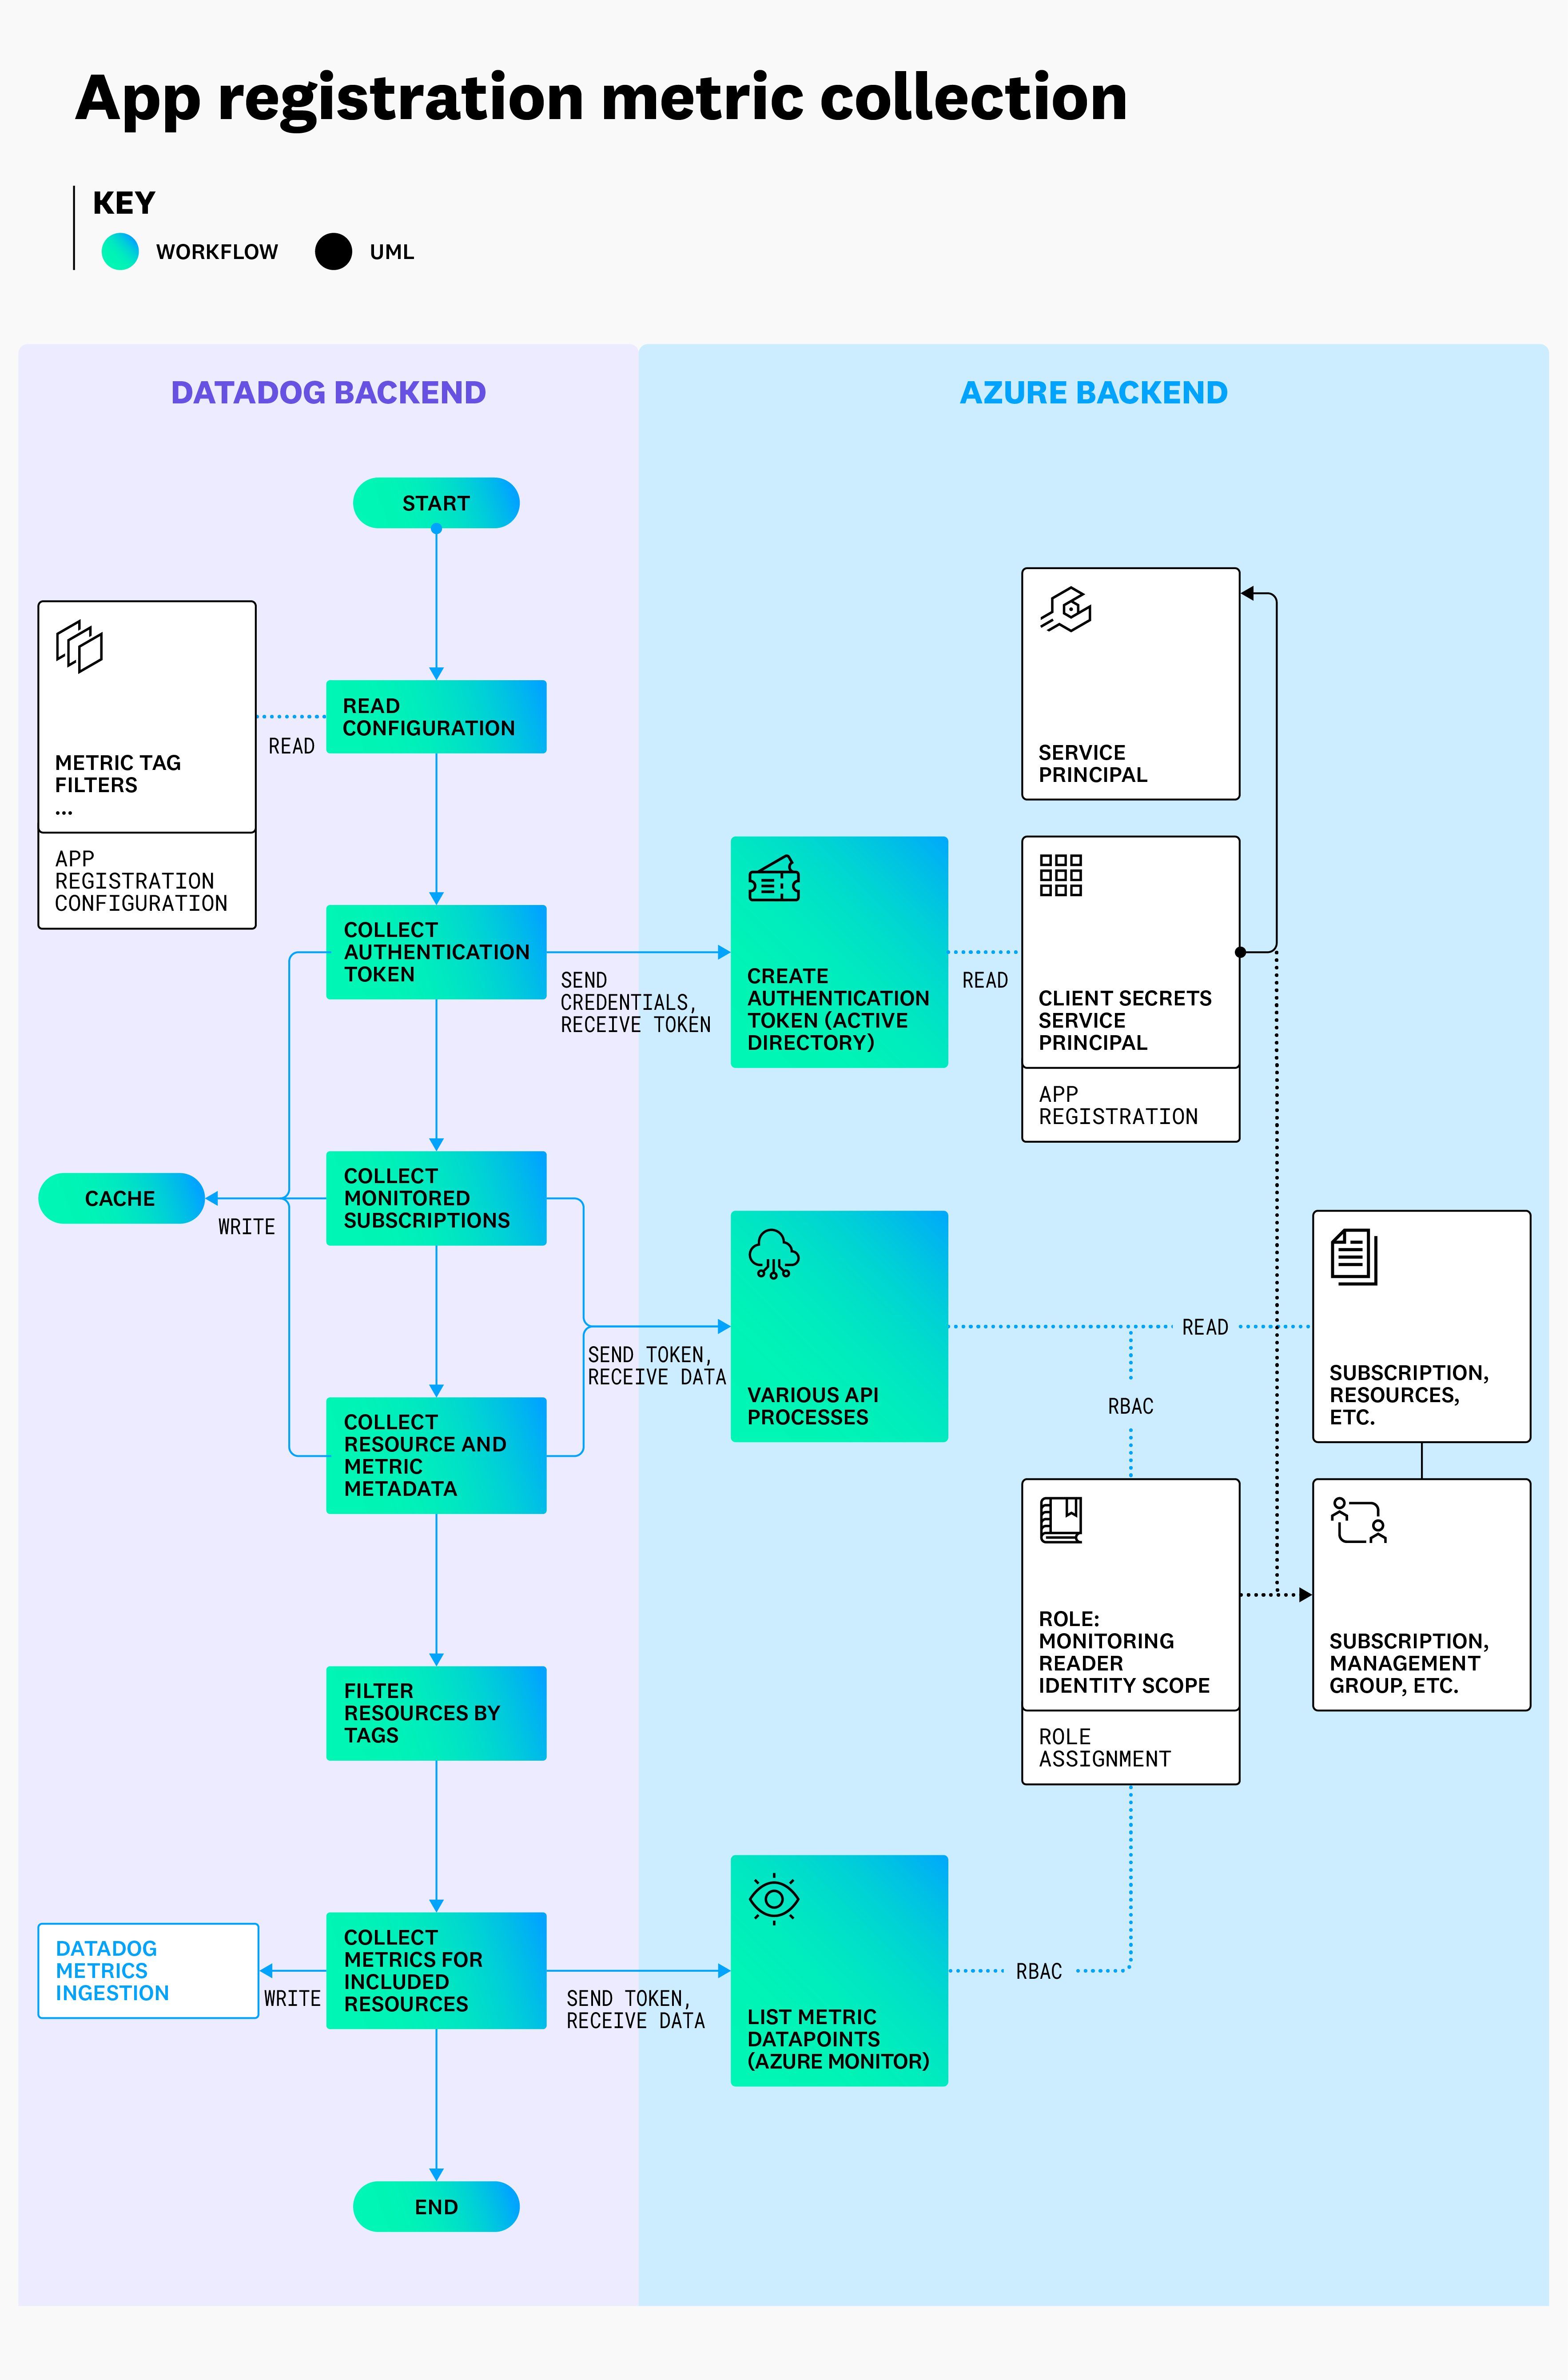
Once this is completed, data collection begins automatically. The app registration information entered in Datadog allows Datadog to request a token from Azure Active Directory (AD). Datadog uses this token as the authorization for API calls to various Azure APIs, to discover resources within the scope provided, and collect data. This continuous process runs with two-minute intervals by default, and is used to discover and collect data from your Azure environment. The data collection process is pictured below.
Azure Native integration metric collection
Available only in the Datadog US3 site
Linking accounts: The Datadog resource in Azure links your Azure environment and your Datadog account. This link enables the same data collection as the standard Azure integration available for other Datadog sites, but with a different authentication mechanism. Its access is assigned using a System Managed Identity associated with the Datadog resource in Azure, rather than a user-created and configured App Registration.
Permissions: The Monitoring Reader role assignment happens automatically during the creation of the Datadog resource, and is scoped to the parent subscription of the Datadog resource. If you add additional subscriptions for monitoring to the Datadog resource, this scope is updated for the Managed Identity automatically.
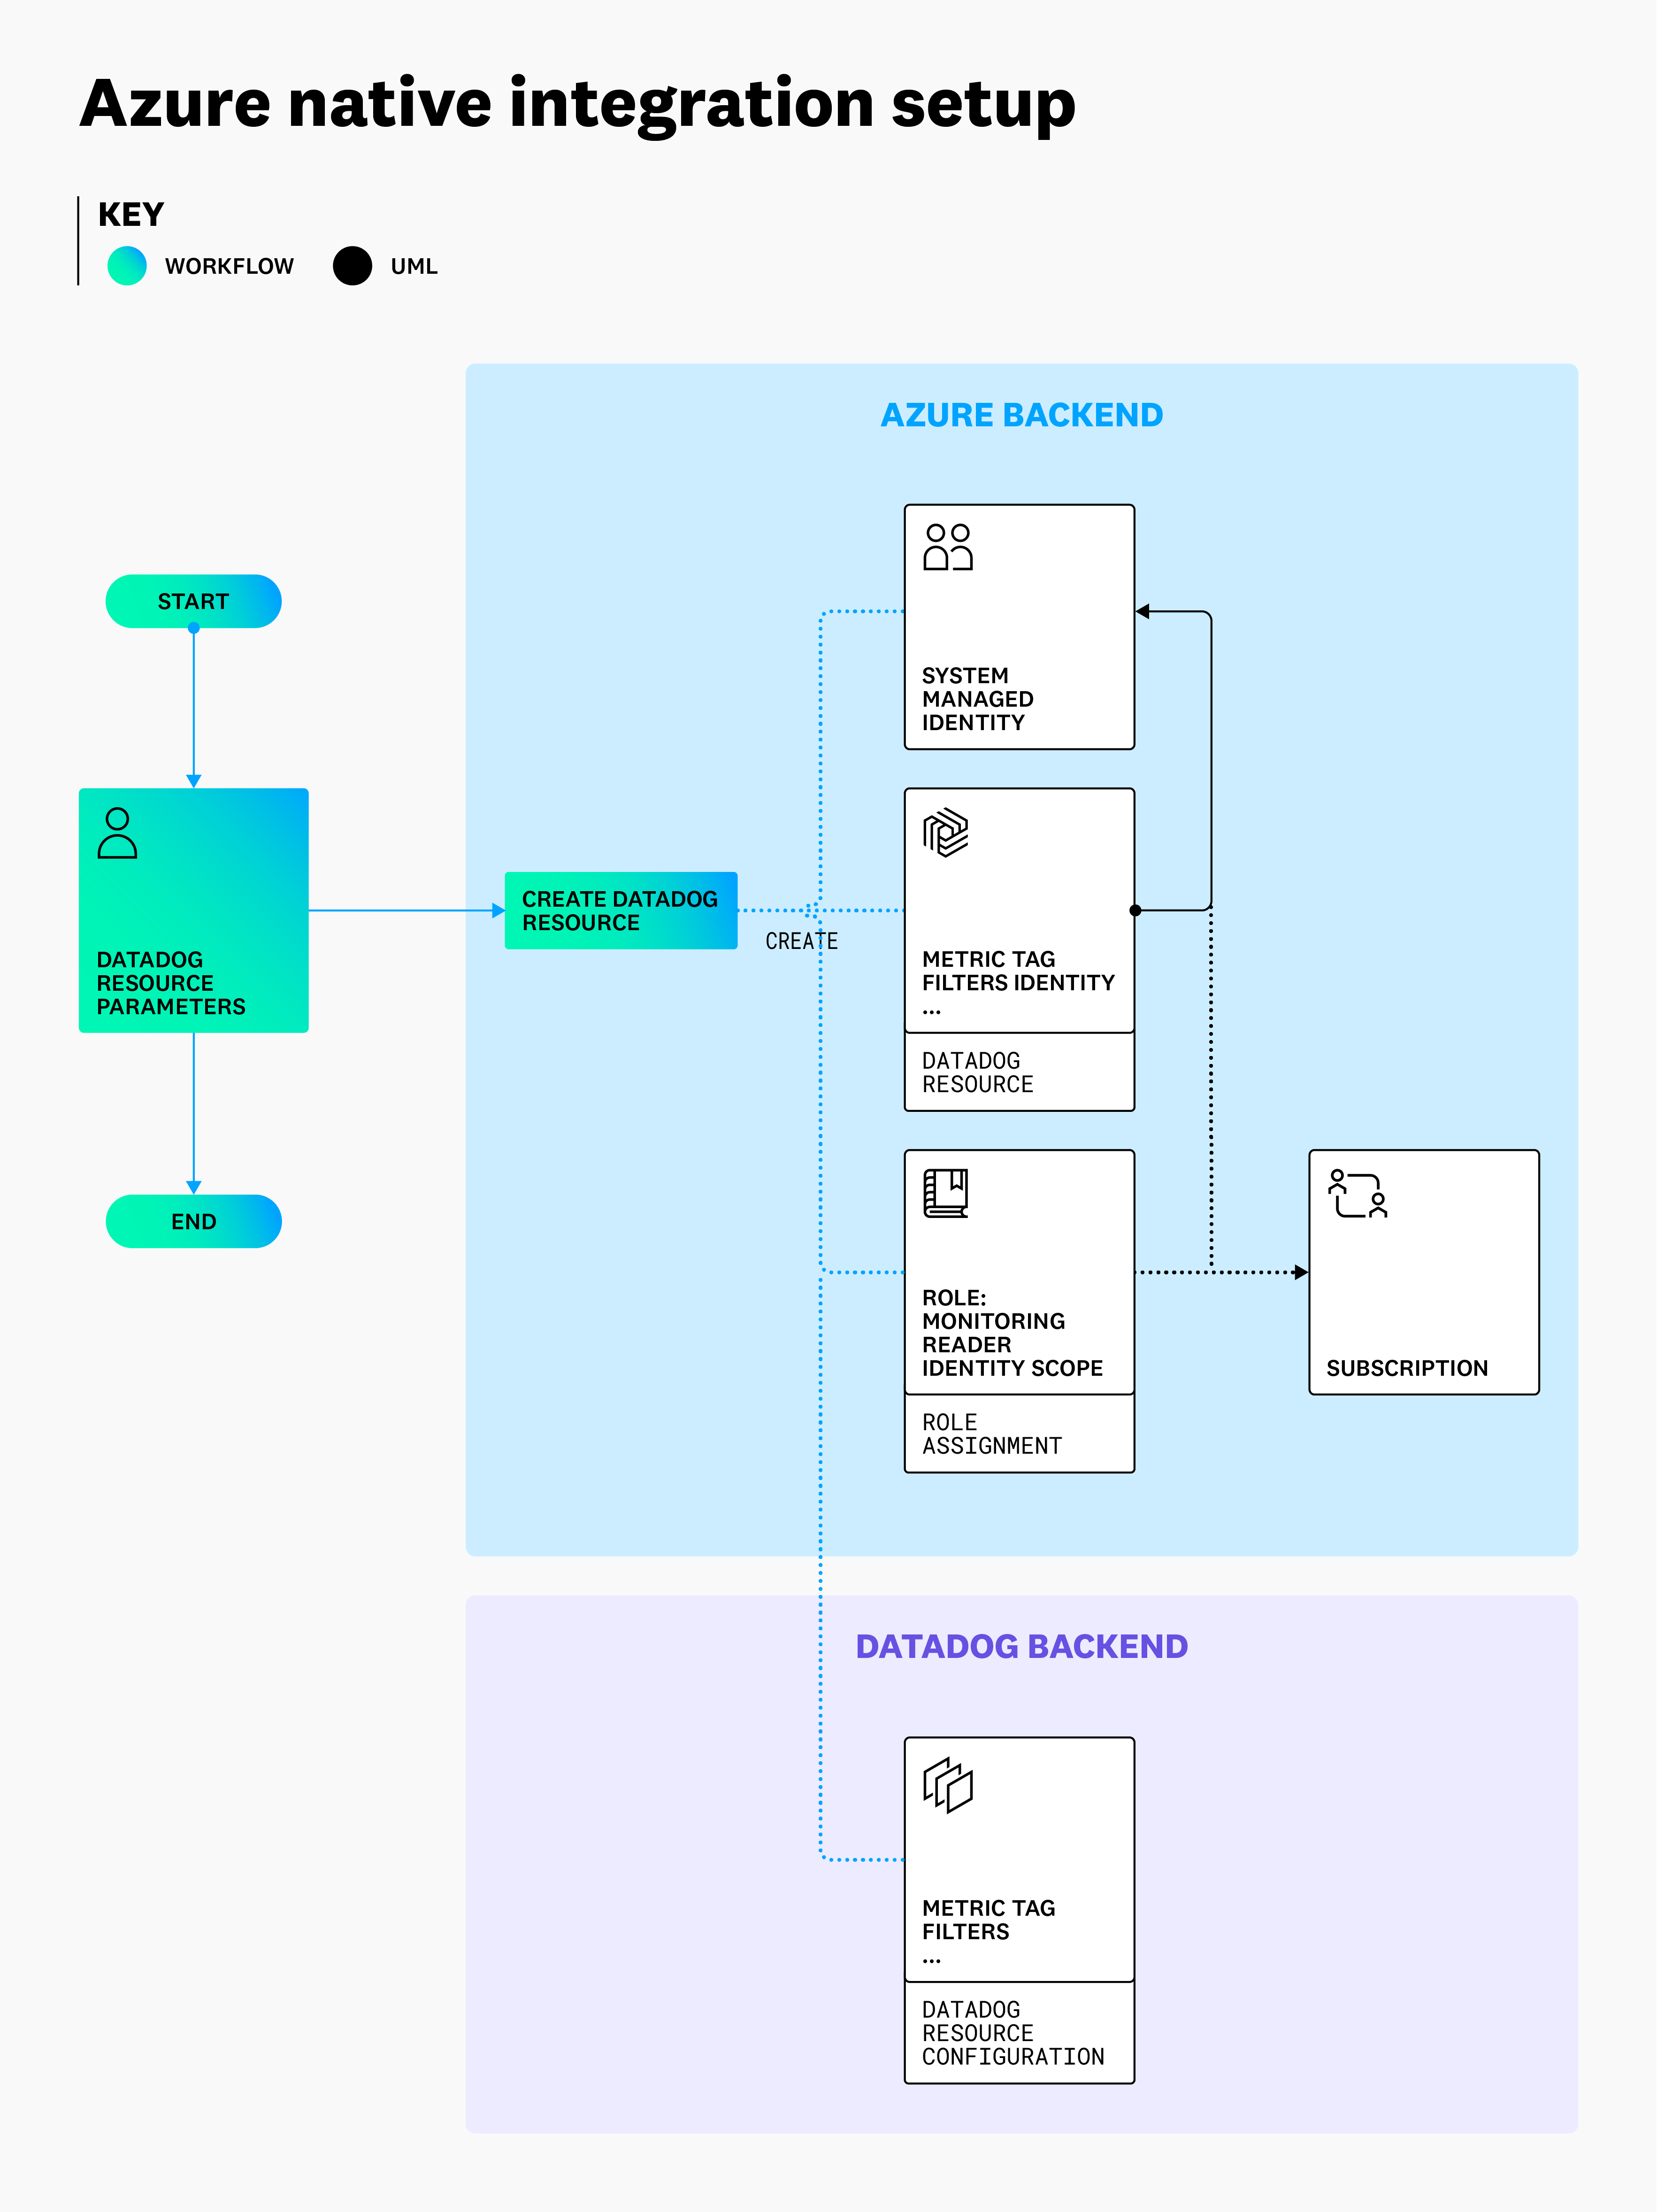
Follow these steps to enable the Azure Native integration:
- Confirm that your Datadog organization is hosted on the US3 Datadog site, or create a trial Datadog account on the US3 site.
- Create a Datadog resource in Azure that links at least one subscription.
- Optionally, update the Datadog resource to include other subscriptions.
As an external ISV, there is an additional, separate process to request and use this access:
- Datadog authenticates into Azure and uses a private Azure service to request the customer token associated with the given Datadog resource.
- This Azure service verifies Datadog’s identity, and ensures the requested Datadog resource exists and is enabled.
- Azure returns a short-lived customer token to Datadog. This token enables the same level of access granted to the associated system managed identity.
- Datadog uses this customer token to query data in the monitored environment until it approaches expiration, at which point the process repeats.
The diagram below outlines the process and resulting architecture of the Azure Native integration configuration.
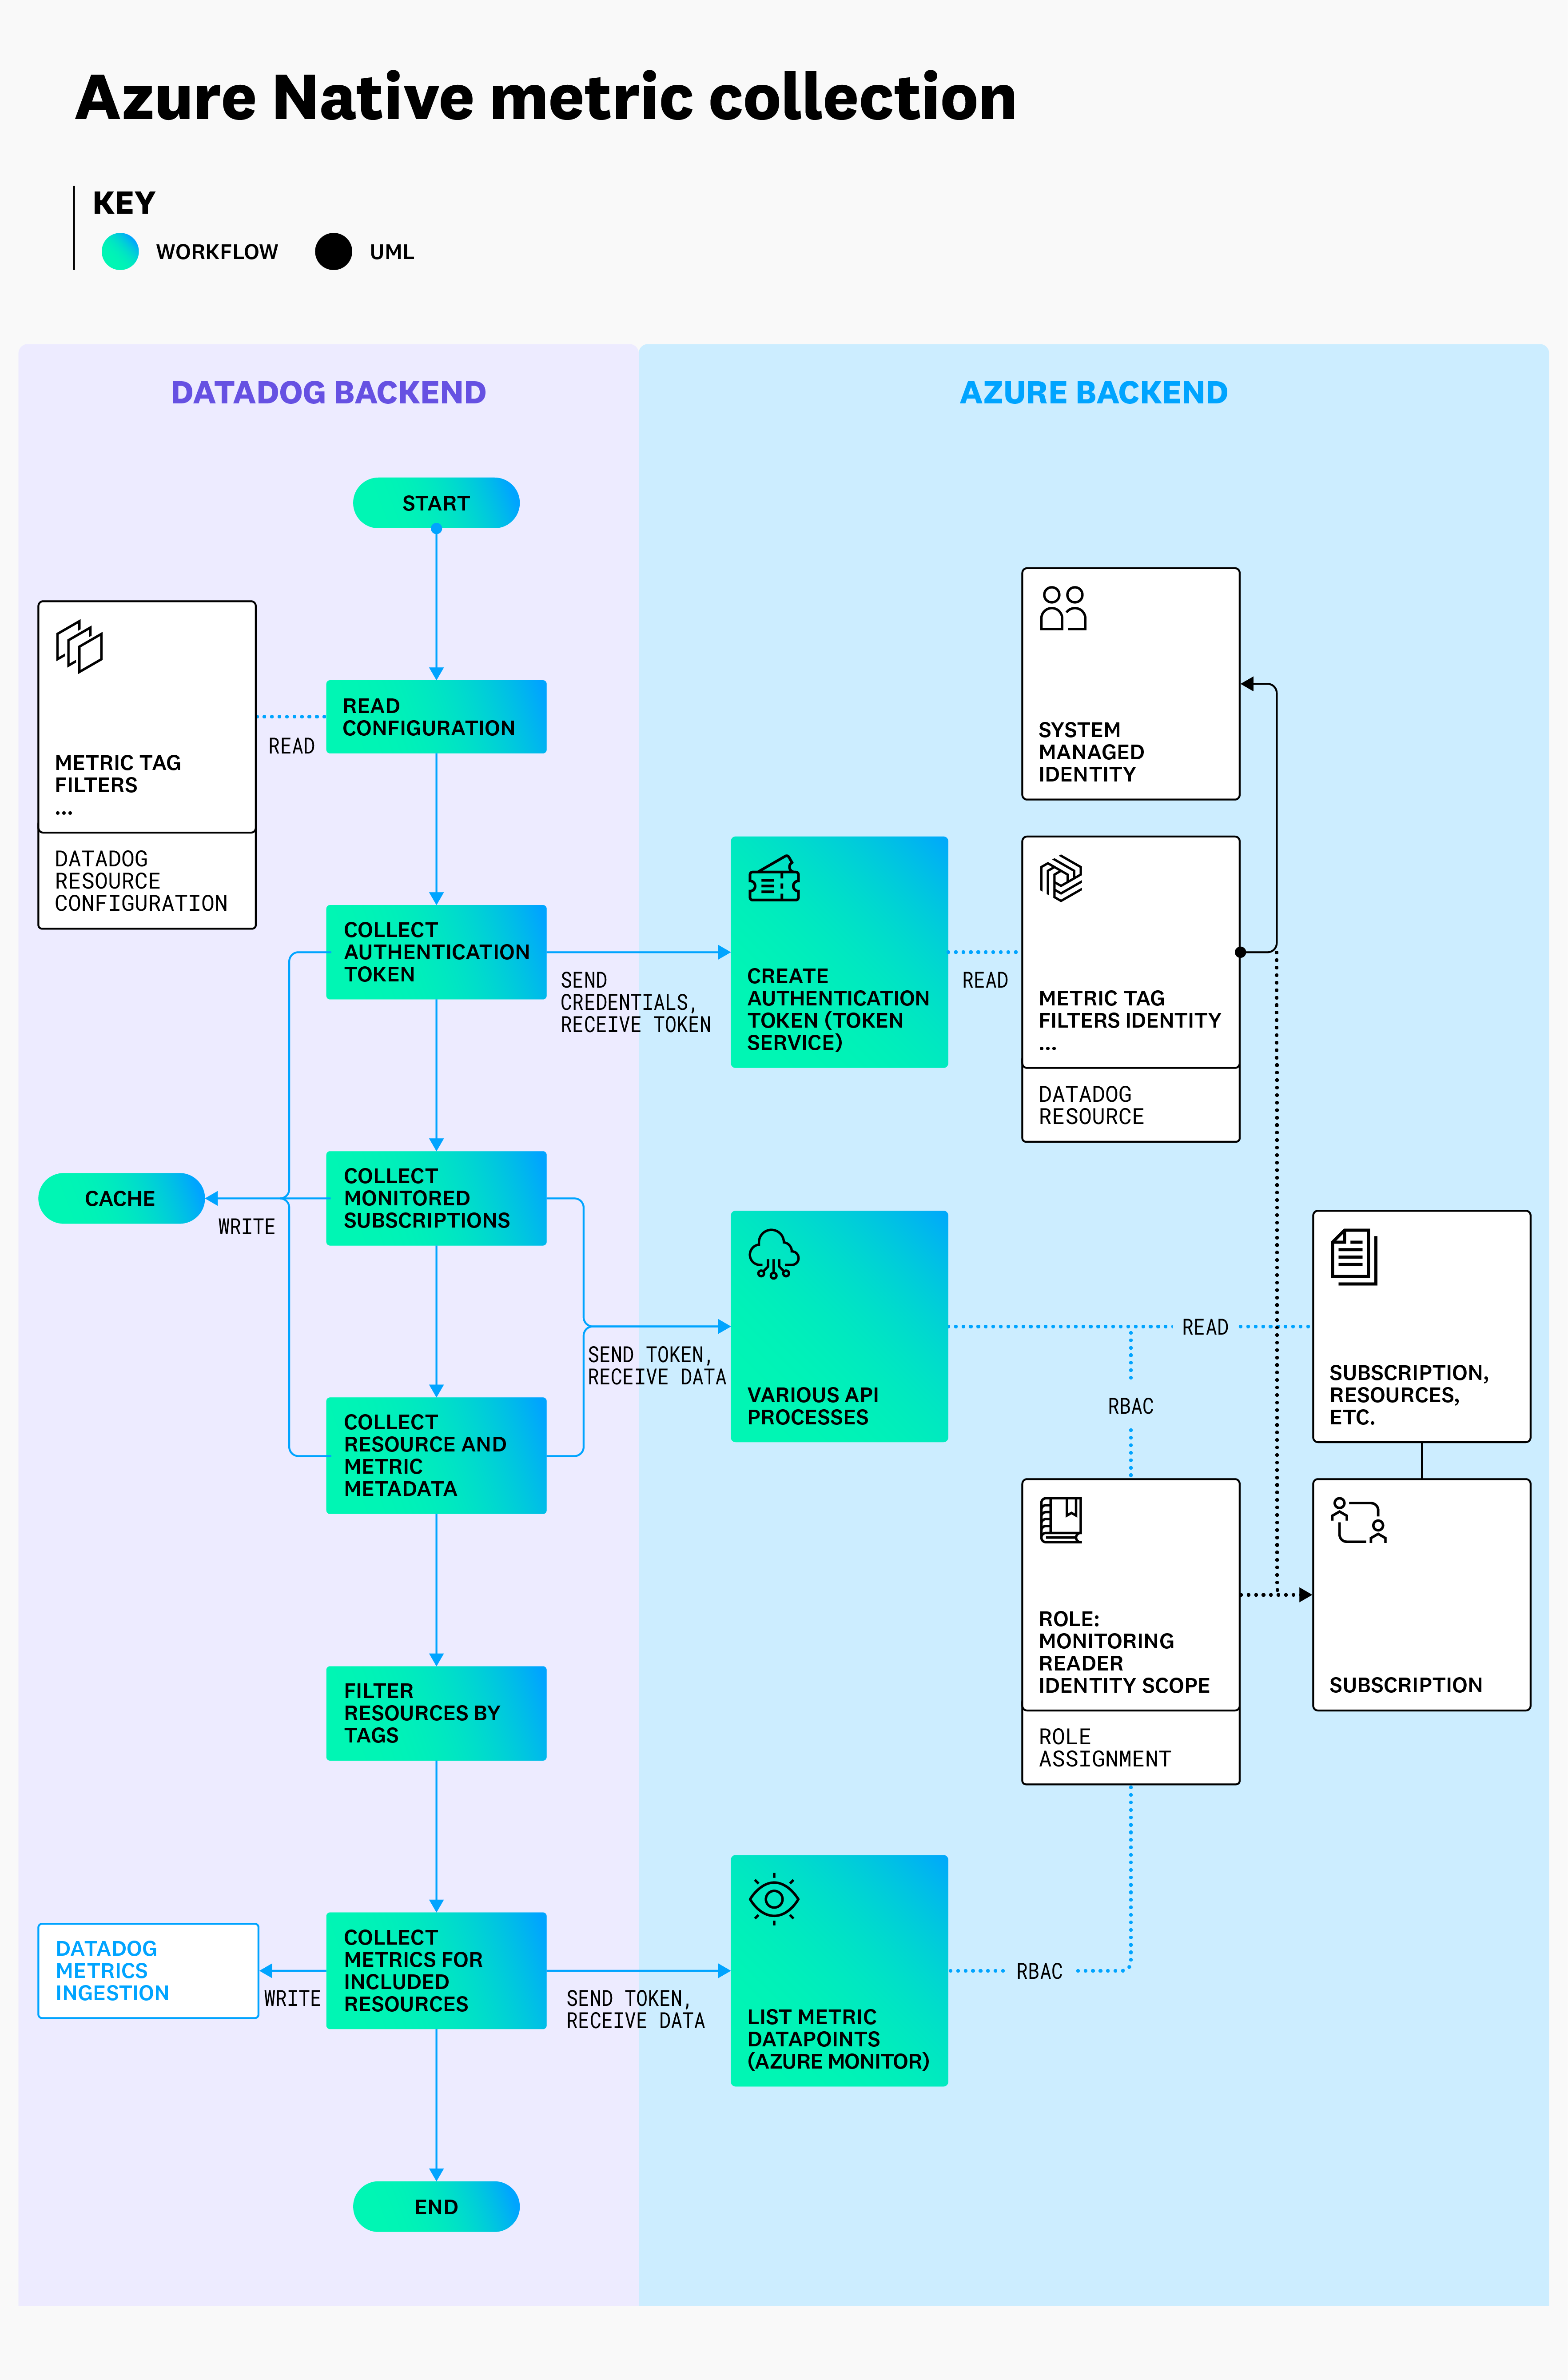
Once this is completed, data collection begins automatically. Datadog continuously discovers and collects metrics from your Azure environment, as pictured below.
Alternate configuration options for metric collection
Whether you use the standard or the Azure Native integration, Datadog strongly recommends using the default configuration. This is because the integration is continually enhanced to provide new and differentiated insights, as well as improved performance and reliability of data collection. These improvements can be inhibited by more restrictive configurations for metric collection.
Options for restricting access
The following sections detail options for restricting access and their implications.
1. Assigning access below subscription level
You can assign Datadog access below the subscription level:
- By resource group
- By individual resource
Note: This access is managed through the App Registration for the standard Azure integration, and through the System Managed Identity associated with the Datadog resource for the Azure Native integration.
If you update the scope of the access below subscription level, Datadog is still able to discover resources and their available metrics, and ingest them dynamically within the given scope.
Restricting Datadog’s access to below the subscription level does the following:
- Inhibits the ability to batch metric calls, which leads to delays beyond the typical one to two minutes before they populate in Datadog. Restricting by individual resource has a greater impact than restricting by resource group. The actual delay is heavily dependent on the size, composition, and distribution of your Azure environment; there may be no noticeable effect in some cases, or latency of up to 45 minutes in others.
- Increases Azure API calls, which may result in higher costs within Azure.
- Limits autodiscovery of resources.
- Requires manual updating of the role assignment’s scope for any new resources, resource groups, or subscriptions to be monitored.
2.Assigning more restrictive role(s) than Monitoring Reader
The Monitoring Reader role provides broad access to monitor resources and subscription-level data. This read-only access enables Datadog to provide the best user experience for both existing features and new capabilities. Azure AD roles allow the extension of this access into tenant-level Azure AD resources.
The implications of restricting access below the Monitoring Reader role are:
- Partial or total loss of monitoring data
- Partial or total loss of metadata in the form of tags on your resource metrics
- Partial or total loss of data for Cloud Security Management Misconfigurations (CSM Misconfigurations) or Resource Catalog
- Partial or total loss of Datadog-generated metrics
The implications of restricting or omitting the Azure AD roles are:
- Partial or total loss of metadata for Azure AD resources in CSM Misconfigurations
- Partial or total loss of credential expiration monitoring for Azure AD resources
Azure log collection
Standard Azure integration log collection
Available in all Datadog Sites
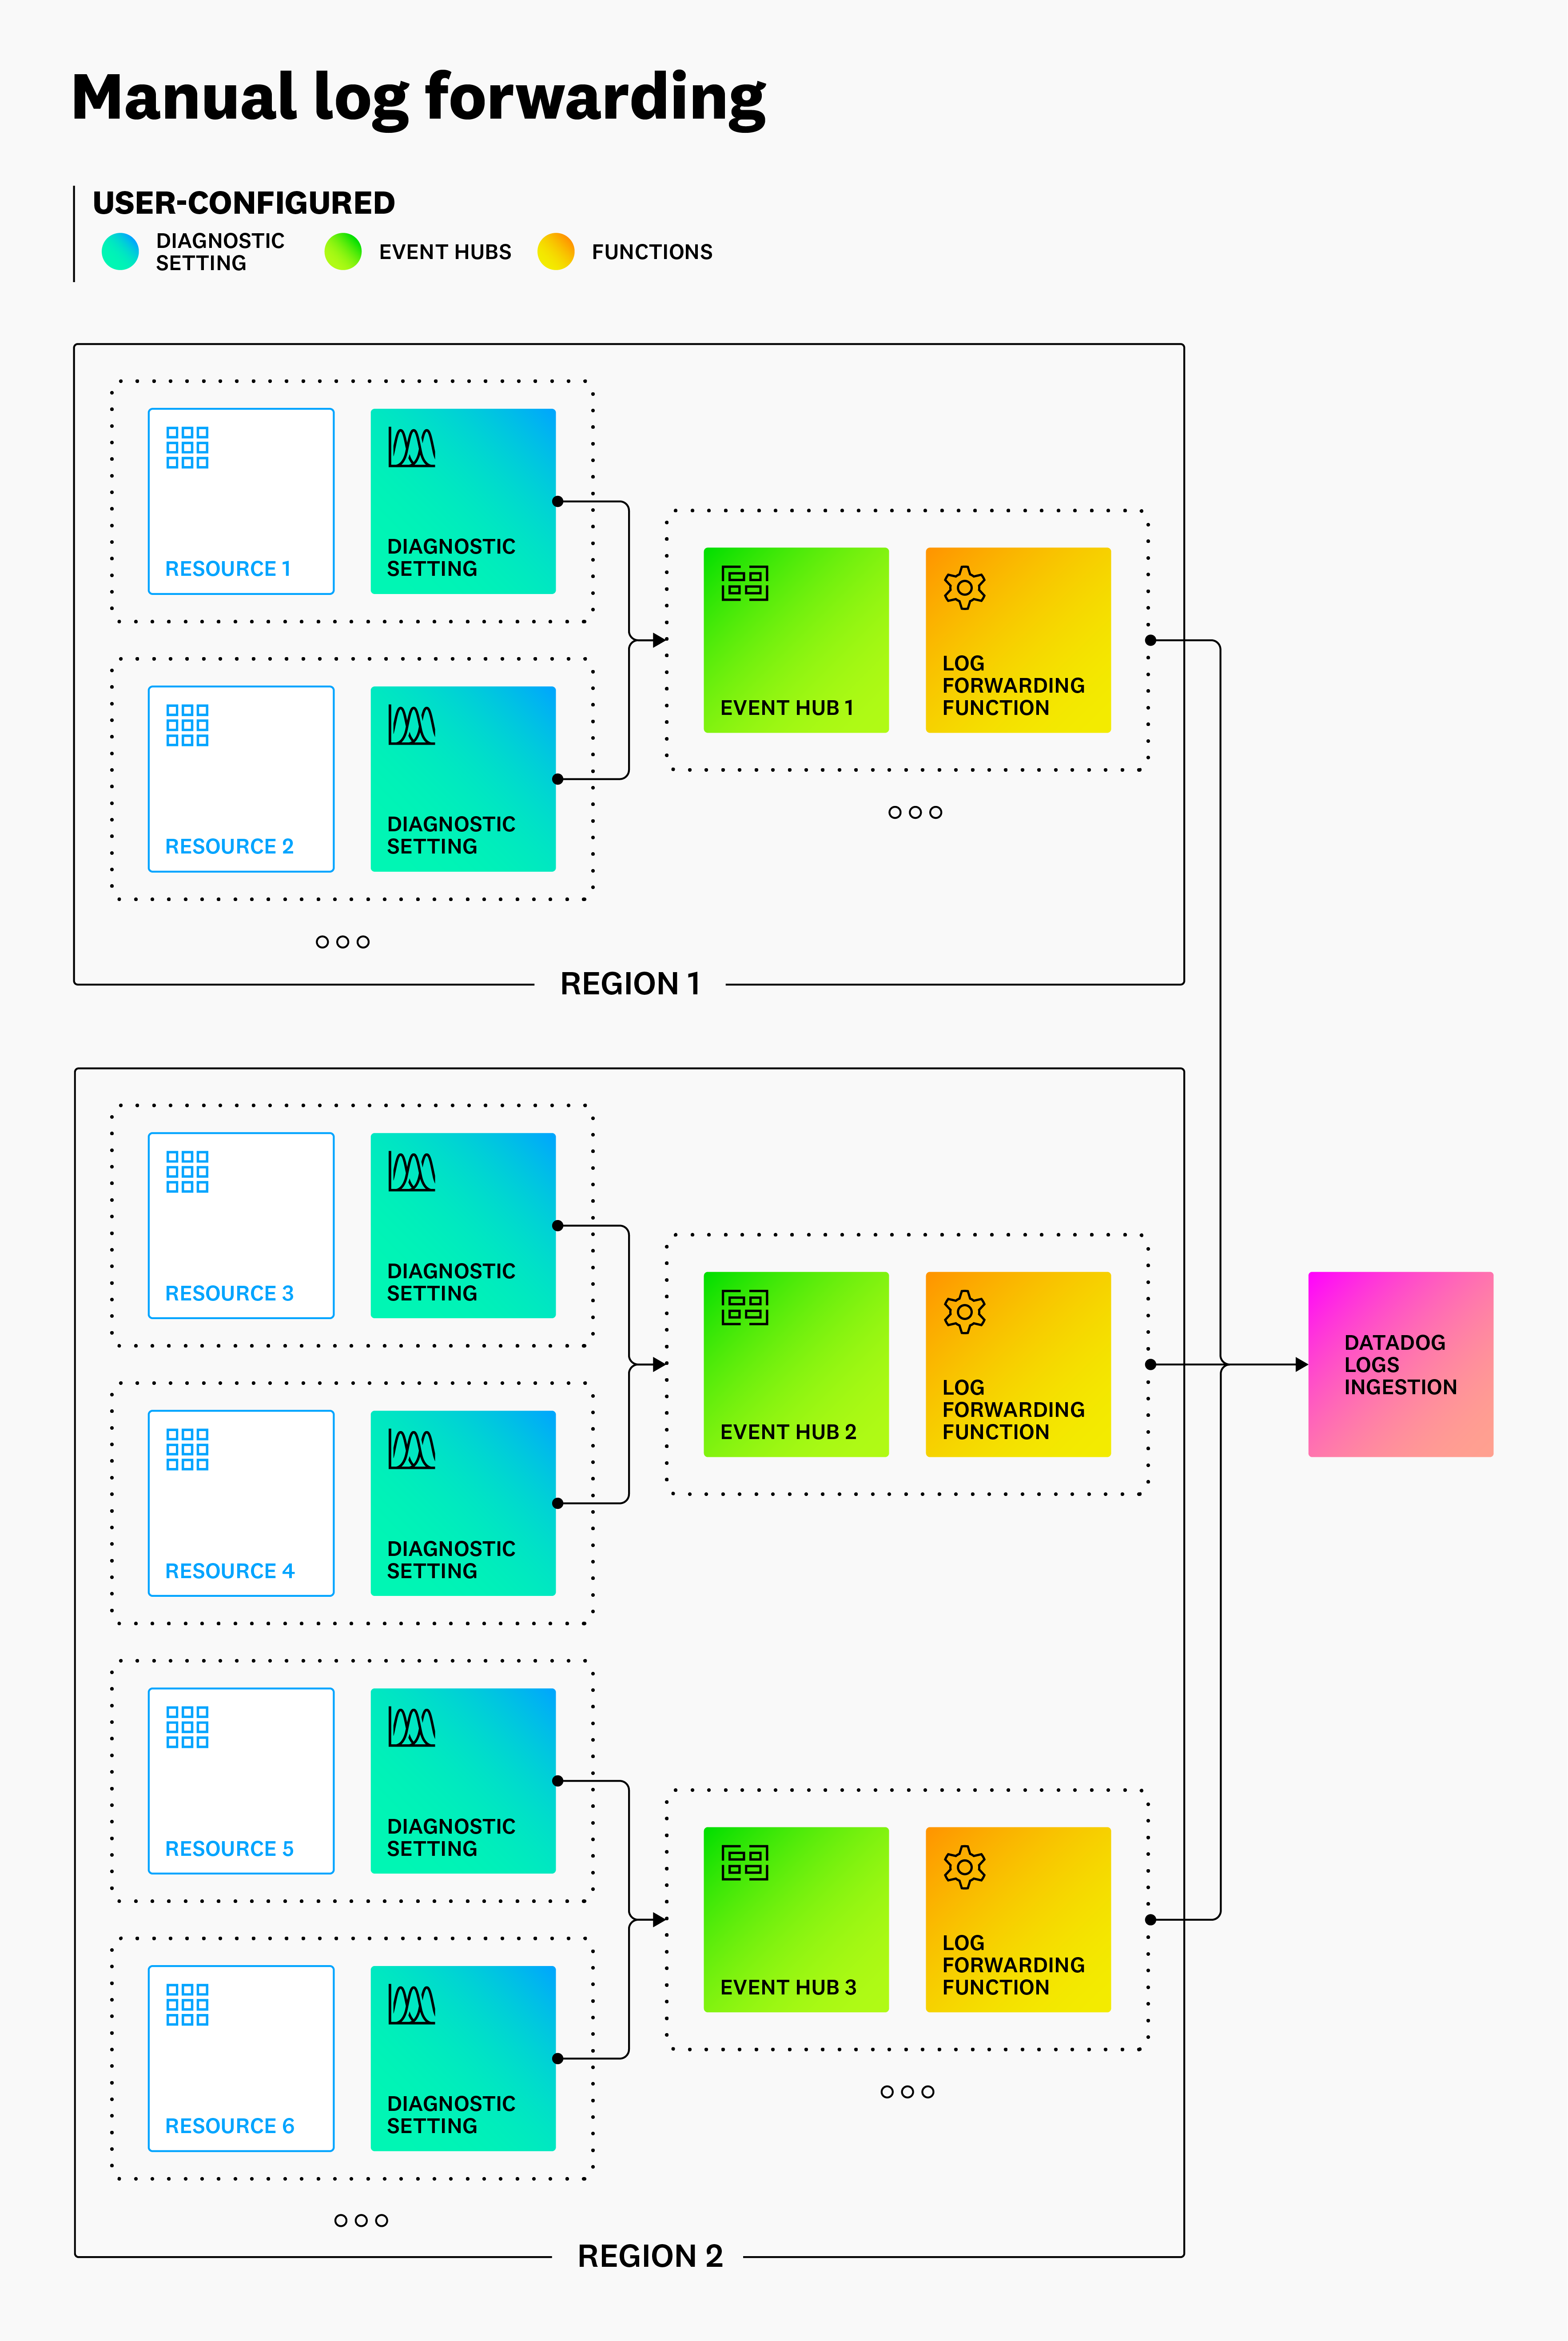
The diagram below provides a reference architecture for forwarding logs from Azure to Datadog, as described in the log collection section of the Azure integration page.
Alternate configuration options for log forwarding with the standard Azure integration
The default architecture above is suitable for most users. Depending on the scale and composition of your Azure environment, as well as the methods your organization uses to implement this architecture, the sections below detail additional considerations that may be relevant.
Using the provided templates
The Deploy to Azure button in the main Azure log collection section provides a template for creating an Event Hub and forwarder function pair. In addition to using this template to deploy directly, you can use the underlying ARM templates as a starting point for your own infrastructure as code deployments.
These templates do not add diagnostic settings, apart from one optional diagnostic setting for activity logs. For resource logs, Datadog recommends utilizing ARM templates or Terraform to add diagnostic settings to your resources programmatically. These diagnostic settings must be added to every resource that needs to send resource logs to Datadog.
Region considerations
Diagnostic settings can only send resource logs to Event Hubs in the same region as the resource. Add an Event Hub and forwarder function pair in each region that contains resources for which you want to send resource logs to Datadog.
However, diagnostic settings are not limited to sending logs to Event Hubs in the same subscription as the resource. If you have multiple subscriptions within your Azure tenant, they can share a single Event Hub and forwarder function within the same region.
High-volume log considerations
As the volume of logs scales, you may see bottlenecks, typically arising in the Event Hubs. If you plan to submit high log volumes, you may want to consider adding additional partitions or using a Premium or Dedicated tier. For especially high log volumes, you may consider adding additional Event Hub and forwarder function pairs within the same region, and splitting traffic between them.
Azure Native integration log collection
Available only in the Datadog US3 site
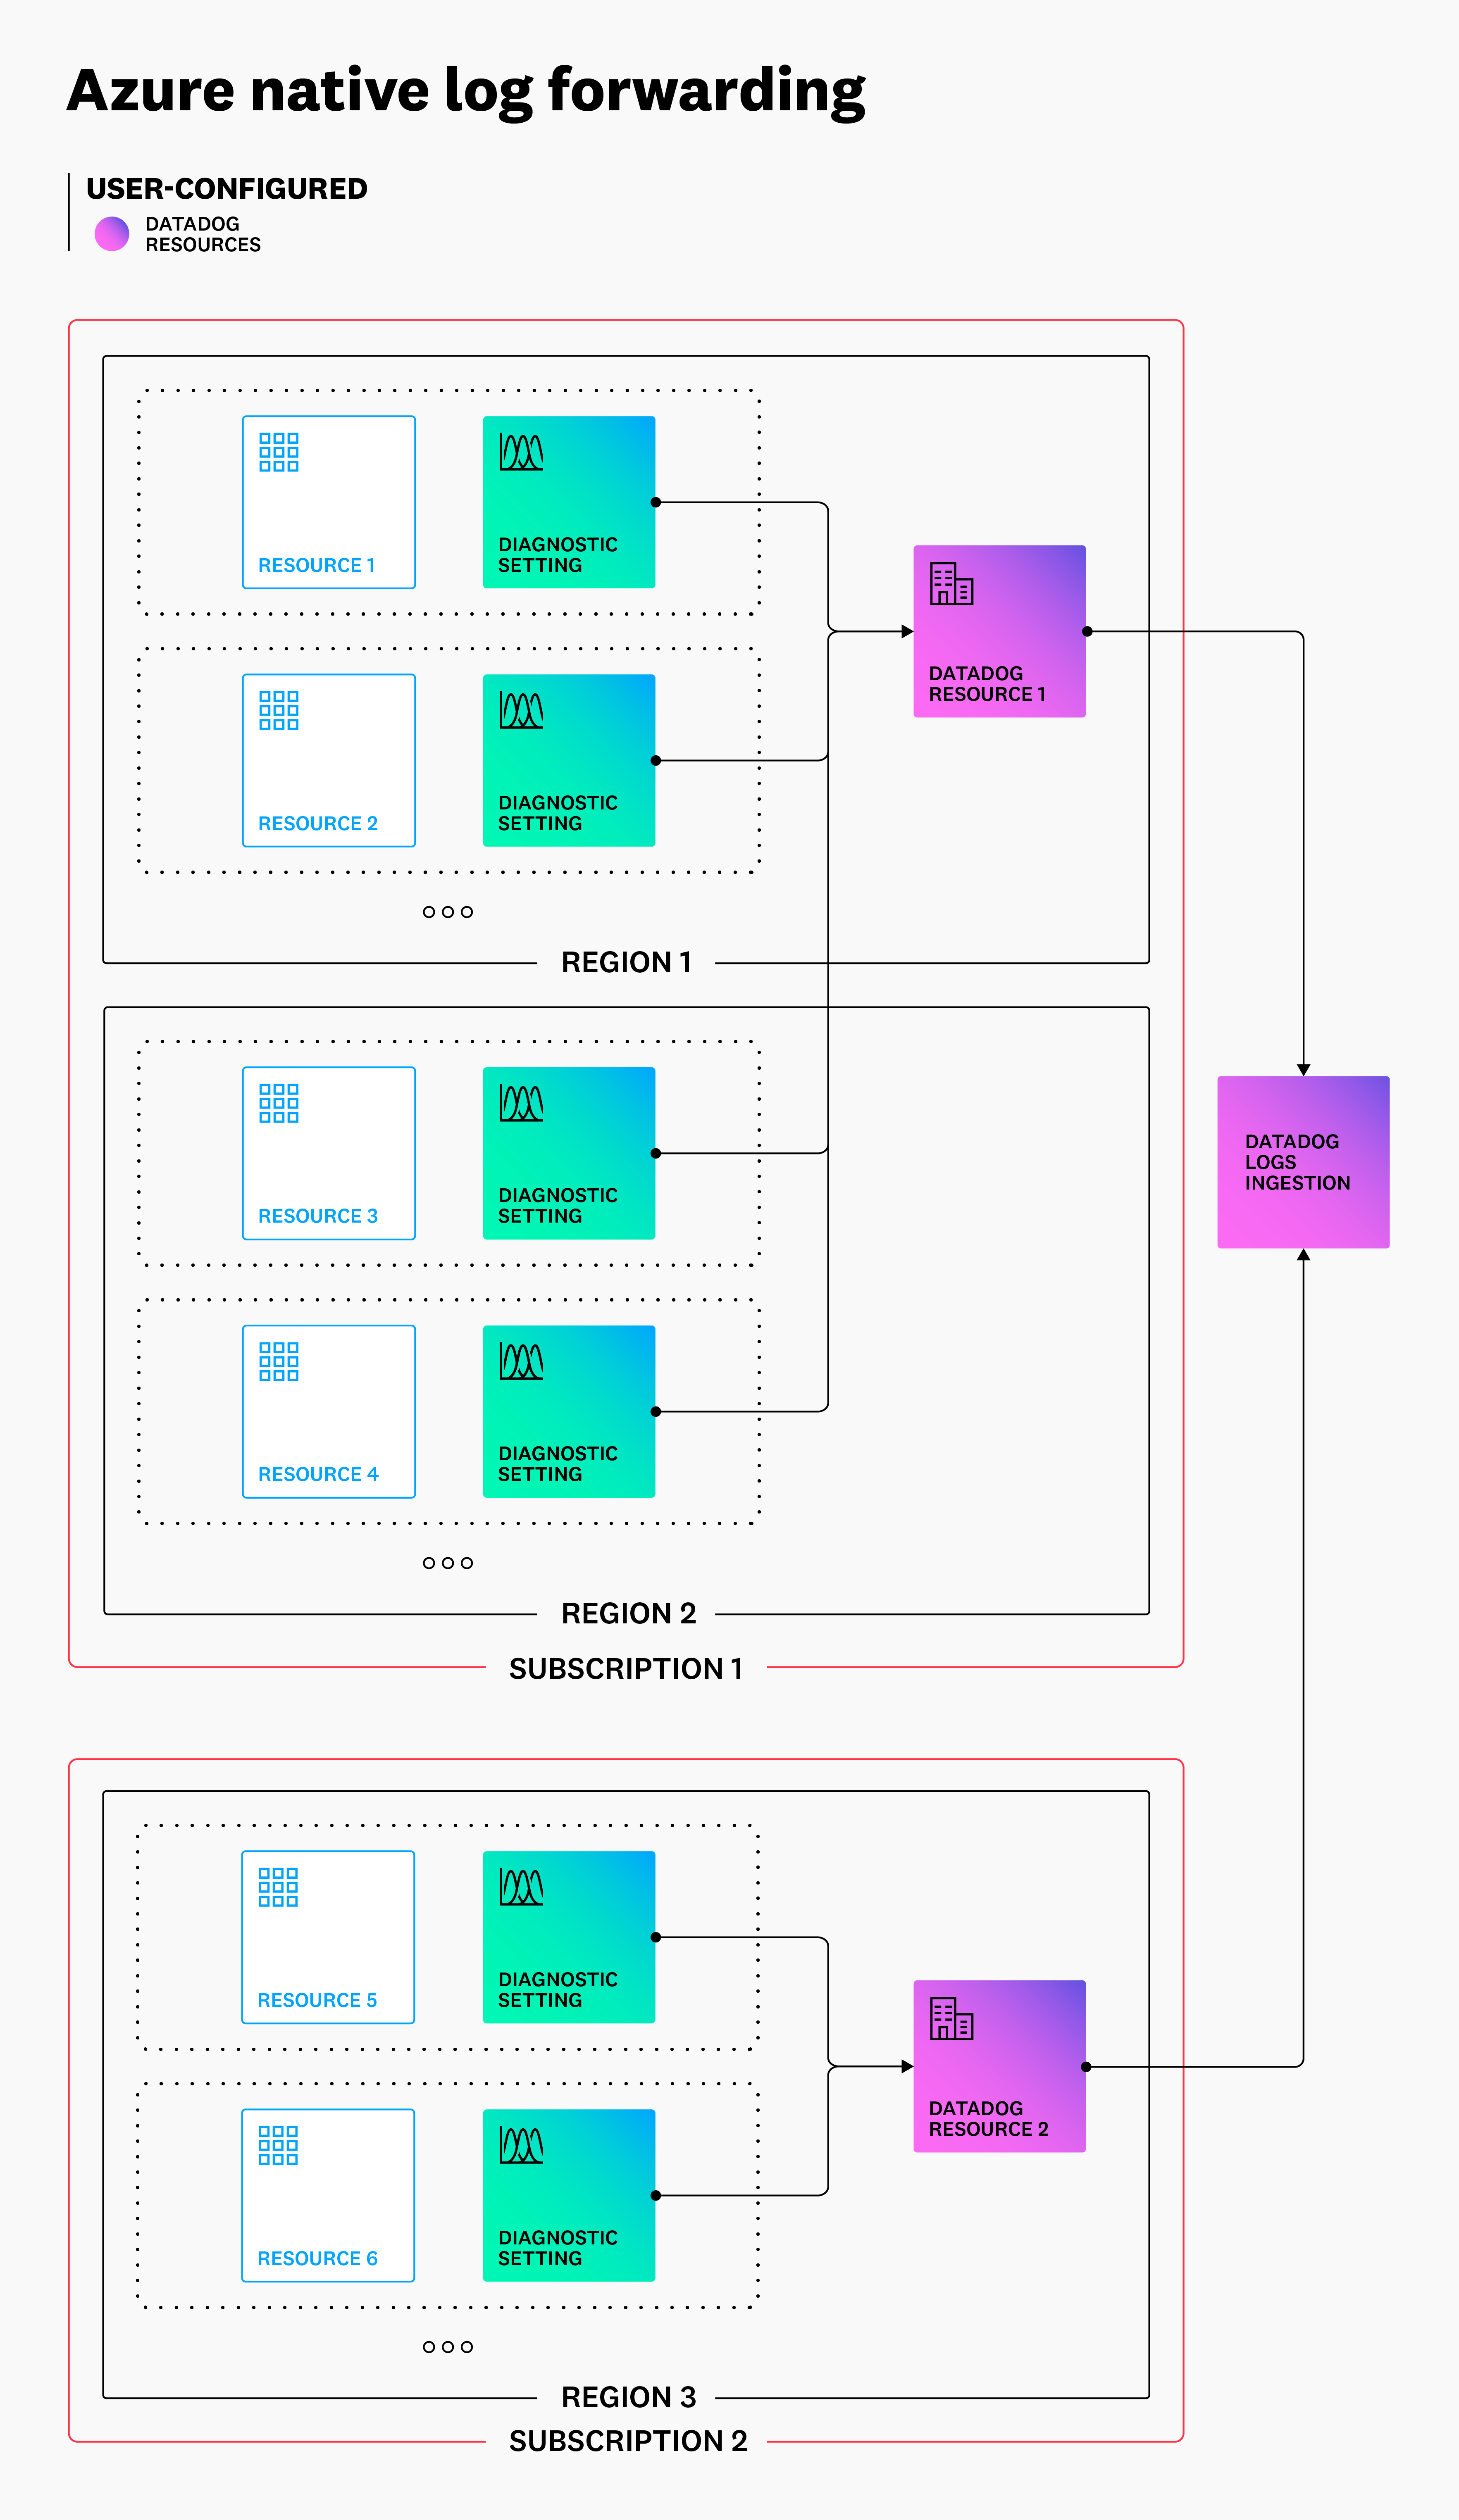
The diagram below outlines the process and resulting architecture of the Azure Native integration log forwarding configuration.
With the Azure Native integration, you do not need to configure anything outside of the Datadog resource to implement Azure resource or activity log forwarding to Datadog. Diagnostic settings are added or removed automatically to match your configuration using only the tag rules specified in the Datadog resource.
Note: You can enable resource logs without any filters to send all resource logs, as shown below.
Diagnostic settings created by the Datadog resource include all log categories, are configured with Send to Partner Solution, and send logs back to the originating Datadog resource. They follow the naming format DATADOG_DS_V2_<UNIQUE_IDENTIFIER>.
Any manual changes to the resource, including deleting it, are reverted within a few minutes.
See below an example of a diagnostic setting created by a Datadog resource:
Alternate configuration options for log forwarding with the Azure Native integration
The one-click buttons to enable logs in the Datadog resource automate the process of adding diagnostic settings. In some cases, organizations may want to manage and configure diagnostic settings themselves, while still taking advantage of the automated log forwarding capability with the Azure Native integration.
Manually created diagnostic settings are not impacted by log settings on the Datadog resource, and are not deleted based on the tag rules specified in the Datadog resource. Resource logs do not have to be enabled on the Datadog resource in order for manual log forwarding to work. However, the Datadog resource being used for log forwarding must not be in a disabled state.
Reasons for manually managing diagnostic settings include:
Infrastructure as code policies Strict internal policies around IaC that require all resources to to be created and managed deterministically (for example, if automatic creation of diagnostic settings by the Datadog resource would cause an unresolvable conflict between the desired and the actual state).
Limiting resource log categories As the diagnostic settings created automatically by the Datadog resource include all log categories, specifying a subset of these categories requires you to create diagnostic settings yourself.
Note: You can also use exclusion filters to exclude these logs from being indexed upon ingestion into Datadog.Cross-subscription log forwarding Cross-subscription log forwarding is useful for sending logs and no other data from a specific subscription. To enable cross-subscription log forwarding, register the
Microsoft.Datadogresource provider in each subscription intended to send logs before creating the diagnostic settings. The Datadog resource used for log forwarding still collects metrics and data from its own subscription and any subscriptions configured through the Monitored resources blade.<div class="shortcode-wrapper shortcode-img expand"><figure class="text-center"><a href="https://datadog-docs-staging.imgix.net/images/integrations/guide/azure_architecture_and_configuration/datadog_agent_build_resource_providers.14f671680020444d594d9adf62bc9885.png?fit=max&auto=format" class="pop" data-bs-toggle="modal" data-bs-target="#popupImageModal"><picture class="" > <img class="img-fluid" srcset="https://datadog-docs-staging.imgix.net/images/integrations/guide/azure_architecture_and_configuration/datadog_agent_build_resource_providers.14f671680020444d594d9adf62bc9885.png?auto=format" alt="Screenshot of the resource providers page in the Azure Portal with Microsoft. Datadog showing the status of registered." /> </picture></a></figure> </div>Testing Sending example logs to Datadog can be useful for testing or other investigations. In these cases, adding diagnostic settings manually can be quicker than waiting for them to be created automatically from updated tags and settings.
This architecture is shown below, including the optional cross-subscription set up:
Additional helpful documentation, links, and articles:
