- 重要な情報
- はじめに
- Datadog
- Datadog サイト
- DevSecOps
- AWS Lambda のサーバーレス
- エージェント
- インテグレーション
- コンテナ
- ダッシュボード
- アラート設定
- ログ管理
- トレーシング
- プロファイラー
- タグ
- API
- Service Catalog
- Session Replay
- Continuous Testing
- Synthetic モニタリング
- Incident Management
- Database Monitoring
- Cloud Security Management
- Cloud SIEM
- Application Security Management
- Workflow Automation
- CI Visibility
- Test Visibility
- Intelligent Test Runner
- Code Analysis
- Learning Center
- Support
- 用語集
- Standard Attributes
- ガイド
- インテグレーション
- エージェント
- OpenTelemetry
- 開発者
- 認可
- DogStatsD
- カスタムチェック
- インテグレーション
- Create an Agent-based Integration
- Create an API Integration
- Create a Log Pipeline
- Integration Assets Reference
- Build a Marketplace Offering
- Create a Tile
- Create an Integration Dashboard
- Create a Recommended Monitor
- Create a Cloud SIEM Detection Rule
- OAuth for Integrations
- Install Agent Integration Developer Tool
- サービスのチェック
- IDE インテグレーション
- コミュニティ
- ガイド
- API
- モバイルアプリケーション
- CoScreen
- Cloudcraft
- アプリ内
- Service Management
- インフラストラクチャー
- アプリケーションパフォーマンス
- APM
- Continuous Profiler
- データベース モニタリング
- Data Streams Monitoring
- Data Jobs Monitoring
- Digital Experience
- Software Delivery
- CI Visibility (CI/CDの可視化)
- CD Visibility
- Test Visibility
- Intelligent Test Runner
- Code Analysis
- Quality Gates
- DORA Metrics
- セキュリティ
- セキュリティの概要
- Cloud SIEM
- クラウド セキュリティ マネジメント
- Application Security Management
- AI Observability
- ログ管理
- Observability Pipelines(観測データの制御)
- ログ管理
- 管理
Getting Started with Test Impact Analysis
このページは日本語には対応しておりません。随時翻訳に取り組んでいます。翻訳に関してご質問やご意見ございましたら、お気軽にご連絡ください。
This feature was formerly known as Intelligent Test Runner, and some tags still contain "itr".
Overview
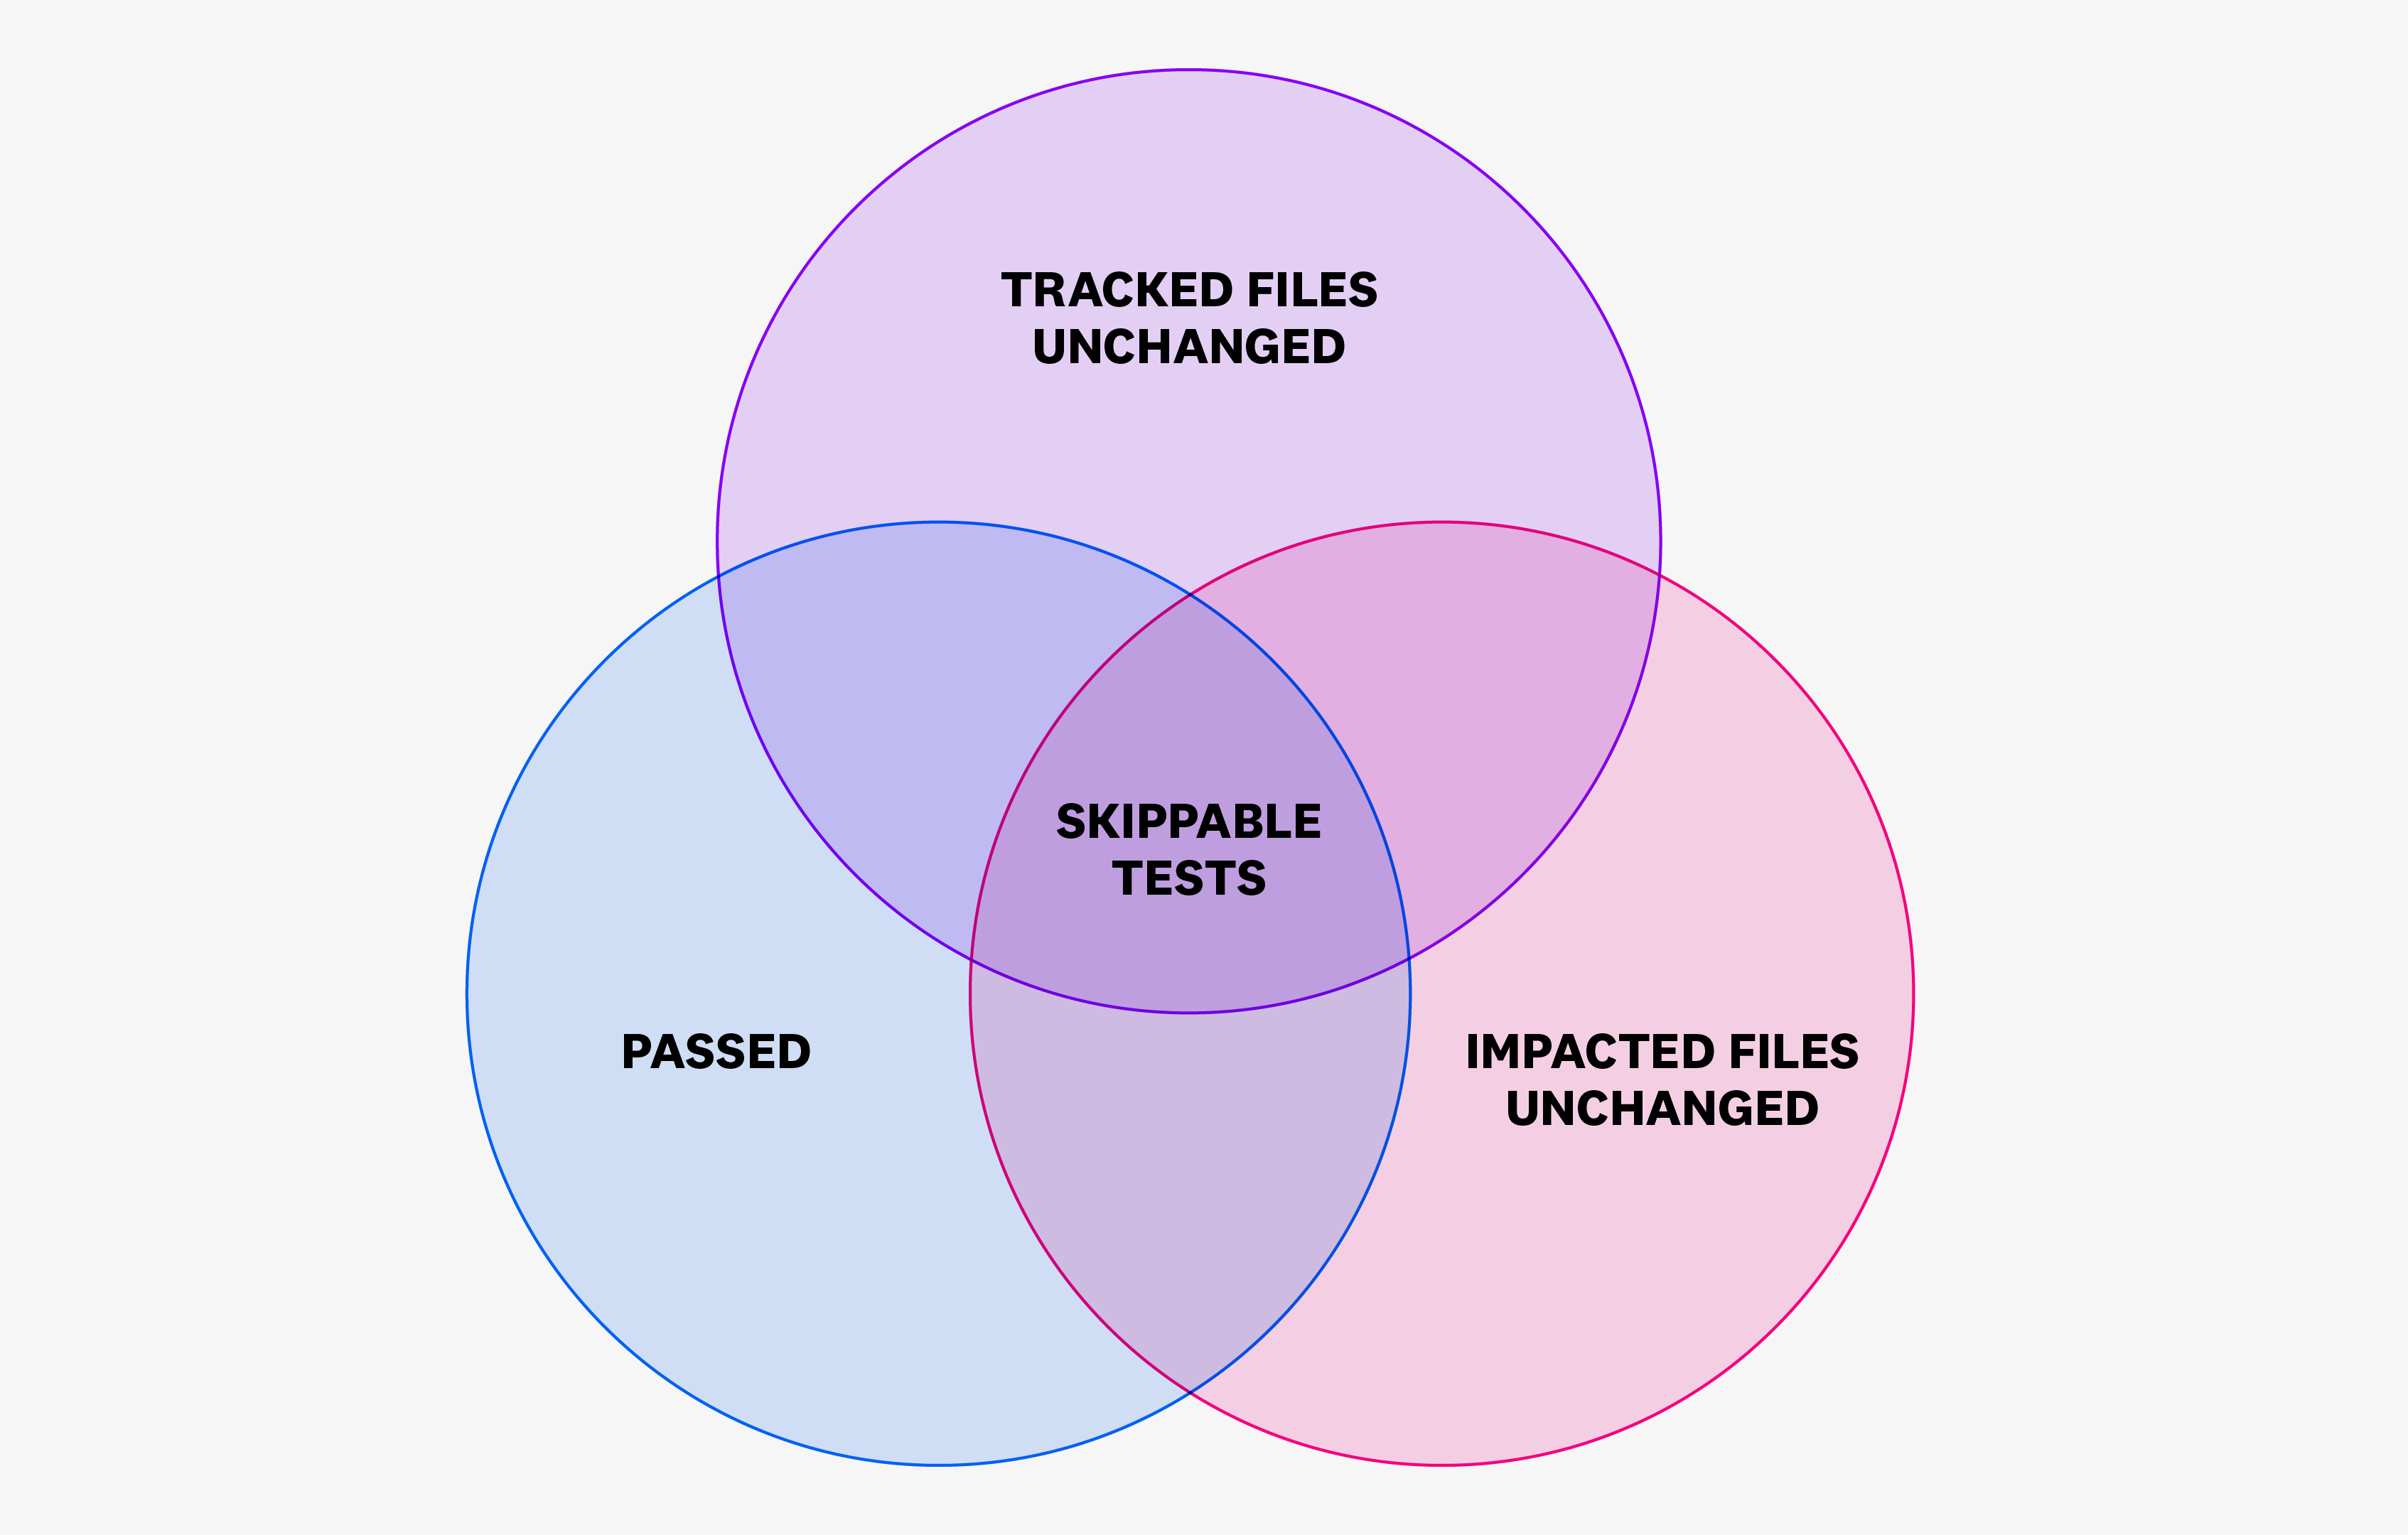
Test Impact Analysis allows you to skip irrelevant tests unaffected by a code change.
With Test Optimization, development teams can configure Test Impact Analysis for their test services, set branches to exclude (such as the default branch), and define files to be tracked (which triggers full runs of all tests when any tracked file changes).
Configure and enable Test Impact Analysis for your test services to reduce unnecessary testing time, enhance CI test efficiency, and reduce costs, while maintaining the reliability and performance across your CI environments.
Test Impact Analysis uses code coverage data to determine whether or not tests should be skipped. For more information, see How Test Impact Analysis Works in Datadog.
Set up Test Impact Analysis
To set up Test Impact Analysis, see the following documentation for your programming language:
Enable Test Impact Analysis
To enable Test Impact Analysis:
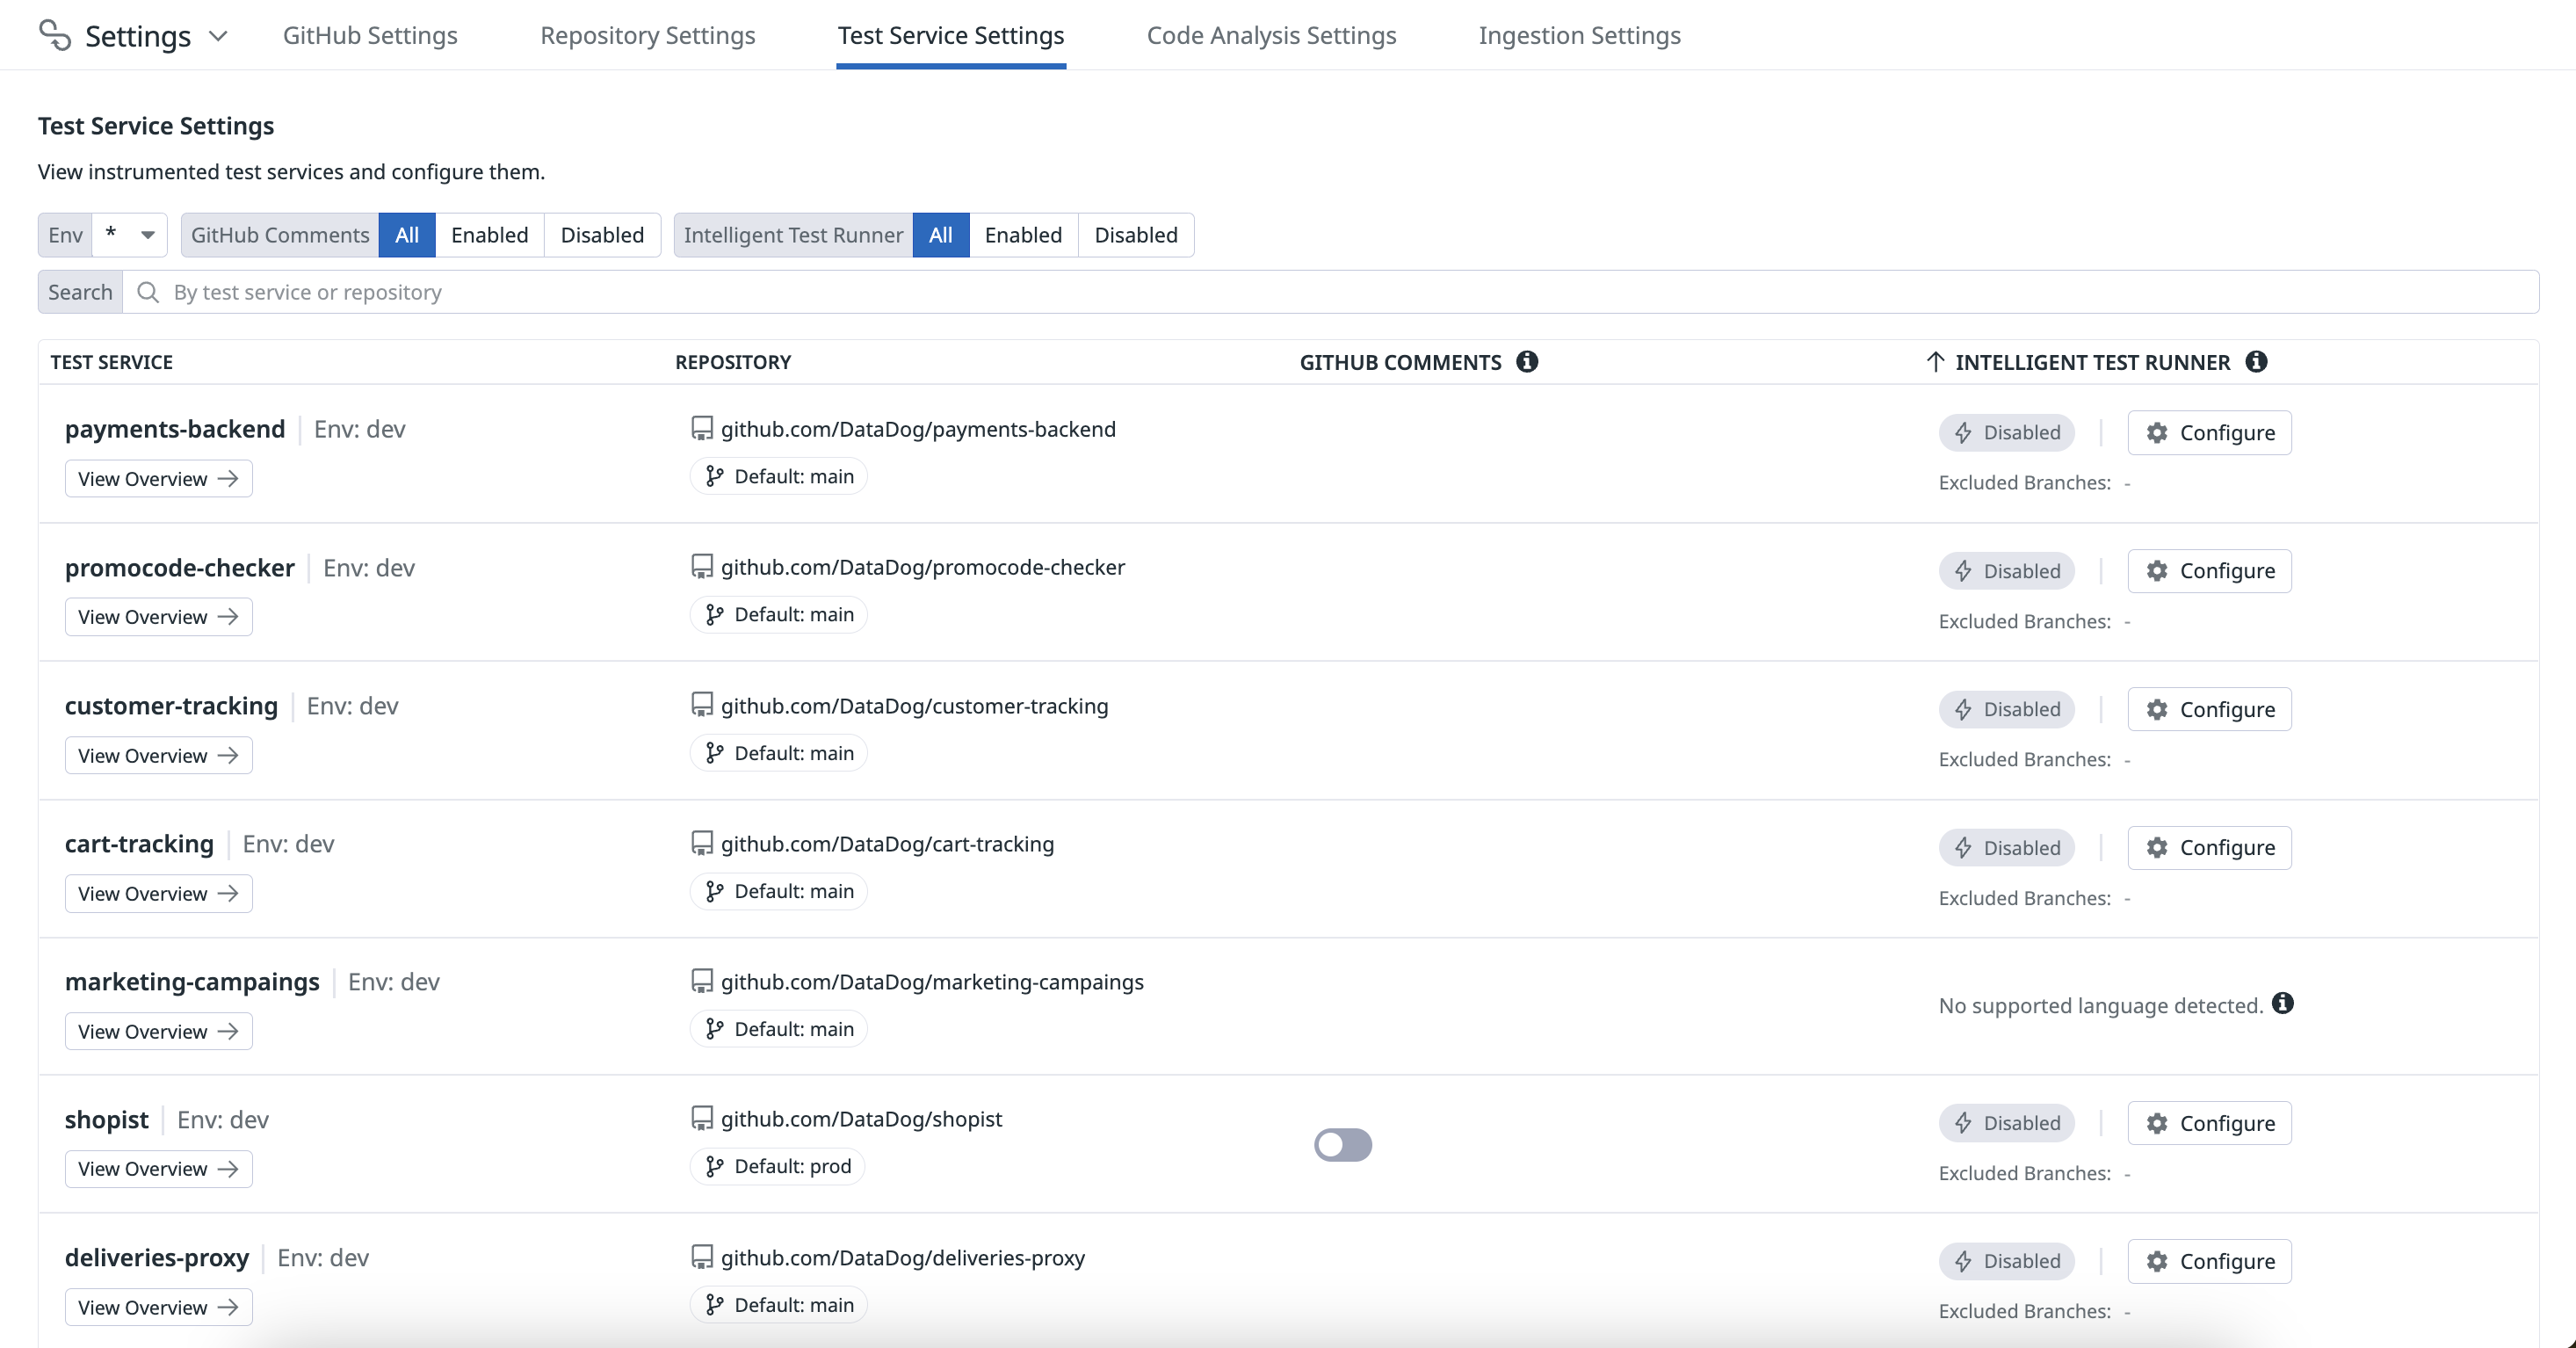
- Navigate to Software Delivery > Test Optimization > Settings.
- On the Test Services tab, click Configure in the
Test Impact Analysiscolumn for a service.
You must have the Test Impact Analysis Activation Write permission. For more information, see the Datadog Role Permissions documentation.
Disabling Test Impact Analysis on critical branches (such as your default branch) ensures comprehensive test coverage, whereas enabling it to run on feature or development branches helps maximize testing efficiency.
Configure Test Impact Analysis
You can configure Test Impact Analysis to prevent specific tests from being skipped. These tests are known as unskippable tests, and are run regardless of code coverage data.
To configure Test Impact Analysis:
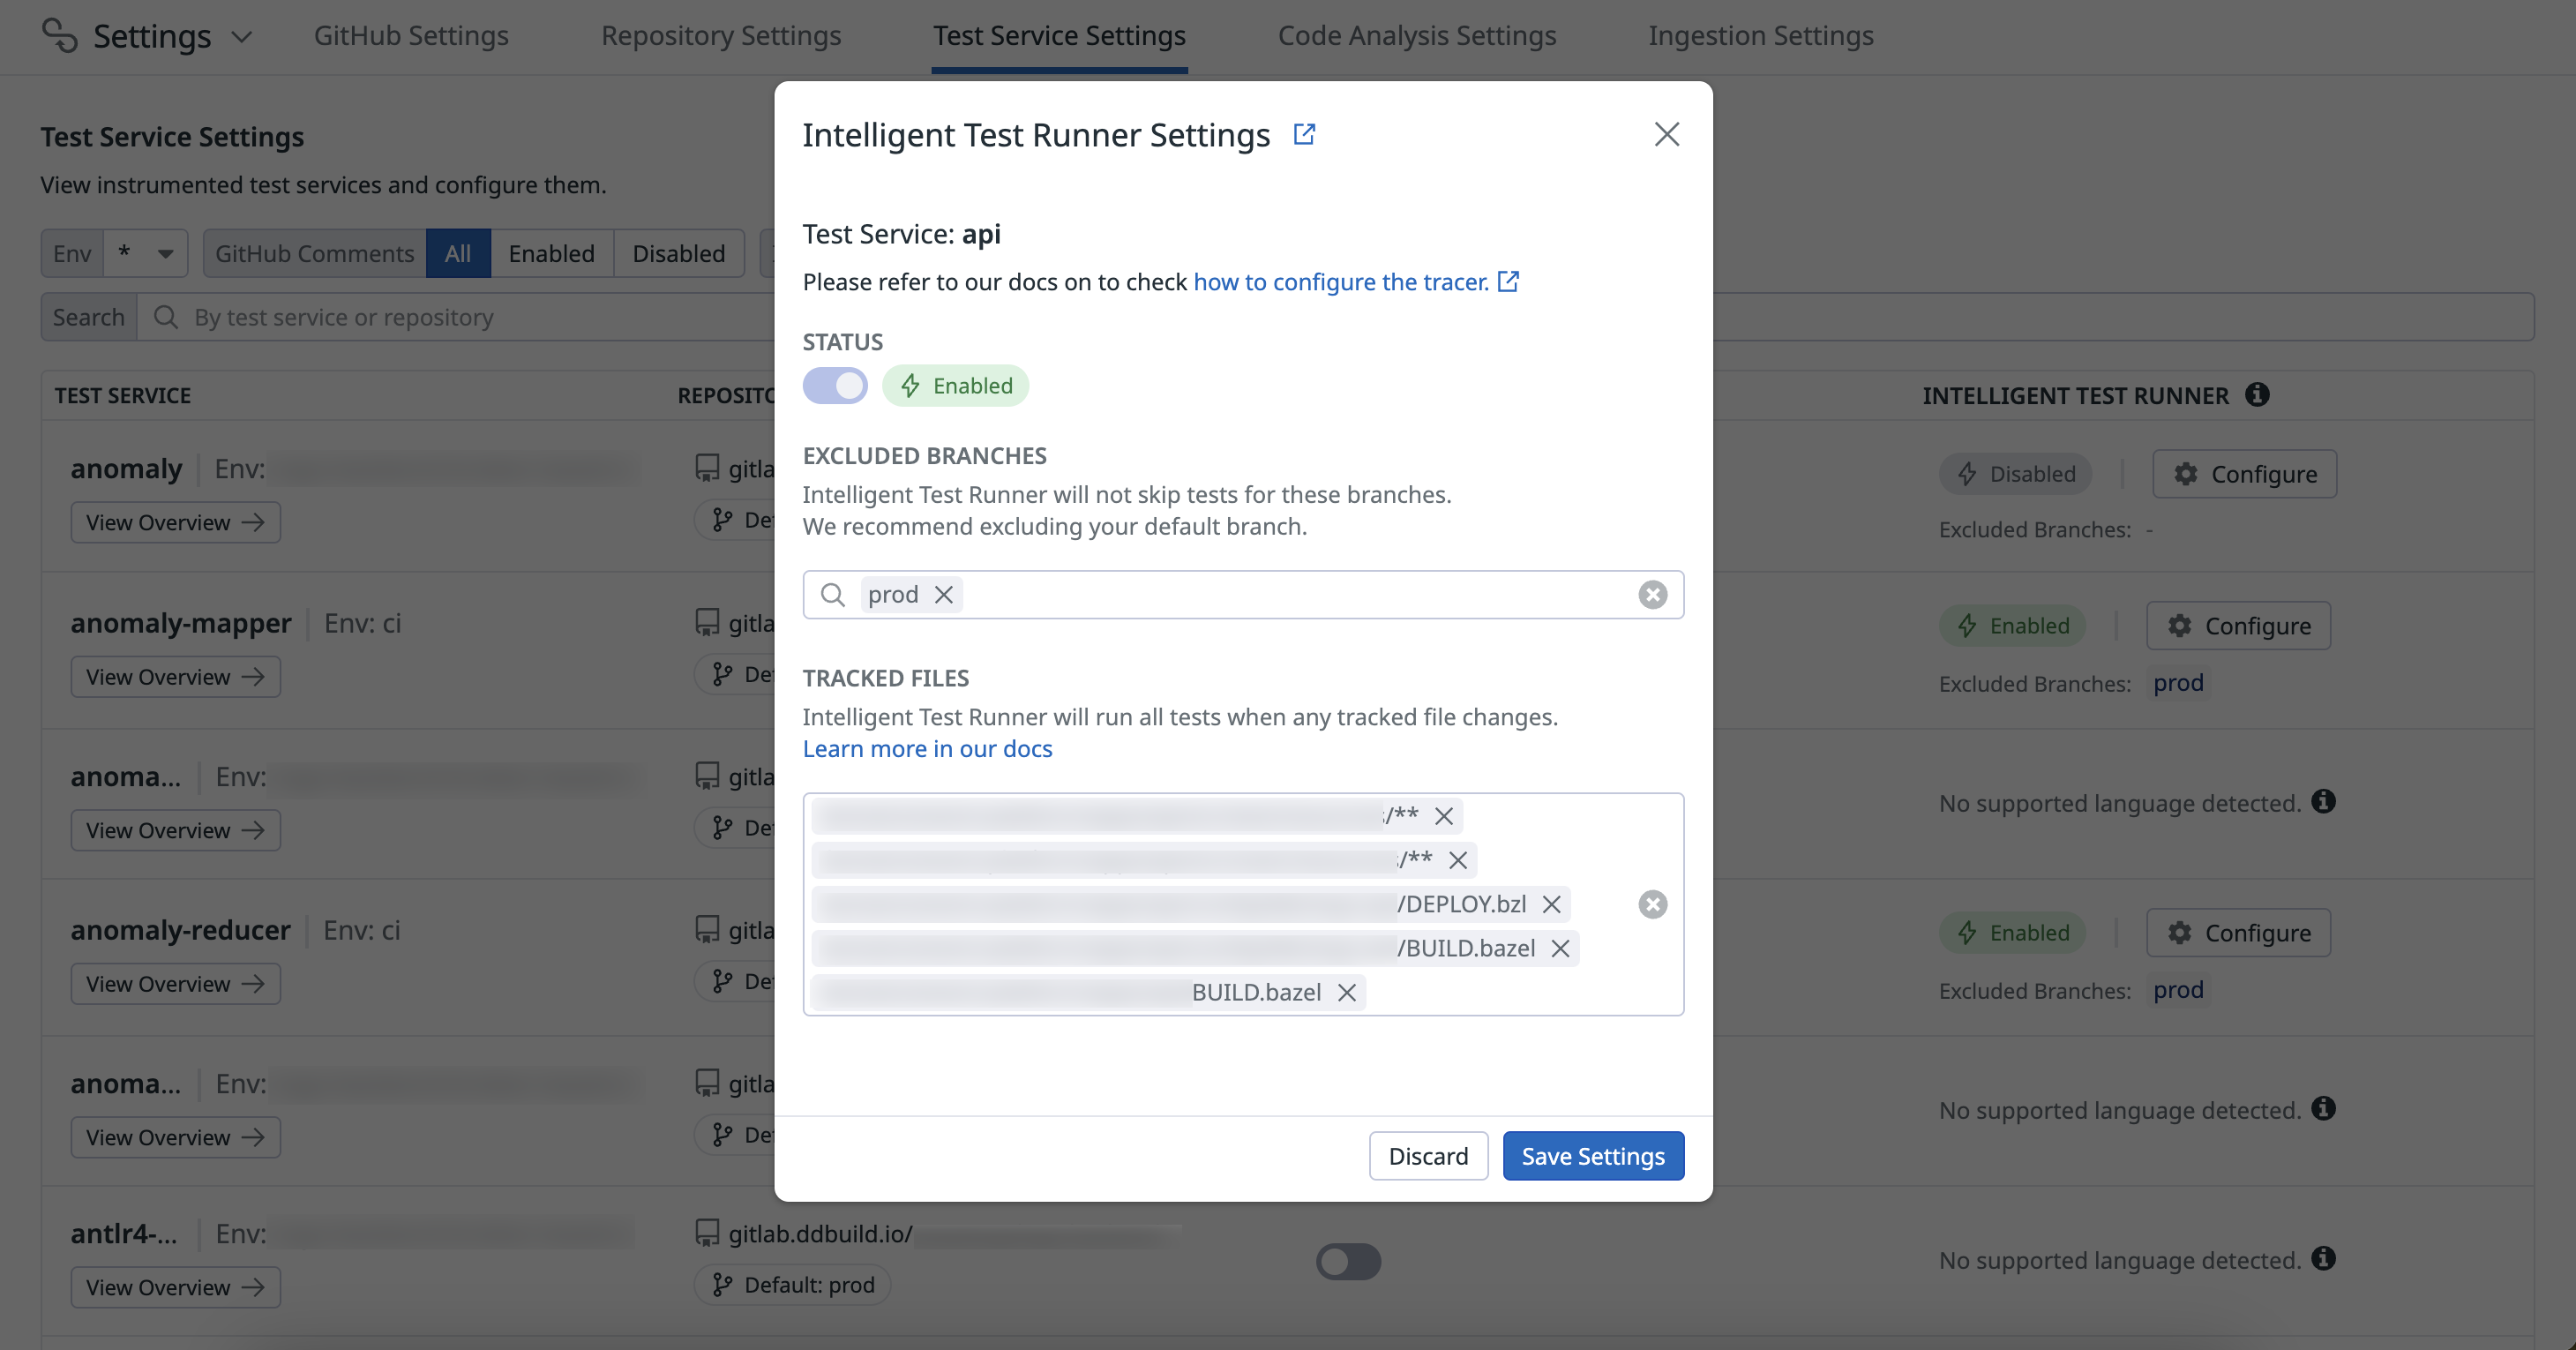
- For the test you want to enable it on, click Configure.
- Click the Status toggle to enable Test Impact Analysis.
- Specify any branches to exclude (typically the default branch of a repository). Test Impact Analysis does not skip tests for these branches.
- Specify file directories and files to track (for example,
documentation/content/**ordomains/shopist/apps/api/BUILD.bazel). Test Impact Analysis runs all CI tests when any of these tracked files change. - Click Save Settings.
Once you’ve configured Test Impact Analysis on a test service, execute a test suite run on your default branch. This establishes a baseline for Test Impact Analysis to accurately skip irrelevant tests in future commits.
Use Test Impact Analysis data
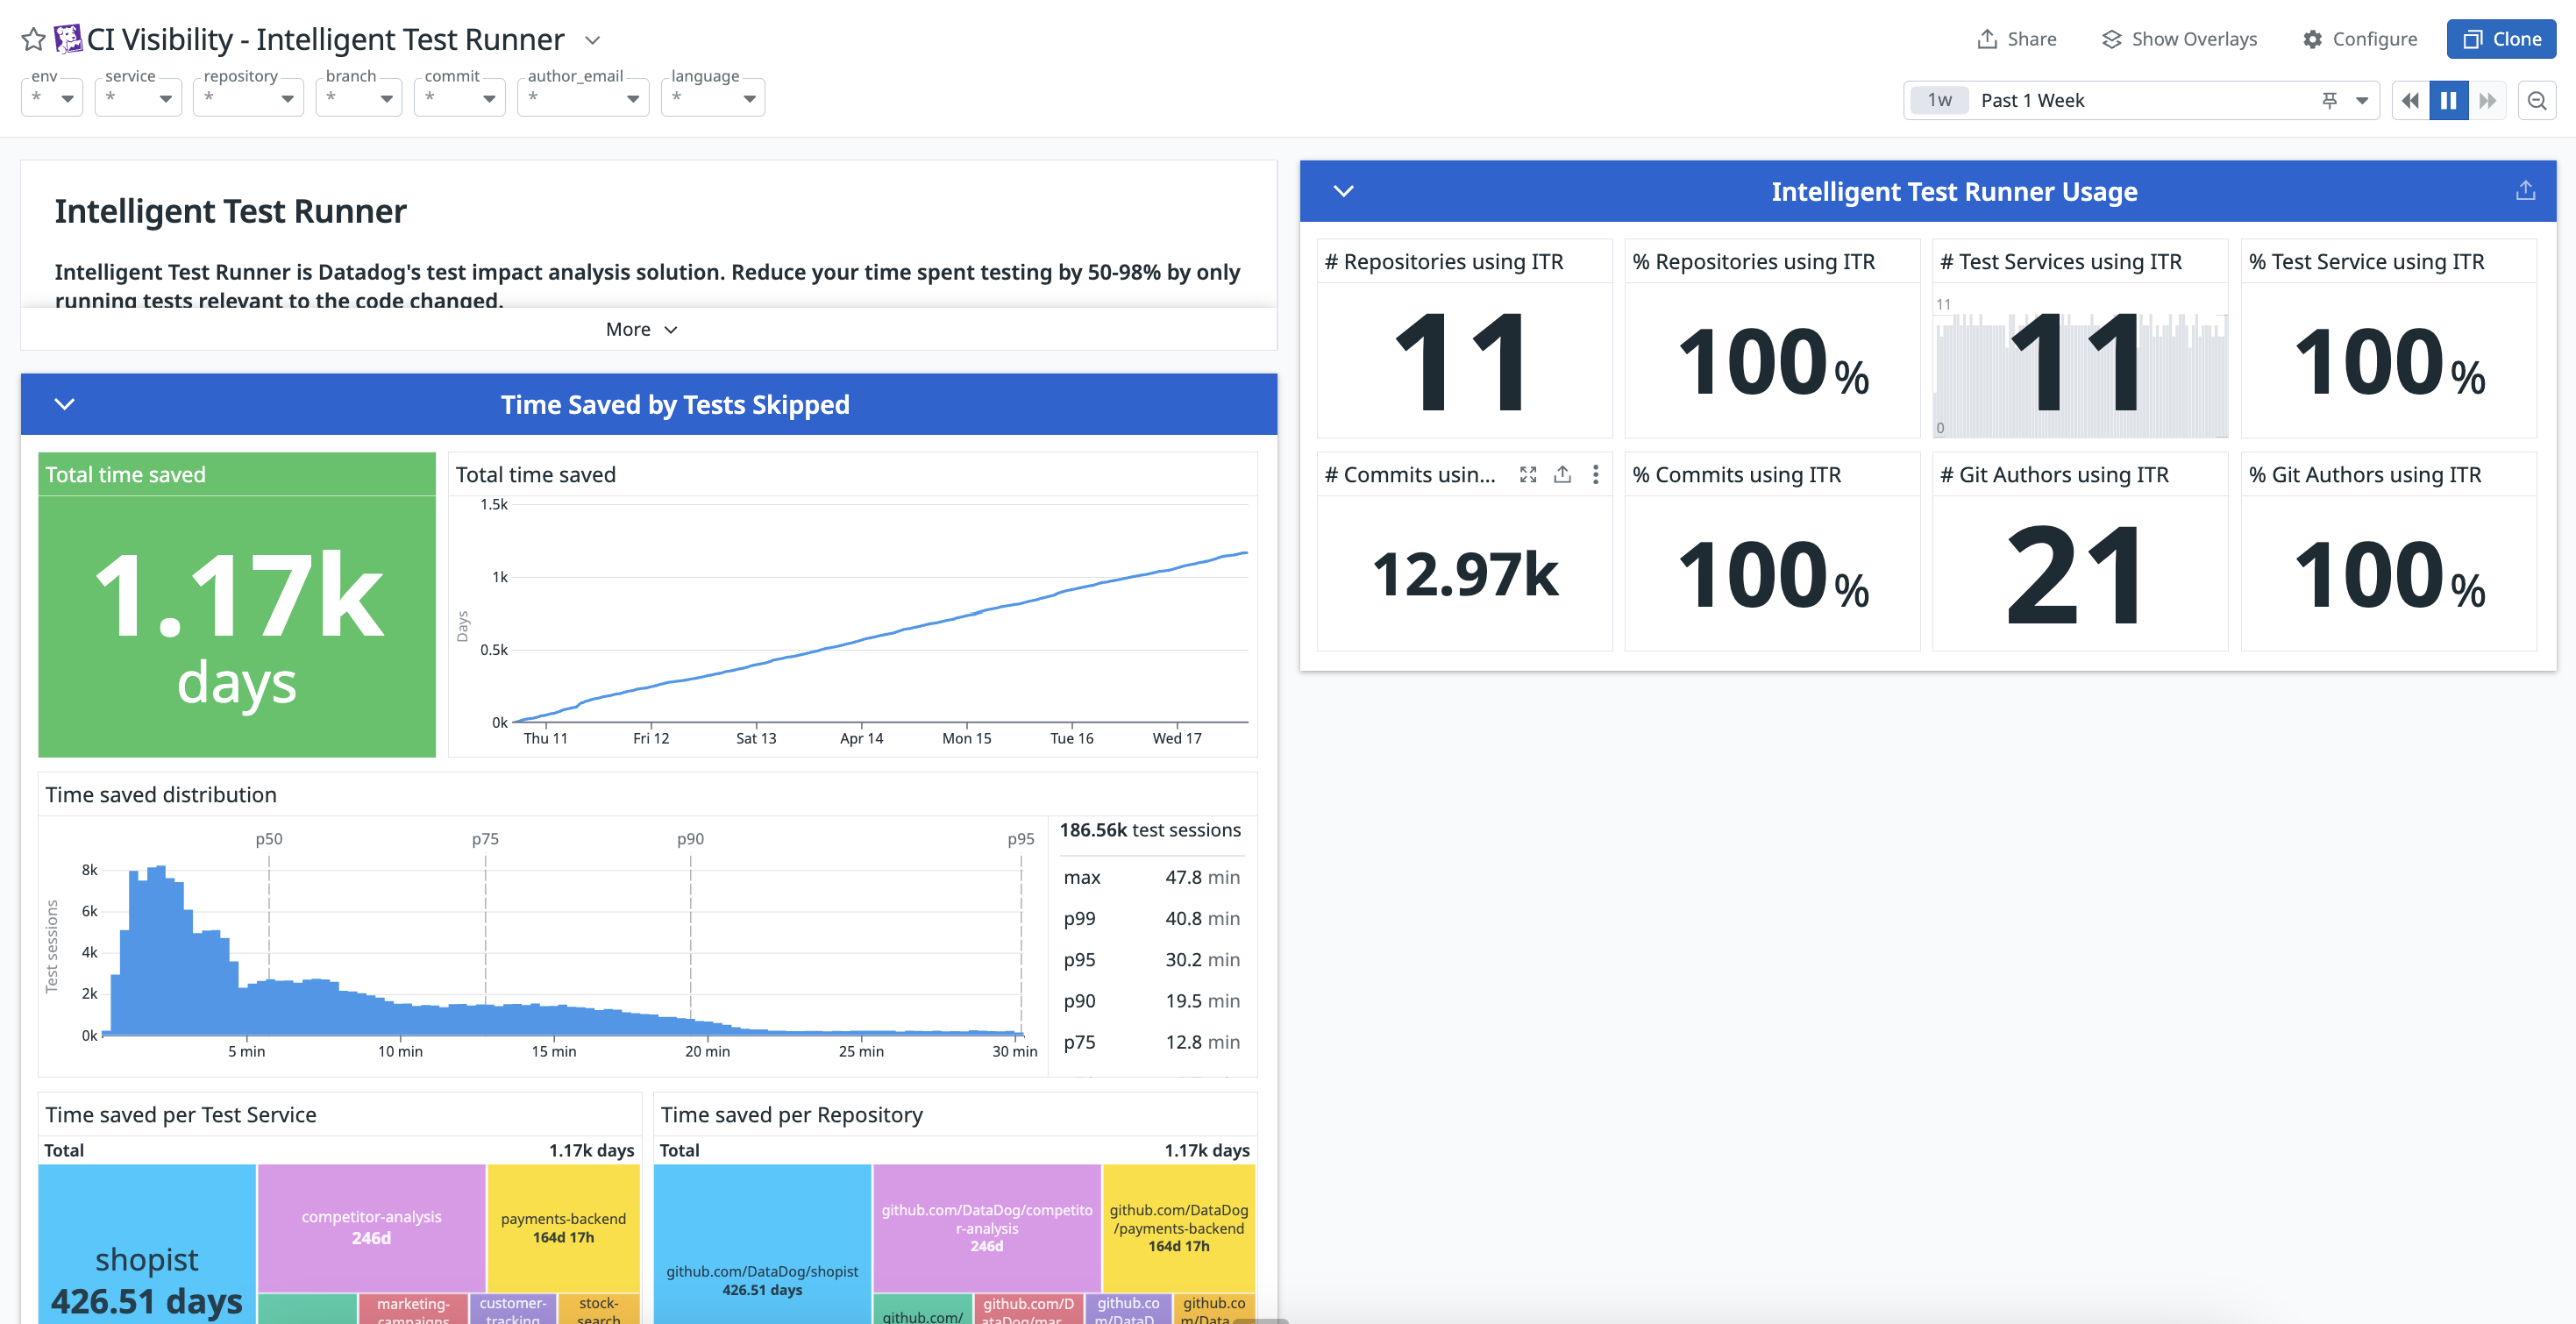
Explore the data collected by enabling Test Impact Analysis, such as the time savings achieved by skipping tests, as well as your organization’s usage of Test Impact Analysis, to improve your CI efficiency.
You can create dashboards to visualize your testing metrics, or use an out-of-the-box dashboard containing widgets populated with data collected by Test Impact Analysis to help you identify areas of improvement with usage patterns and trends.
Examine results in the Test Optimization Explorer
The Test Optimization Explorer allows you to create visualizations and filter test spans using the data collected from Test Optimization and Test Impact Analysis. When Test Impact Analysis is active, it displays the amount of time saved for each test session or commit. The duration bars turn purple to indicate active test skipping.
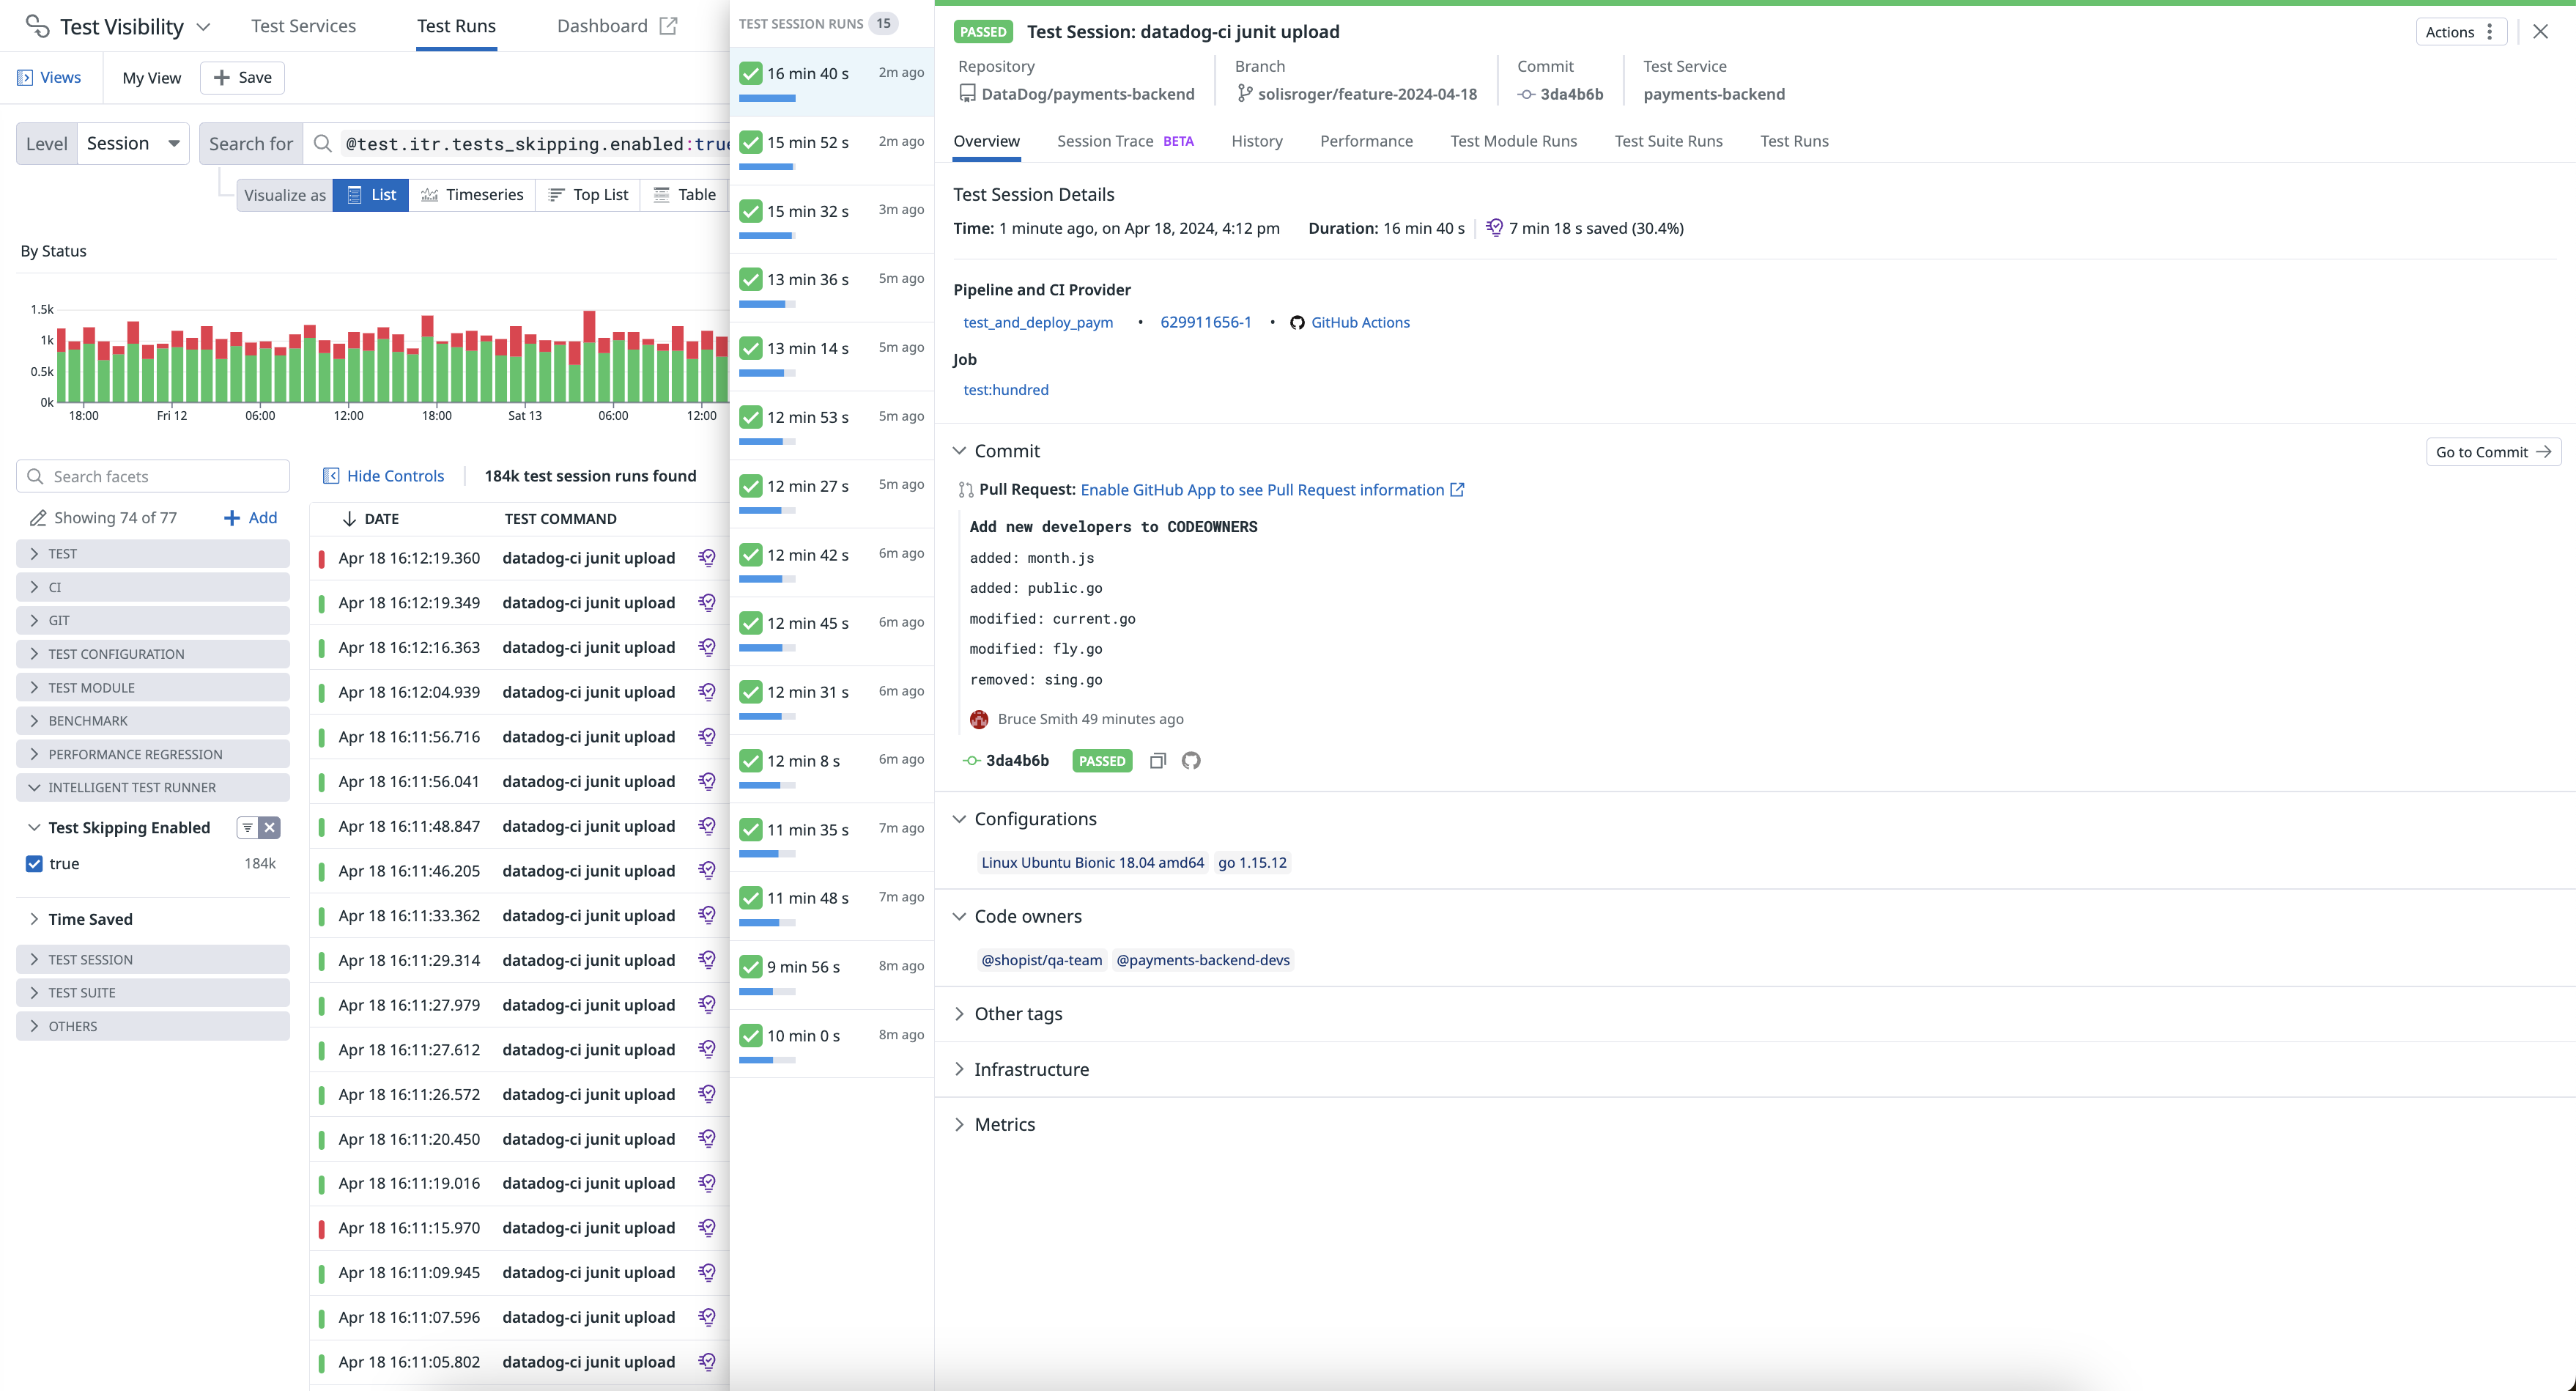
Navigate to Software Delivery > Test Optimization > Test Runs and select Session to start filtering your test session span results.
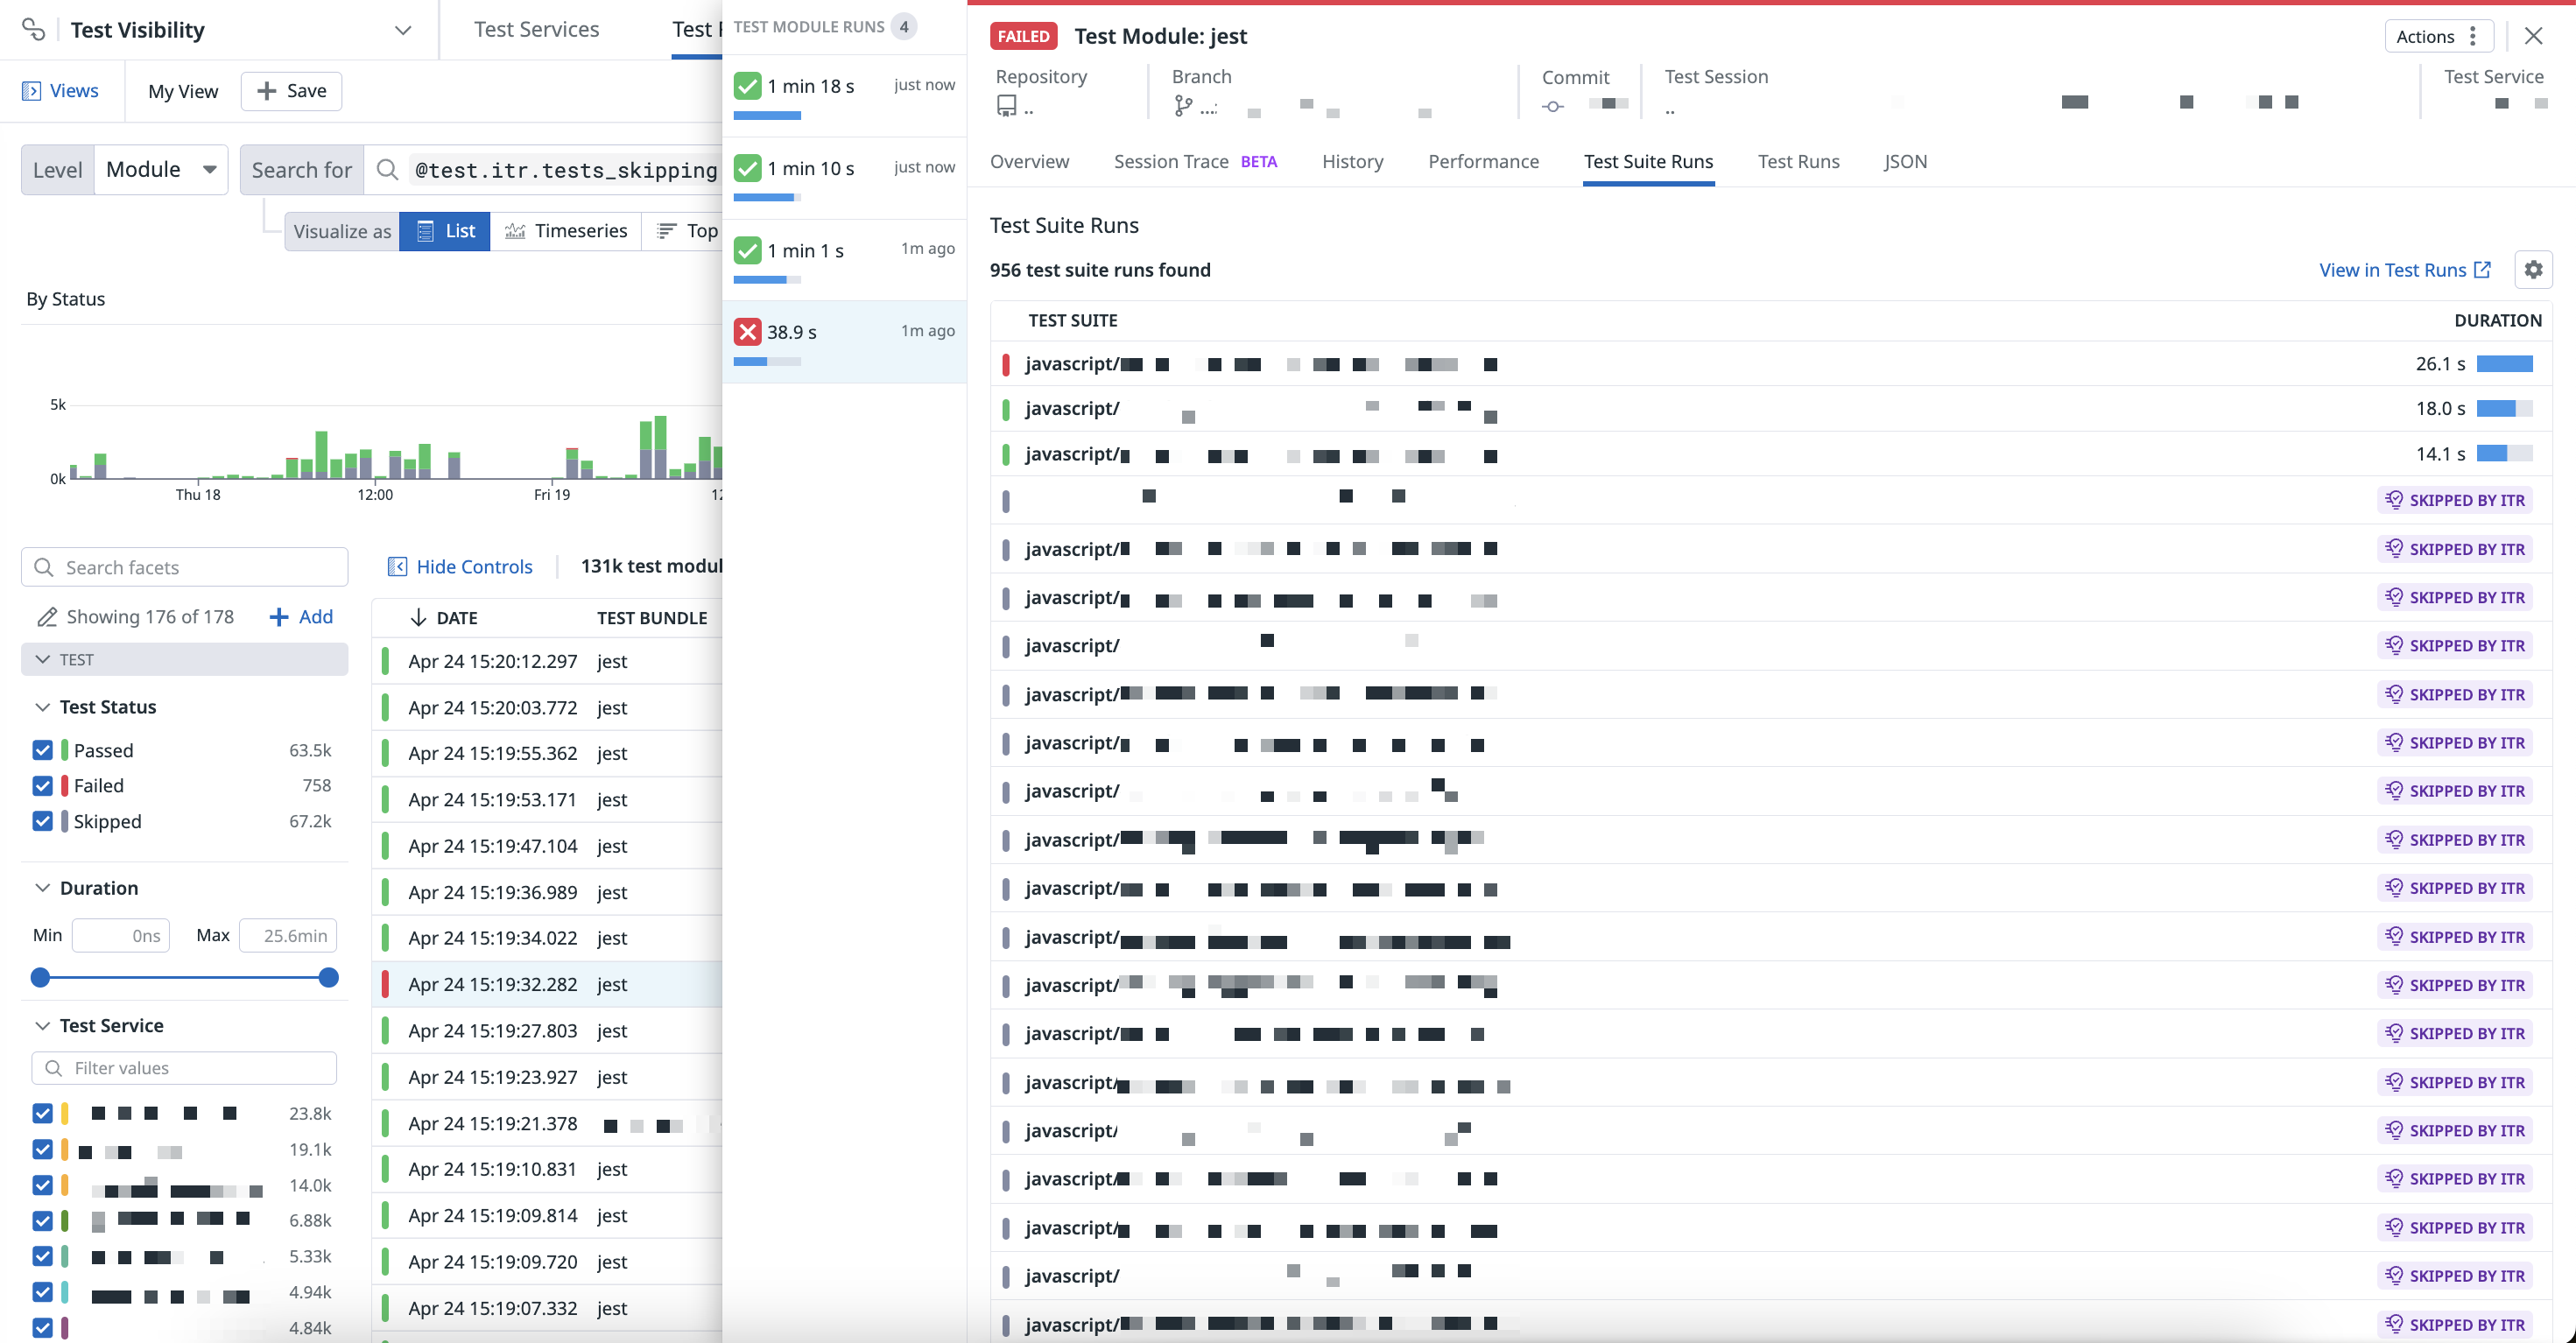
Navigate to Software Delivery > Test Optimization > Test Runs and select Module to start filtering your test module span results.
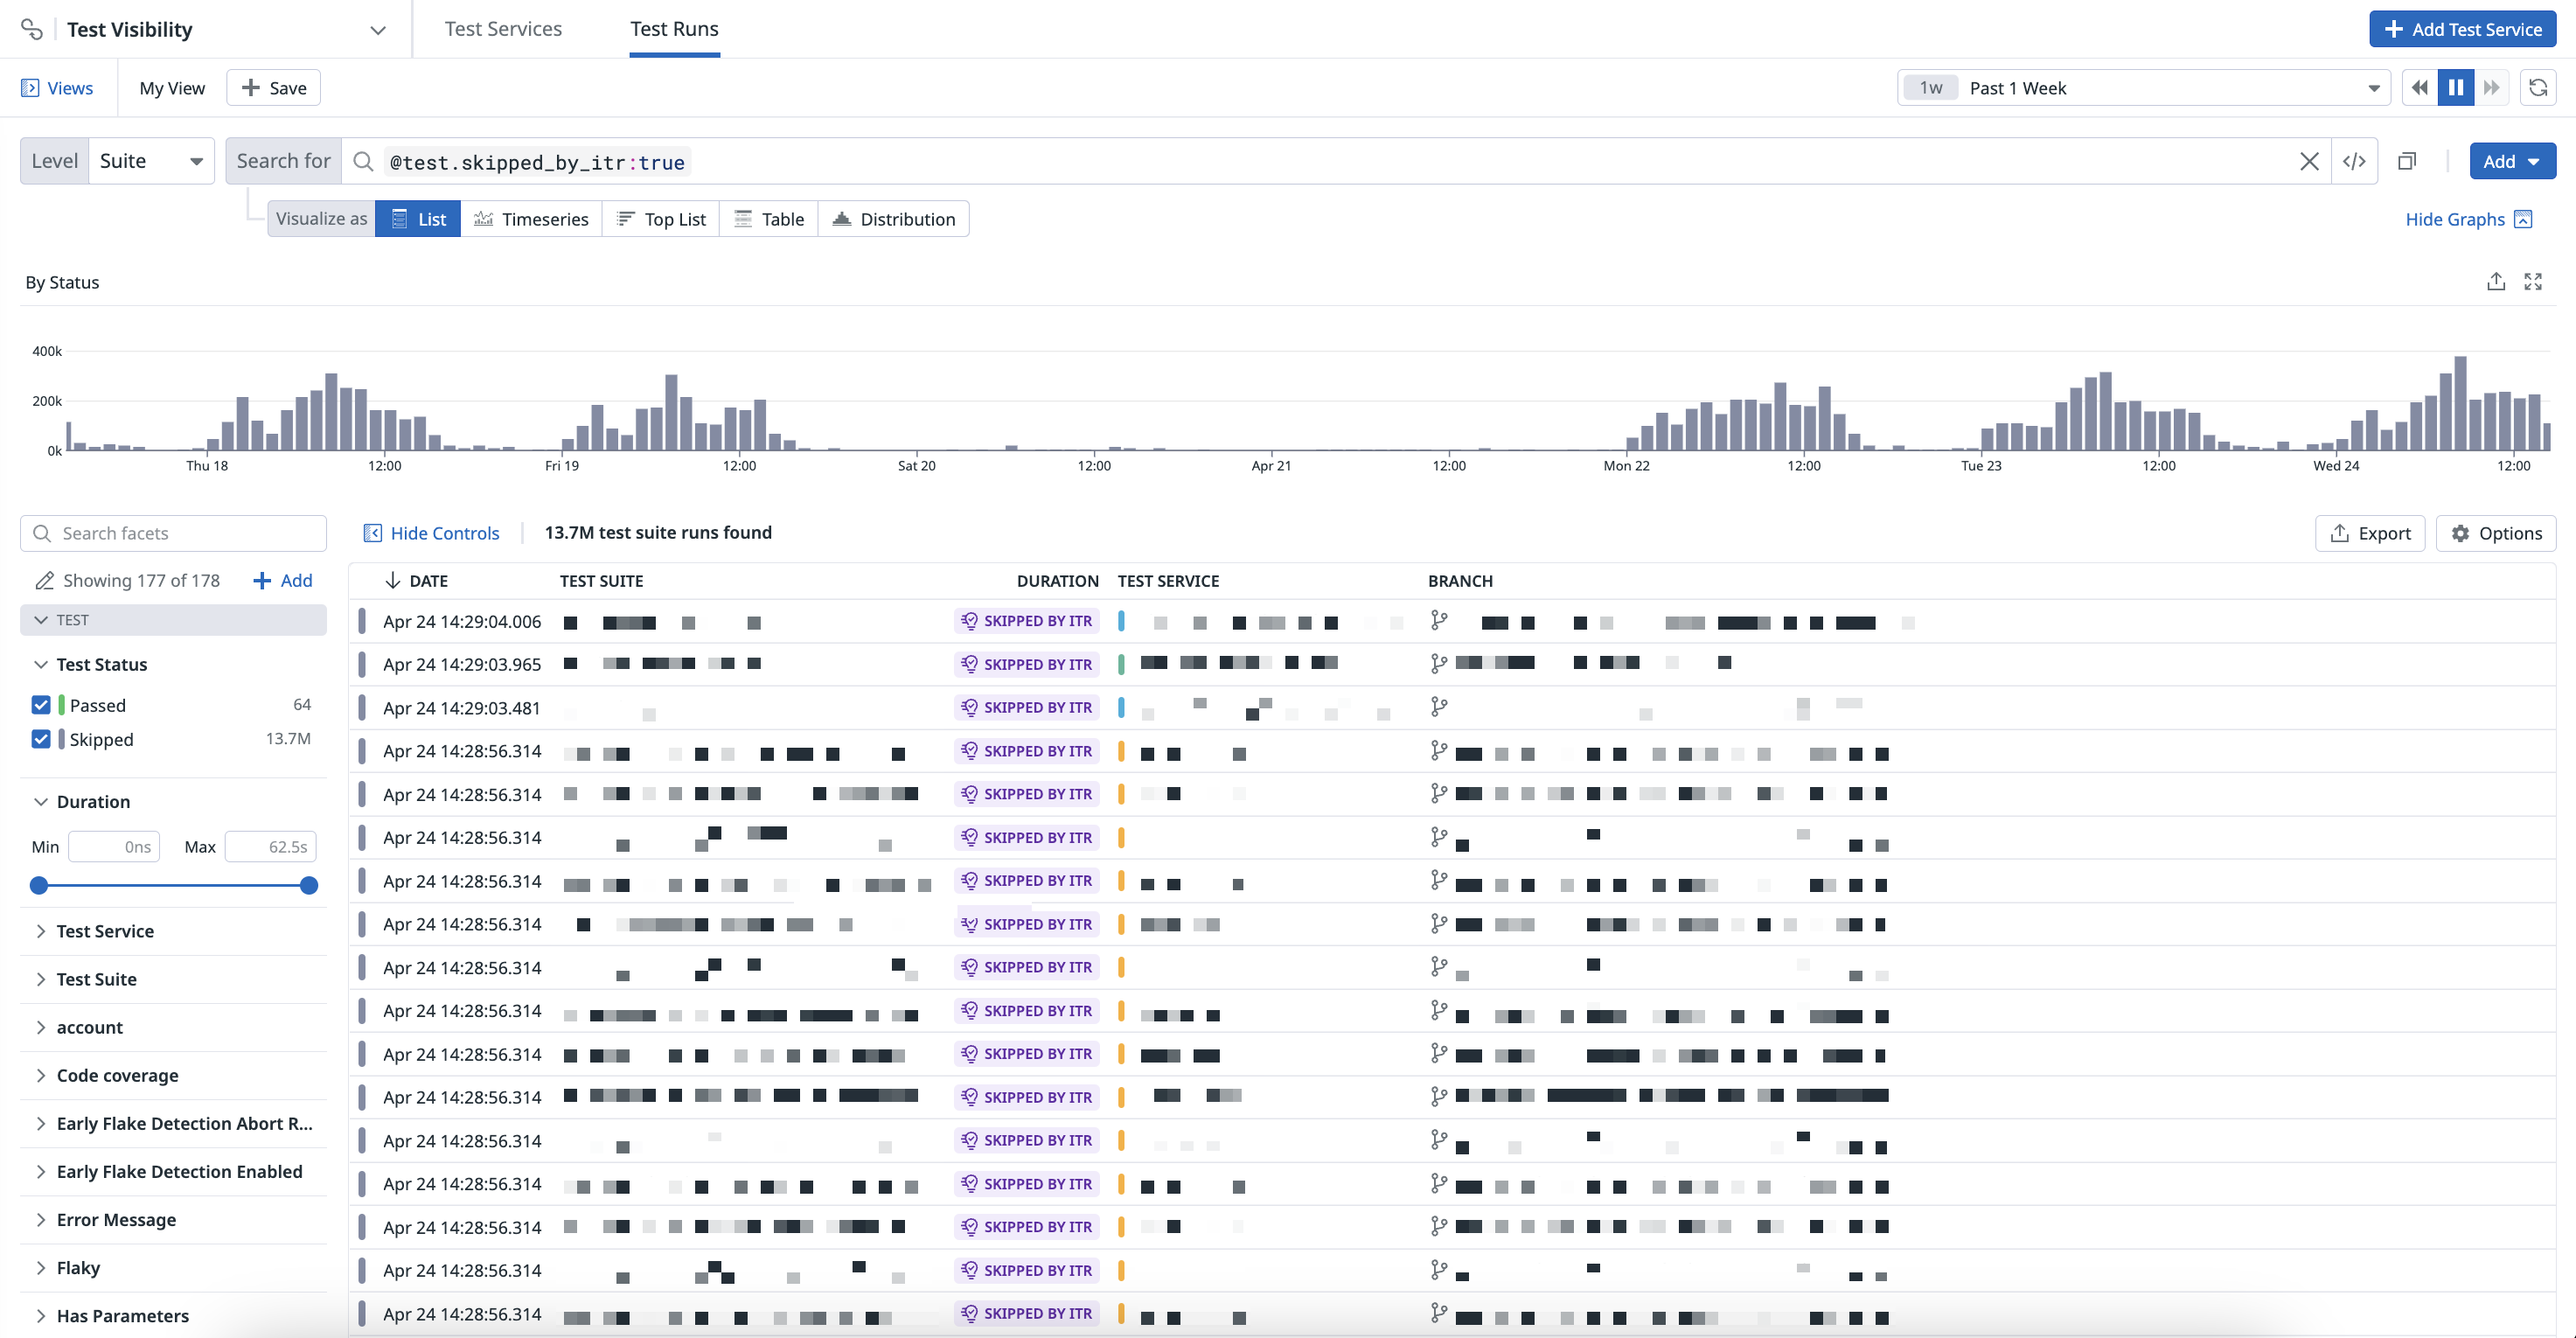
Navigate to Software Delivery > Test Optimization > Test Runs and select Suite to start filtering your test suite span results.
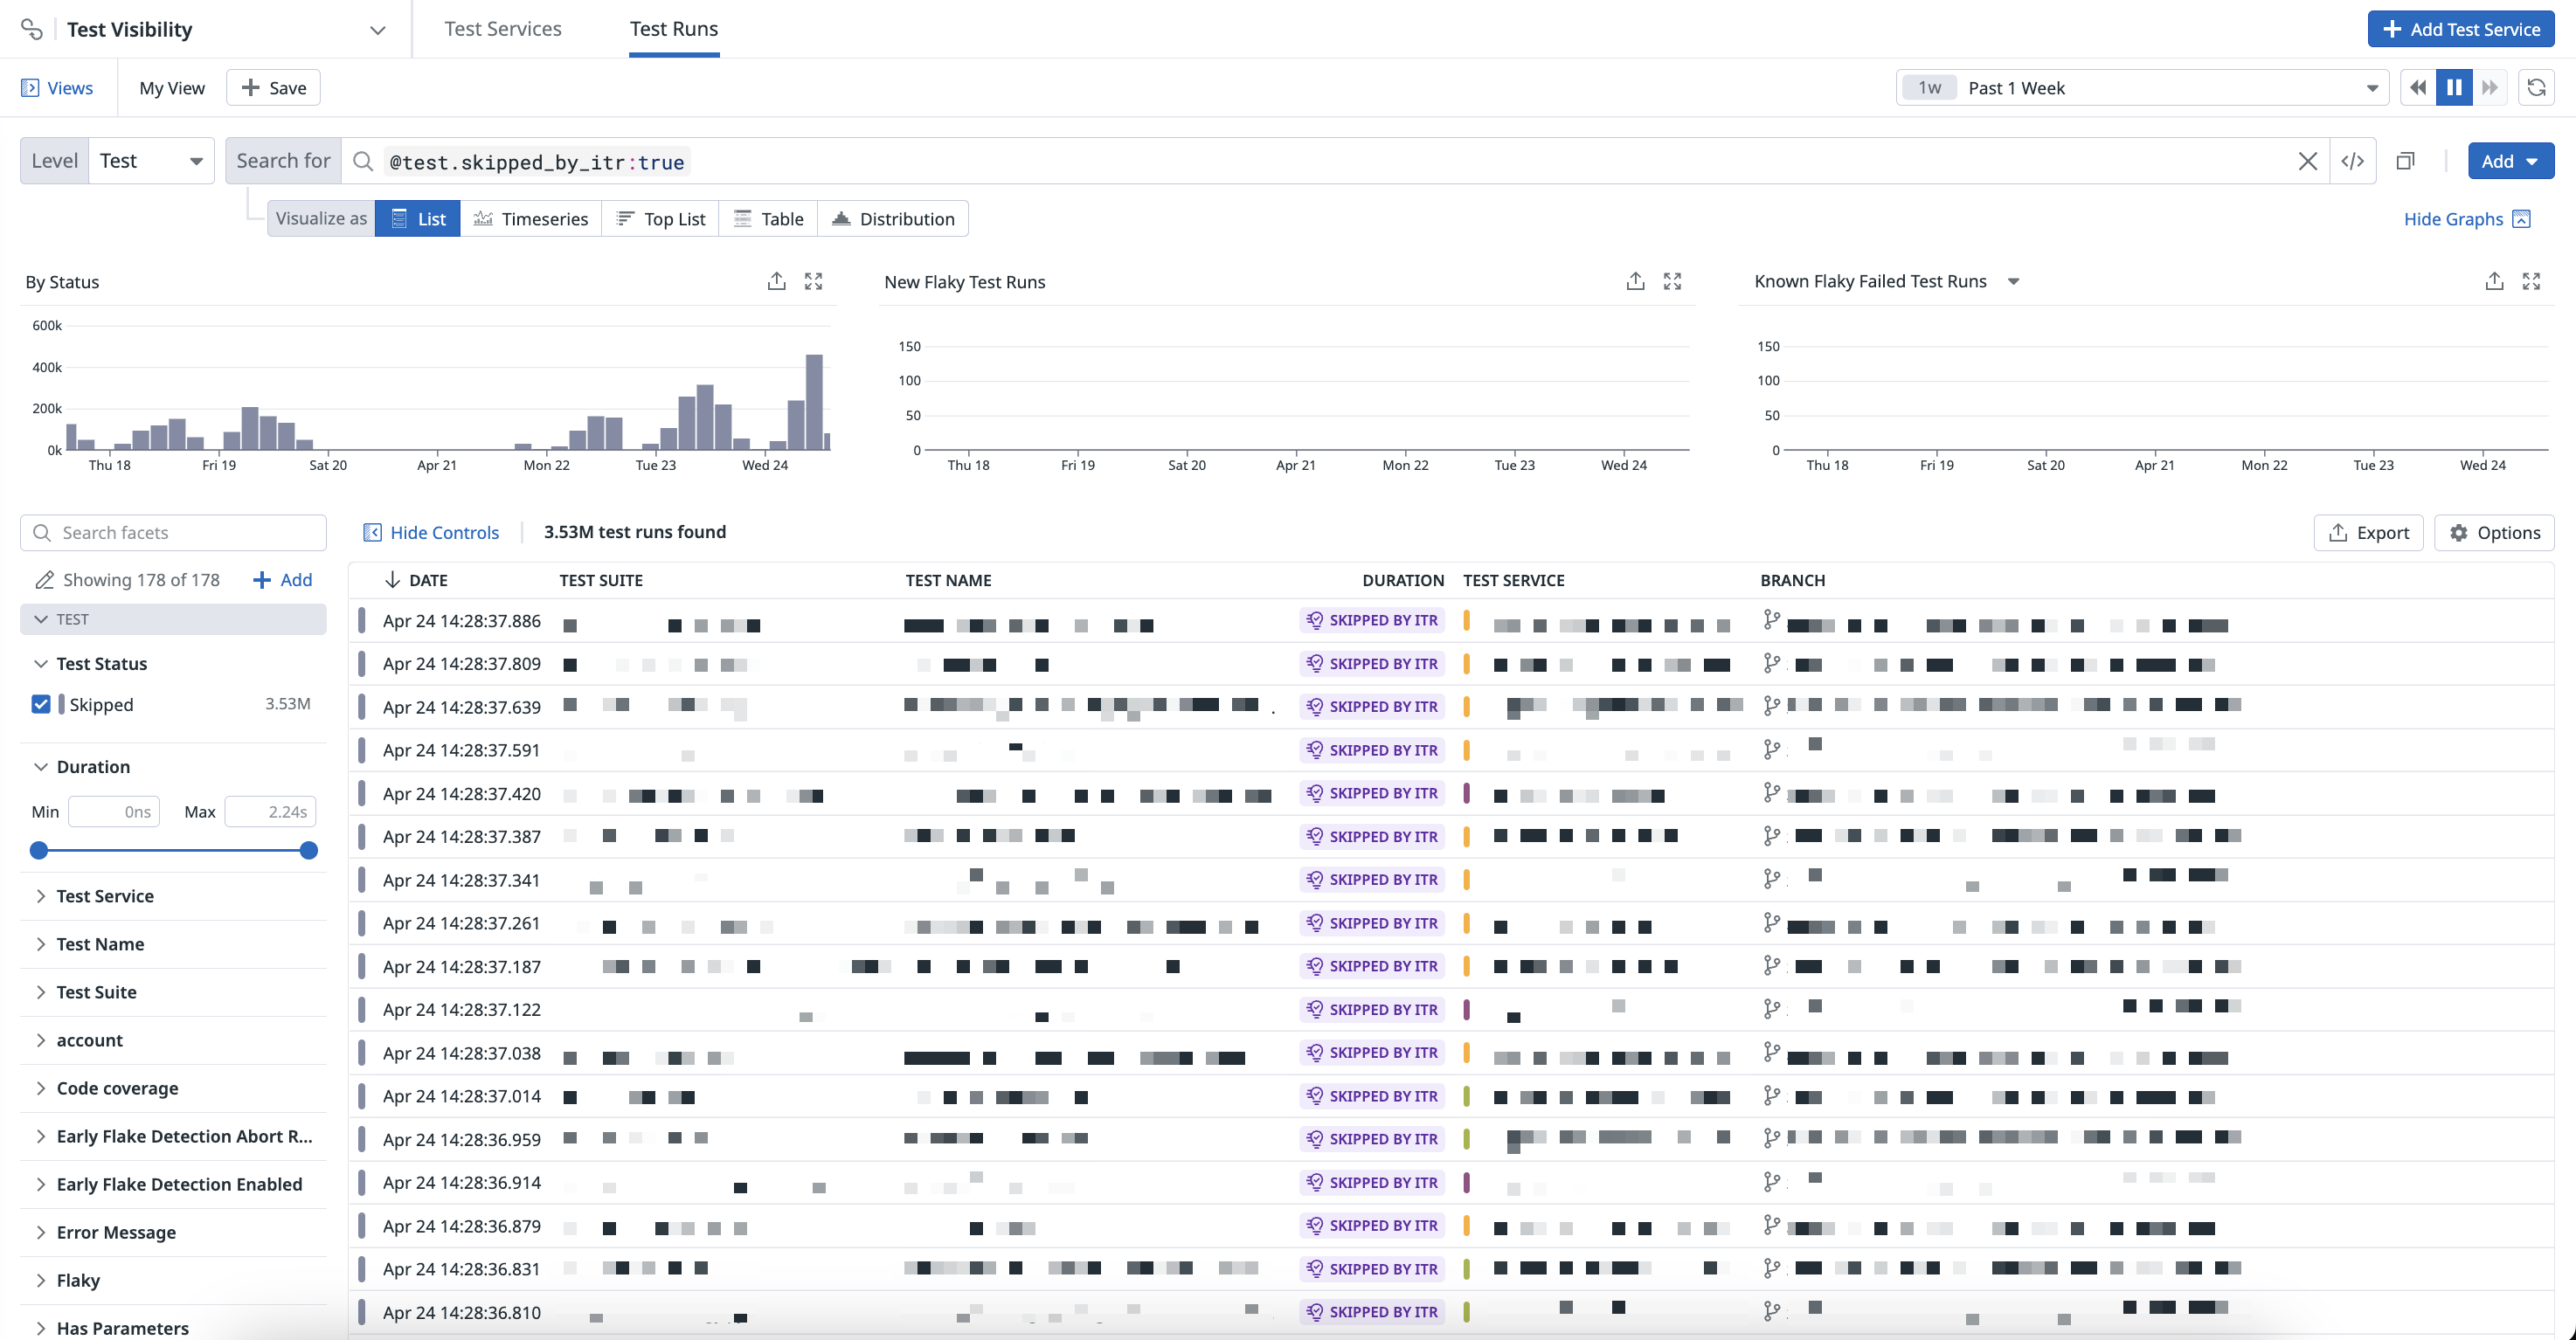
Navigate to Software Delivery > Test Optimization > Test Runs and select Test to start filtering your test span results.
Use the following out-of-the-box Test Impact Analysis facets to customize the search query:
- Code Coverage Enabled
- Indicates whether code coverage tracking was active during the test session.
- Skipped by ITR
- Number of tests that were skipped during the session by Test Impact Analysis.
- Test Skipping Enabled
- Indicates if Test Impact Analysis was enabled for the test session.
- Test Skipping Type
- The method or criteria used by Test Impact Analysis to determine which tests to skip.
- Tests Skipped
- The total count of tests that were not executed during the test session, which may include tests that were configured to skip, or were set as manual exclusions.
- Time Saved
- The length of time saved for the session by Test Impact Analysis usage.
For example, to filter test session runs that have Test Skipping Enabled, you can use @test.itr.tests_skipping.enabled:true in the search query.
Then, click on a test session run and see the amount of time saved by Test Impact Analysis in the Test Session Details section on the test session side panel.
