- 重要な情報
- はじめに
- Datadog
- Datadog サイト
- DevSecOps
- AWS Lambda のサーバーレス
- エージェント
- インテグレーション
- コンテナ
- ダッシュボード
- アラート設定
- ログ管理
- トレーシング
- プロファイラー
- タグ
- API
- Service Catalog
- Session Replay
- Continuous Testing
- Synthetic モニタリング
- Incident Management
- Database Monitoring
- Cloud Security Management
- Cloud SIEM
- Application Security Management
- Workflow Automation
- CI Visibility
- Test Visibility
- Intelligent Test Runner
- Code Analysis
- Learning Center
- Support
- 用語集
- Standard Attributes
- ガイド
- インテグレーション
- エージェント
- OpenTelemetry
- 開発者
- 認可
- DogStatsD
- カスタムチェック
- インテグレーション
- Create an Agent-based Integration
- Create an API Integration
- Create a Log Pipeline
- Integration Assets Reference
- Build a Marketplace Offering
- Create a Tile
- Create an Integration Dashboard
- Create a Recommended Monitor
- Create a Cloud SIEM Detection Rule
- OAuth for Integrations
- Install Agent Integration Developer Tool
- サービスのチェック
- IDE インテグレーション
- コミュニティ
- ガイド
- API
- モバイルアプリケーション
- CoScreen
- Cloudcraft
- アプリ内
- Service Management
- インフラストラクチャー
- アプリケーションパフォーマンス
- APM
- Continuous Profiler
- データベース モニタリング
- Data Streams Monitoring
- Data Jobs Monitoring
- Digital Experience
- Software Delivery
- CI Visibility (CI/CDの可視化)
- CD Visibility
- Test Visibility
- Intelligent Test Runner
- Code Analysis
- Quality Gates
- DORA Metrics
- セキュリティ
- セキュリティの概要
- Cloud SIEM
- クラウド セキュリティ マネジメント
- Application Security Management
- AI Observability
- ログ管理
- Observability Pipelines(観測データの制御)
- ログ管理
- 管理
Flex Logs
このページは日本語には対応しておりません。随時翻訳に取り組んでいます。翻訳に関してご質問やご意見ございましたら、お気軽にご連絡ください。
Overview
As your organization scales, the volume of logs collected from your infrastructure and applications grows along with it. The use cases for your logs increase in complexity as well. For example, you might be collecting logs from your infrastructure, applications, security tools, network, and so forth. All of these use cases have varying retention and querying needs.
With Flex Logs, your teams can determine the query capacity they need to meet their use case, whether it’s a time-critical incident, a security investigation, or a compliance audit. By decoupling storage from compute costs, Flex Logs provides cost-effective, long-term retention of your logs.
Some example use cases for Flex storage include:
- Retaining logs for long term auditing.
- Retaining logs for compliance and legal reasons.
- Need all logs for security investigations.
- Need to query logs for reporting and analytics for high cardinality data over long time periods.
When to use Flex Logs
Datadog Log Management provides the following solutions:
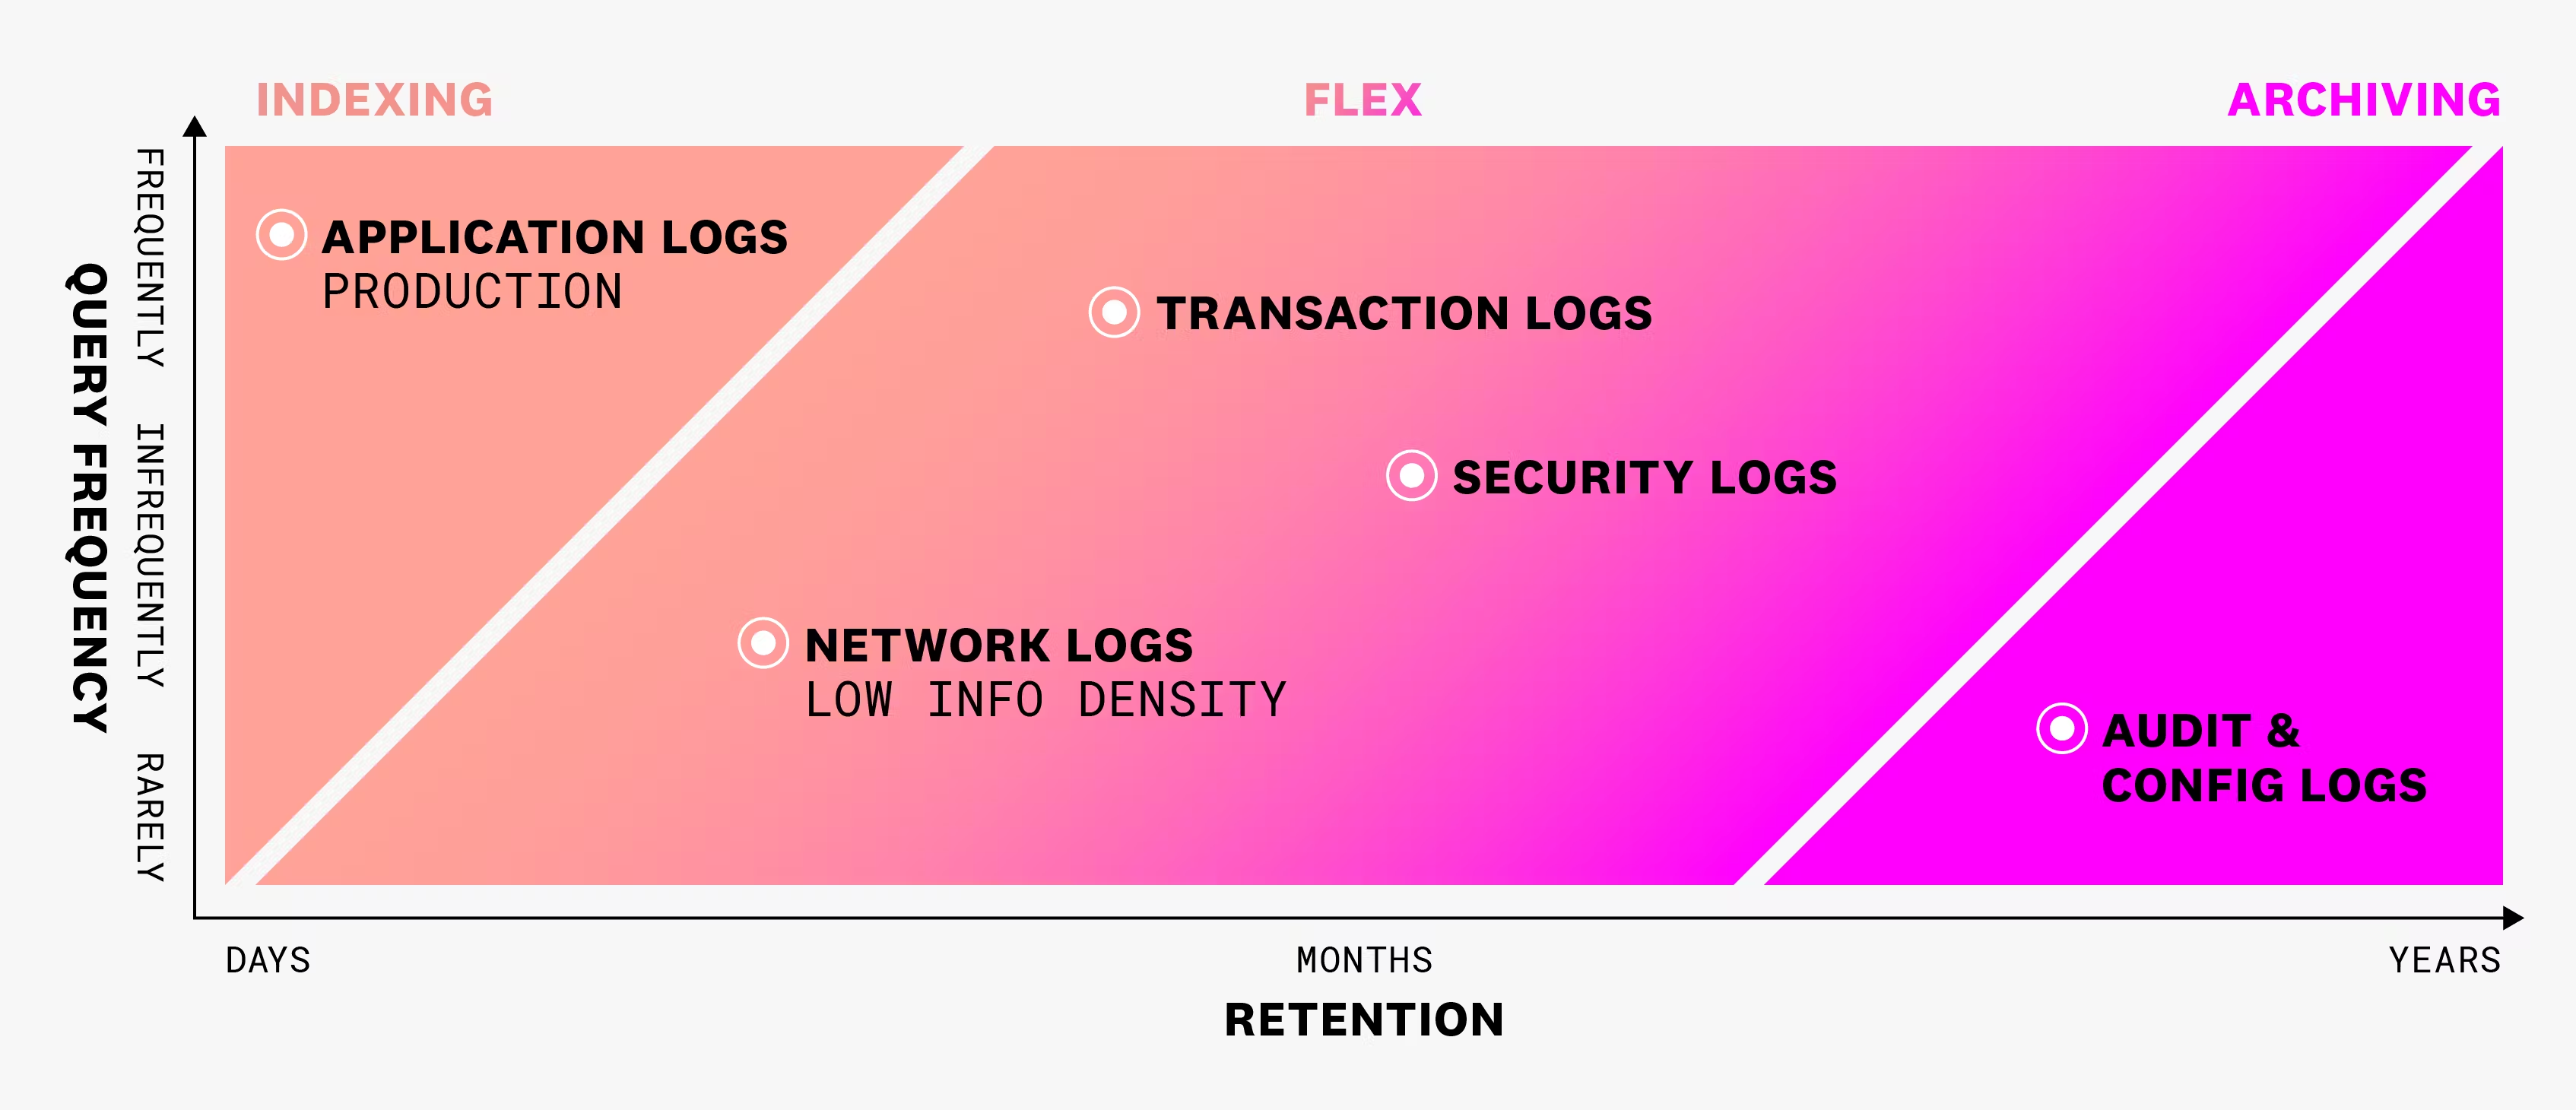
- Standard Indexing for logs that need to be queried frequently and retained short term, such as application logs.
- Flex Logs for logs that need to be retained long-term, but sometimes need to be queried urgently, such as security, transaction, and network logs.
- Archiving for logs that are infrequently queried and need to be stored long-term, such as audit and configuration logs.
Use the spectrum of log types shown in the image below to determine when to use the Flex Logs tier. Any high volume, infrequent access, or long term retention log sources are good candidates. You can also retain logs in Standard Indexing first and then extend them using Flex Logs; this is a perfect solution for application logs that you need to retain for longer. See Potential sources for sending directly to the Flex Logs tier for more information.
Notes:
- Monitors are not supported in Flex Logs.
- Watchdog is not supported in Flex Logs.
- Dashboards are supported in Flex Logs; however, make sure to consider these dashboard queries when you choose your compute size.
Compute sizes
Compute is the querying capacity to run queries for Flex Logs. It is used when querying logs in the Flex Logs tier. It is not used for ingestion or when only searching Standard Indexing logs. The available compute tiers are:
The compute sizes available for US3, US5, AP1, US1-FED are Starter, XS and S.
- Starter
- Extra small (XS)
- Small (S)
- Medium (M)
- Large (L)
Each compute tier is approximately 2X the query performance and capacity of the previous tier. The compute size is constrained by the CPU, number of concurrent queries, and the maximum limit on how many logs can be scanned per query
Determine the compute size that you need
The query performance of a compute tier depends on several factors:
- Volume: The amount of data stored in the Flex tier.
- Time window: The query’s timespace, for example a 15-minute window compared to a 1-month window of logs.
- Complexity: The type of query you run, for example, whether it is performing multiple levels of aggregation, using multiple filters, and so on.
- Concurrency: The number of users concurrently querying Flex Logs.
Consider the following factors when deciding on a compute tier:
- Your daily log volume and the number of logs stored in the Flex tier.
- The number of users regularly querying Flex tier logs.
- The frequency and types of queries you run. For example, the query time windows you typically use to query your logs.
The number of logs stored in the Flex tier has the largest impact on the size needed to performantly query the data. Datadog recommends the following compute sizes based on log volume:
| Size | Volume (events stored) |
|---|---|
| Starter | < 10 billion |
| Extra Small (XS) | 10 - 50 billion |
| Small (S) | 50 - 200 billion |
| Medium (M) | 200 - 500 billion |
| Large (L) | 500 billion - 1 trillion |
| Contact your Customer Success Manager | 1T+ |
Scalable (XS, S, M, L) compute tiers are billed at a flat rate. Flex Logs Starter is billed at a bundled storage+compute rate. See the pricing page for more information.
Enable and disable Flex Logs
You can enable or disable Flex Logs at the organization level. You must have the flex_logs_config_write permission to do so.
If Flex Logs is part of your contract, the compute options available on your contract is shown in the UI.
If Flex Logs is not in your contract, you can enable Flex Logs Starter through the self-serve onboarding option.
To enable Flex Logs:
- Navigate to the Flex Logs Control page.
- Select Compute Type.
- Datadog recommends the Starter compute size for organizations with less than 10B logs stored.
- Datadog recommends the scalable compute options (For example, XS, S, M, and L) for organizations with greater than 10B (or 2-3B per month) of logs stored.
- Select the compute size you want. See Determine the compute size that you need for more information.
- Click Enable Flex Logs.
Offboard from self-serve Flex Logs
To disable Flex Logs:
- Remove Flex Storage from each index where Flex Logs is enabled.
- Navigate back to the Flex Logs Control page.
- Click Disable Flex Logs.
Upgrade and downgrade Flex Logs compute
If you select one of the scalable compute options for Flex Logs (for example, XS, S, M, or L), you can upgrade or downgrade your compute size on the Flex Logs Control page.
Notes:
- Only compute options on your contract are made available.
- A compute instance can be upgraded at any time.
- A compute instance can be downgraded once per 15 days.
Configure storage tiers
Flex Logs is set up within log index configurations. Index filters that apply to that index also apply to Flex Logs. With Flex Logs Starter, you can store logs for 6, 12, or 15 months. With a scalable compute option, you can store logs for 30-450 days.
Configure Flex Tier in the Logs Index Configuration page:
- Navigate to the Indexes page.
- Edit the index you wish to enable with Flex Logs or create a new index.
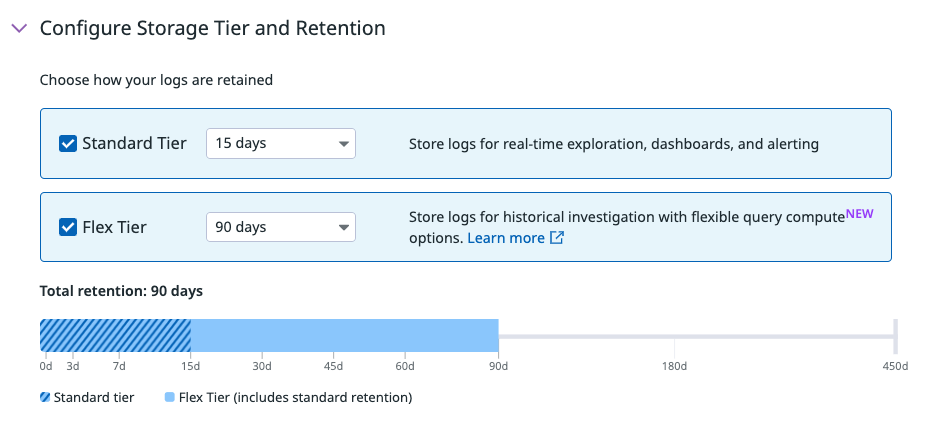
- Select Flex Tier and set the retention under Configure Storage Tier and Retention.
Note: If both tiers are selected, logs are stored in the Standard Tier until the end of the configured retention period, before they are stored in the Flex Tier. For example, if you select Standard Tier with a retention of 3 days and Flex Tier with a retention of 90 days: logs in that index are first stored in the Standard Tier for 3 days and then stored in the Flex Tier for the remaining 87 days.
The following table explains the impact of adding or removing different storage tiers to an index.
| Existing Index Configuration | Action | Result | |
| Standard Tier | Flex Tier | ||
| Enabled | Disabled | Enable Flex Tier. | The retention for both pre-existing and new logs are extended. |
| Disabled | Enabled | Enable Standard Tier. | Pre-existing logs in Flex Tier are not changed. New logs are retained in the Standard and Flex Tiers. |
| Enabled | Disabled | Enable Flex Tier and remove Standard Tier. | Logs are no longer queryable in monitors or in Watchdog Insights. |
Search Flex Logs tier
In the Log Explorer, toggle the Include Flex Logs option to include Flex Tier logs in your search query results. Find this option next to the time picker.
Search by typing in queries in the search bar or by selecting the relevant facet in the facet panel.
You can add Flex Log queries to dashboards, but make sure to consider these dashboard queries when you choose your compute size.
Note: Monitor queries are not supported for Flex Logs.
Additional information
Potential sources for sending directly to Flex Logs
The following list is an example of log sources that are good candidates for sending logs directly to the Flex Tier, without being stored in Standard Indexing first. This is not an exhaustive list and is meant to give you an idea about the types of logs that are suitable for this configuration. Other log sources (for example, application logs) can still be sent to the Flex Tier after going to Standard Indexing first for live troubleshooting, alerting, and debugging use cases. Your use cases for these sources could vary, which is important to consider when making the decision to skip Standard Indexing.
Note: These examples are a sample for each category. There are many more categories, and services, tools, and technologies that you may want to send directly to the Flex Tier.
| Technology | Examples |
|---|---|
| Artifact management | JFrog Artifactory, Archiva, Sonatype Nexus |
| Audit logs | Amazon Cloudtrail, Kubernetes audit logs, Microsoft 365 audit |
| CDN services | Akamai, Cloudflare, Fastly, CloudFront |
| CI/CD services | GitLab, GitHub Actions, Argo CD, Jenkins, CircleCI, TeamCity |
| DNS services | Route53, Cloudflare, Akamai (Edge), NS1 |
| Identity services | Cisco ISE, Okta, OneLogin, Workday User Activity Logs |
| Loadbalancers | AWS ELB, ALB, NLB (GCP and Azure flavors), F5, NGINX |
| Network appliances | Cisco, Meraki, Juniper, Arbua, HPE, Palo Alto, Barracuda |
| Network services | WAF, Amazon VPC Flow Logs, AWS ELB, pfSense, Tailscale |
| Service meshes | Anthos, Istio, proxyv2, consul, Linkerd, Kong |
Flex Logs for multiple-organization accounts
For each organization in which you want Flex Logs, you must enable a compute size per organization. Compute sizes cannot be shared across organizations.
Datadog generally recommends Flex Logs scalable compute sizes (XS, S, M, and L) for organizations with large log volumes. In a multi-organization setup, there are often many organizations with lower log volumes, so for these organizations, Datadog recommends the Starter compute size for Flex Logs.
When the compute limit is reached
When your organization reaches the compute limit in terms of concurrent queries, you many experience slower queries because queries continue to retry until capacity is available. If a query retries multiple times, it may fail to run. In such situations, there is an error message that says Flex Logs compute capacity is constrained and you should contact your admin.


