- 重要な情報
- はじめに
- Datadog
- Datadog サイト
- DevSecOps
- AWS Lambda のサーバーレス
- エージェント
- インテグレーション
- コンテナ
- ダッシュボード
- アラート設定
- ログ管理
- トレーシング
- プロファイラー
- タグ
- API
- Service Catalog
- Session Replay
- Continuous Testing
- Synthetic モニタリング
- Incident Management
- Database Monitoring
- Cloud Security Management
- Cloud SIEM
- Application Security Management
- Workflow Automation
- CI Visibility
- Test Visibility
- Intelligent Test Runner
- Code Analysis
- Learning Center
- Support
- 用語集
- Standard Attributes
- ガイド
- インテグレーション
- エージェント
- OpenTelemetry
- 開発者
- 認可
- DogStatsD
- カスタムチェック
- インテグレーション
- Create an Agent-based Integration
- Create an API Integration
- Create a Log Pipeline
- Integration Assets Reference
- Build a Marketplace Offering
- Create a Tile
- Create an Integration Dashboard
- Create a Recommended Monitor
- Create a Cloud SIEM Detection Rule
- OAuth for Integrations
- Install Agent Integration Developer Tool
- サービスのチェック
- IDE インテグレーション
- コミュニティ
- ガイド
- API
- モバイルアプリケーション
- CoScreen
- Cloudcraft
- アプリ内
- Service Management
- インフラストラクチャー
- アプリケーションパフォーマンス
- APM
- Continuous Profiler
- データベース モニタリング
- Data Streams Monitoring
- Data Jobs Monitoring
- Digital Experience
- Software Delivery
- CI Visibility (CI/CDの可視化)
- CD Visibility
- Test Visibility
- Intelligent Test Runner
- Code Analysis
- Quality Gates
- DORA Metrics
- セキュリティ
- セキュリティの概要
- Cloud SIEM
- クラウド セキュリティ マネジメント
- Application Security Management
- AI Observability
- ログ管理
- Observability Pipelines(観測データの制御)
- ログ管理
- 管理
Monitor Status
このページは日本語には対応しておりません。随時翻訳に取り組んでいます。翻訳に関してご質問やご意見ございましたら、お気軽にご連絡ください。
Overview
After creating your monitor, use the monitor status page to view the status over time.
Header
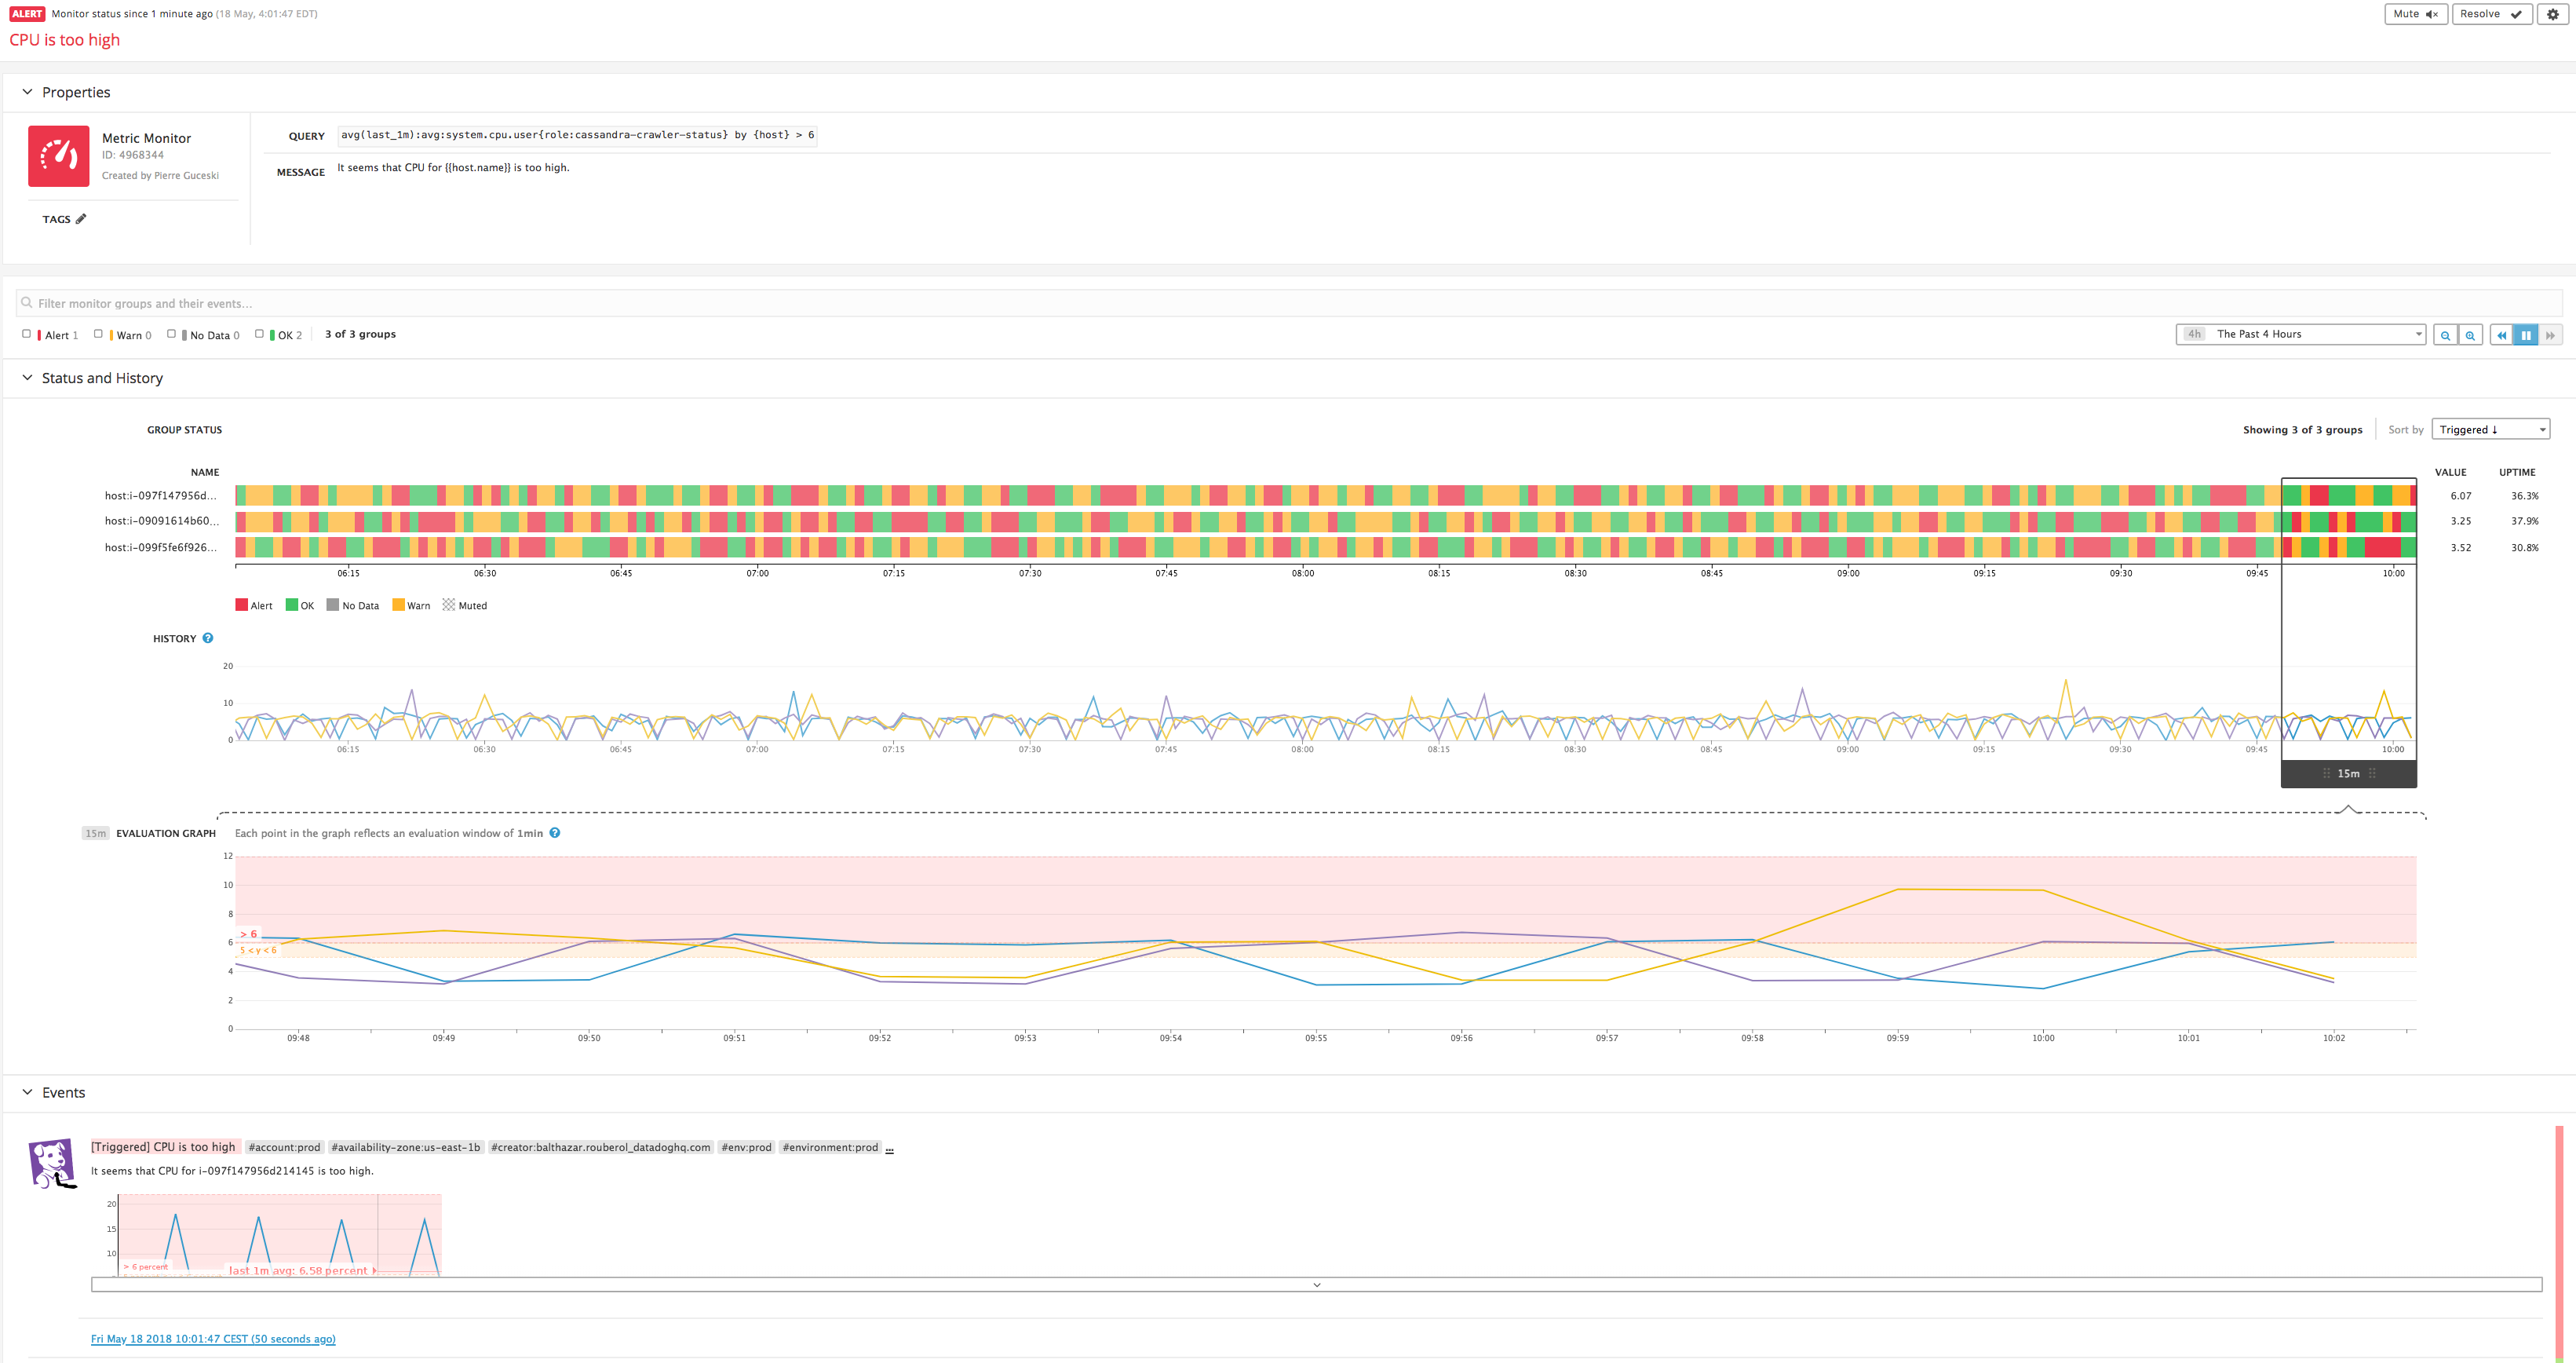
The header contains the monitor’s status, time of status, and monitor title. On the right are the Mute, Resolve, and settings cog buttons.
Mute
Use the mute button to mute the entire monitor or partially mute it by setting a Scope. The available scopes are based on the monitor’s group tags. See Downtimes for details on muting multiple scopes or monitors at the same time.
Note: Muting or unmuting a monitor with the UI deletes all scheduled downtimes associated with that monitor.
Resolve
If your monitor is in an alert state, the Resolve button is visible. Use this button to resolve your monitor manually.
The monitor resolve function is artificially switching the monitor status to OK for its next evaluation. The next monitor evaluation is performed normally on the data the monitor is based on.
If a monitor is alerting because its current data corresponds to the ALERT state, resolve has the monitor follow the state switch ALERT -> OK -> ALERT. Therefore, using resolve is not appropriate for acknowledging the alert or telling Datadog to ignore the alert.
Manually resolving a monitor is appropriate for cases where data is reported intermittently. For example, after triggering an alert the monitor doesn’t receive further data so it can no longer evaluate alerting conditions and recover to the OK state. In that case, the resolve function or the Automatically resolve monitor after X hours changes the monitor back to an OK state.
Typical use case: A monitor based on error metrics that are not generated when there are no errors (aws.elb.httpcode_elb_5xx, or any DogStatsD counter in your code reporting an error only when there is an error).
Create an incident
Create an incident from a monitor by selecting Declare incident. Configure the Declare Incident pop-up modal with the severity level, notifications, and additional notes. For more information, see the Incident Management documentation.
Settings
Click the settings cog to display the options available:
| Option | Description |
|---|---|
| Edit | Edit the current monitor. See details in the Configure Monitors section. |
| Clone | Make a copy of the current monitor. |
| Export | Export the JSON configuration for the current monitor. This option is also available when creating your monitor. If you manage monitors programmatically, define a monitor in the UI and export the JSON. |
| Delete | Delete the current monitor. You will be prompted to confirm the deletion. |
Properties
The properties section is the overview of your monitor’s:
| Property | Description |
|---|---|
| Status | Alert, Warn, No Data, or OK |
| Type | Learn more about monitor types. |
| ID | Used for the monitor API. |
| Date created | The date the monitor was created. |
| Author | The person who created the monitor. |
| Tags | The tags attached at the monitor level. Edit the tags by clicking on the pencil icon. |
| Query | Learn more about querying. |
| Message | The message specified in the notification section of the monitor. |
Status and history
The status and history section displays the query and state changes of your monitor over time. To filter the information, use the search box, statuses, and time selector above the section.
Status
The status graph shows your monitor’s status over time, broken out by group. Note: If you see None or no groups found, one of the following situations may apply:
- The monitor is newly created and has not evaluated yet.
- The monitor’s query was recently changed.
- The monitor’s timeframe is too short for a metric that provides data infrequently.
- The monitor is set to require a full window of data for a metric that provides data infrequently, see Advanced Alert Conditions.
- A host’s name previously included in the query has changed. Hostname changes age out of the UI within 2 hours.
- The query you are filtering by is not working as expected.
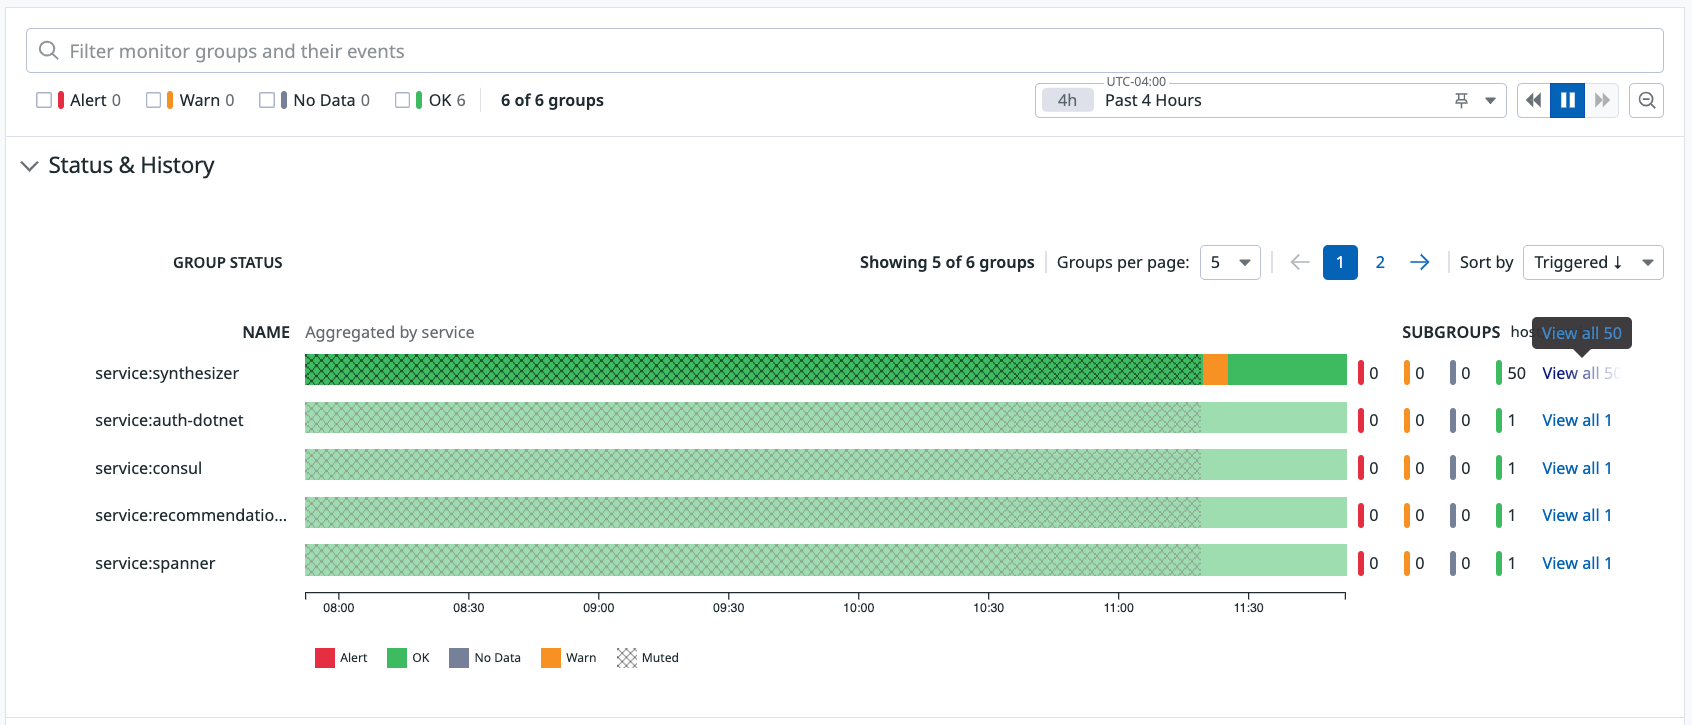
The status graph shows you the dimensions you configured for your alerts, not the dimensions in your monitor query. For example: your monitor query is grouped by service and host, but you only want to receive alerts for the service. The status graph shows the monitor’s status grouped by service. You can see the host subgroups by clicking View all which opens a panel showing status graphs for each subgroup. For more information on alert groupings, see Configure Monitors.
Filter the monitor status by groups or events
To scope down the Status & History view to specific groups, use the filter field and enter the attributes you want to filter by. The group filter syntax follows the same principles of the Monitor Search query. Some best practices to follow:
Filters are case sensitive,
env:prodandenv:Proddo not return the same monitor groups. Datadog recommends practicing uniformity in tags. For more information, see Getting Started with Tags.Queries automatically append a wildcard. To apply specific filters, surround your query with double quotes (
"). For example, take the following query which does not use double quotes:availability-zone:us-central1-a,instance-type:*,name:gke-demo-1The monitor returns the follow groups even though you expect the query to show one specific group.
availability-zone:us-central1-a,instance-type:*,name:gke-demo-10
availability-zone:us-central1-a,instance-type:*,name:gke-demo-12
Surrounding the query with double quotes returns the expected group:
"availability-zone:us-central1-a,instance-type:*,name:gke-demo-1"
Investigate a Monitor in a Notebook
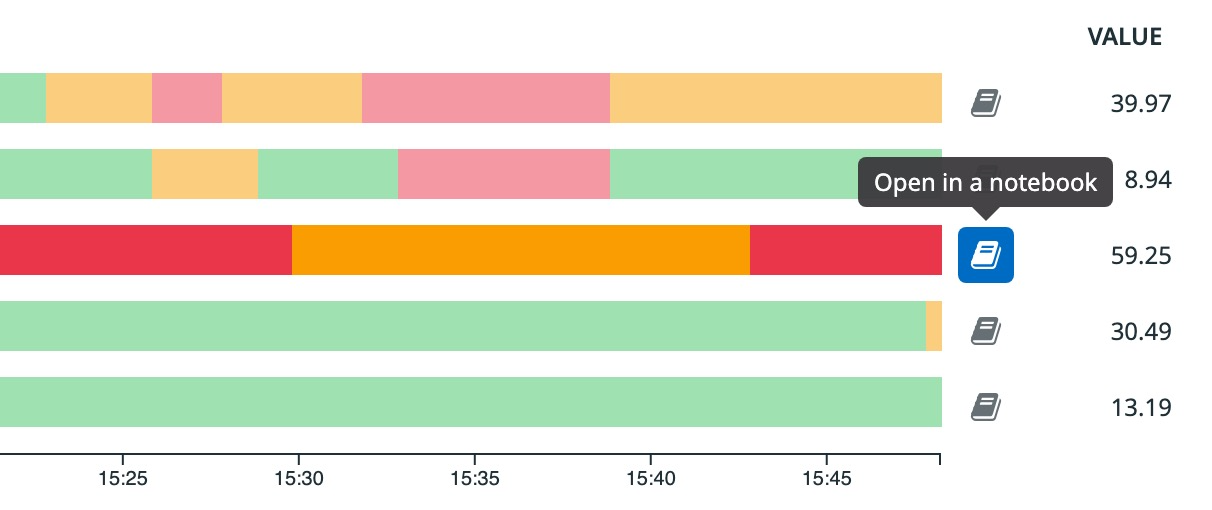
For further investigation into your metrics evolution, click Open in a notebook by the status graph. This generates an investigation notebook with a formatted graph of the monitor query.
The notebook matches the monitor evaluation period time range and includes related logs where relevant.
Follow monitor group retention
Datadog keeps monitor groups available in the UI for 24 hours unless the query is changed. Host monitors and service checks that are configured to notify on missing data are available for 48 hours. If a monitor graph displays a dotted line and is marked as non-reporting, it can be for the following reasons:
- The new group is evaluated some time after the monitor is created. The evaluation graph shows the dotted line from the start of the time period to when the group is first evaluated.
- The group stops reporting, drops out, and then starts reporting again. The dotted line appears from the time the group dropped out to when the group starts evaluating again.
Note: Non-reporting is not the same as no data. Non-reporting status is specific to groups.
History
The history graph shows the collected data aligned with the status graph. It shows the raw data points being submitted for the metric query in the monitor. The monitor status page uses the same timeseries graph widget that is used in Notebooks and Dashboards.
Evaluation graph
The evaluation graph is specific to the monitor. It uses the same query logic as the history graph, however it is scoped to the timeframe bracket on the history graph. It has a fixed, zoomed window that corresponds to your monitor evaluation window to ensure the displayed points are aggregated correctly. For example, if the monitor is configured to evaluate the average of the query over the last 15 minutes, each datapoint in the evaluation graph shows the aggregate value of the metric for the previous 15 minute evaluation window.
This graph shows the results from the raw data points of a metric applied against the evaluation conditions you configure in the monitor. This visualization is different from the History graph because it’s showing the value of the data after it has gone through the monitor query.
Events
Events generated from your monitor (alerts, warnings, recoveries, etc.) are shown in this section based on the time selector above the Status & History section. The events are also displayed in your Events Explorer.
Audit trail
Audit Trail automatically captures monitor changes for all monitor types and creates an event. This event documents the changes to the monitor.
For example, in the case of an edit to a monitor, the Audit Trail event shows:
- The previous monitor configuration
- The current monitor configuration
- The user that made the change
For more information, see the Audit Trail documentation and read the Audit Trail best practices blog.
Datadog also provides a notification option for changes to monitors you create. At the bottom of the monitor editor, under Define permissions and audit notifications, select Notify in the dropdown next to: If this monitor is modified, notify monitor creator and alert recipients..
The notify setting sends an email with the monitor audit event to all people who are alerted in the specific monitor as well as to the monitor creator. The monitor audit event also appears in the Events Explorer.
Export and import
You can obtain a JSON export of any monitor from the monitor’s status page. Click the settings cog (top right) and choose Export from the menu.
Import a monitor to Datadog with JSON using the main navigation: Monitors –> New Monitor –> Import.


