- 重要な情報
- はじめに
- Datadog
- Datadog サイト
- DevSecOps
- AWS Lambda のサーバーレス
- エージェント
- インテグレーション
- コンテナ
- ダッシュボード
- アラート設定
- ログ管理
- トレーシング
- プロファイラー
- タグ
- API
- Service Catalog
- Session Replay
- Continuous Testing
- Synthetic モニタリング
- Incident Management
- Database Monitoring
- Cloud Security Management
- Cloud SIEM
- Application Security Management
- Workflow Automation
- CI Visibility
- Test Visibility
- Intelligent Test Runner
- Code Analysis
- Learning Center
- Support
- 用語集
- Standard Attributes
- ガイド
- インテグレーション
- エージェント
- OpenTelemetry
- 開発者
- 認可
- DogStatsD
- カスタムチェック
- インテグレーション
- Create an Agent-based Integration
- Create an API Integration
- Create a Log Pipeline
- Integration Assets Reference
- Build a Marketplace Offering
- Create a Tile
- Create an Integration Dashboard
- Create a Recommended Monitor
- Create a Cloud SIEM Detection Rule
- OAuth for Integrations
- Install Agent Integration Developer Tool
- サービスのチェック
- IDE インテグレーション
- コミュニティ
- ガイド
- API
- モバイルアプリケーション
- CoScreen
- Cloudcraft
- アプリ内
- Service Management
- インフラストラクチャー
- アプリケーションパフォーマンス
- APM
- Continuous Profiler
- データベース モニタリング
- Data Streams Monitoring
- Data Jobs Monitoring
- Digital Experience
- Software Delivery
- CI Visibility (CI/CDの可視化)
- CD Visibility
- Test Visibility
- Intelligent Test Runner
- Code Analysis
- Quality Gates
- DORA Metrics
- セキュリティ
- セキュリティの概要
- Cloud SIEM
- クラウド セキュリティ マネジメント
- Application Security Management
- AI Observability
- ログ管理
- Observability Pipelines(観測データの制御)
- ログ管理
- 管理
Profile Visualizations
このページは日本語には対応しておりません。随時翻訳に取り組んでいます。翻訳に関してご質問やご意見ございましたら、お気軽にご連絡ください。
Search profiles
Go to APM -> Profiles and select a service to view its profiles. Select a profile type to view different resources (for example, CPU, Memory, Exception, and I/O).
You can filter according to infrastructure tags or application tags set up from your environment tracing configuration. By default the following facets are available:
| Facet | Definition |
|---|---|
| Env | The environment your application is running on (production, staging). |
| Service | The name of the service your code is running. |
| Version | The version of your code. |
| Host | The hostname your profiled process is running on. |
| Runtime | The type of runtime the profiled process is running (JVM, CPython). |
The following measures are available:
| Measure | Definition |
|---|---|
| CPU | CPU usage, measured in cores. |
| Memory Allocation | Memory allocation rate over the course of the profile. This value can be above the amount of memory on your system because allocated memory can be garbage collected during the profile. |
| Wall time | The elapsed time used by the code. Elapsed time includes time when code is running on CPU, waiting for I/O, and anything else that happens while it is running. |
For each runtime, there is also a broader set of metrics available, which you can see listed by timeseries.
Profile types
In the Profiles tab, you can see all profile types available for a given language. Depending on the language, the information collected about your profile differs. See Profile types for a list of profile types available for each language.
Visualizations
Flame graph
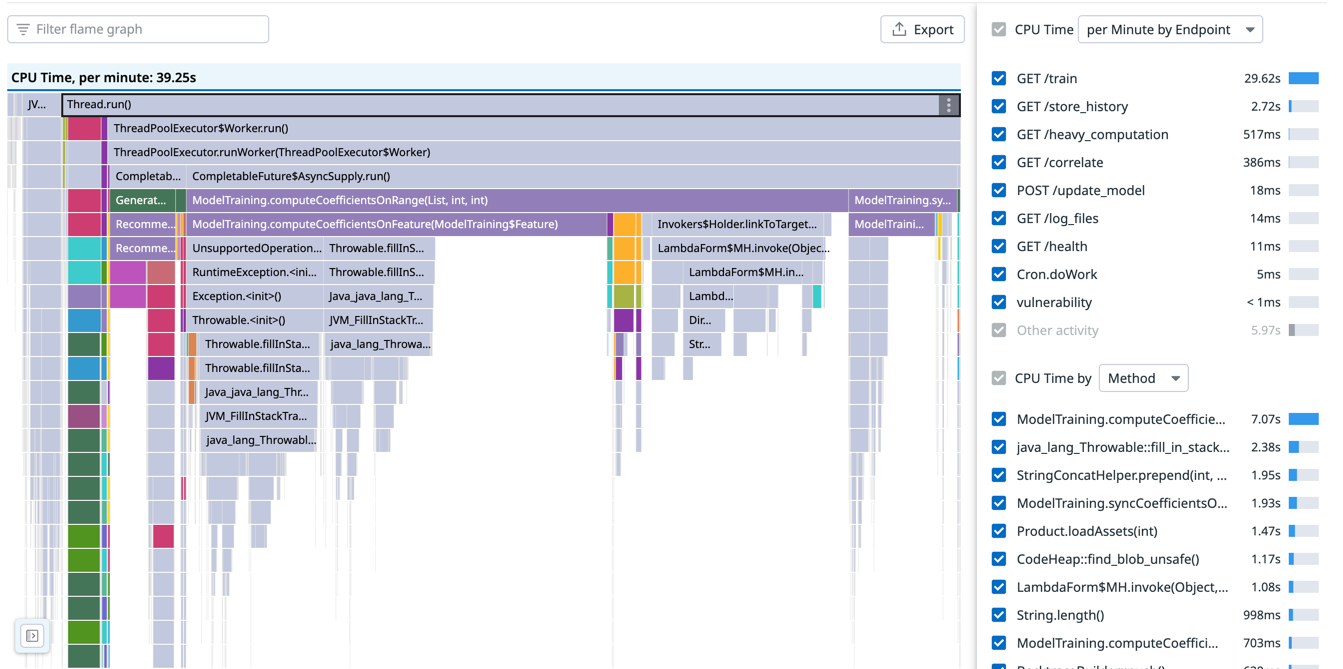
The flame graph is the default visualization for Continuous Profiler. It shows how much CPU each method used (since this is a CPU profile) and how each method was called.
For example, starting from the first row in the previous image, Thread.run() called ThreadPoolExecutor$Worker.run(), which called ThreadPoolExecutor.runWorker(ThreadPoolExecutor$Worker), and so on.
The width of a frame represents how much of the total CPU it consumed. On the right, you can see a CPU time by Method top list that only accounts for self time, which is the time a method spent on CPU without calling another method.
Flame graphs can be be included in Dashboards and Notebooks with the Profiling Flame Graph Widget.
Single profile
By default, profiles are uploaded once a minute. Depending on the language, these processes are profiled between 15s and 60s.
To view a specific profile, set the Visualize as option to Profile List and click an item in the list:
The header contains information associated with your profile, like the service that generated it, or the environment and code version associated to it.
Four tabs are below the profile header:
| Tab | Definition |
|---|---|
| Profiles | A flame graph and summary table of the profile you are looking at. You can switch between profile types (for example, CPU, Memory allocation). |
| Analysis | A set of heuristics that suggest potential issues or areas of improvement in your code. Only available for Java. |
| Metrics | Profiler metrics coming from all profiles of the same service. |
| Runtime Info | Runtime properties in supported languages, and profile tags. |
Note: In the upper right corner of each profile, there are options to:
- Compare this profile with others
- View repository commit
- View traces for the same process and time frame
- Download the profile
- Open the profile in full page
Timeline view
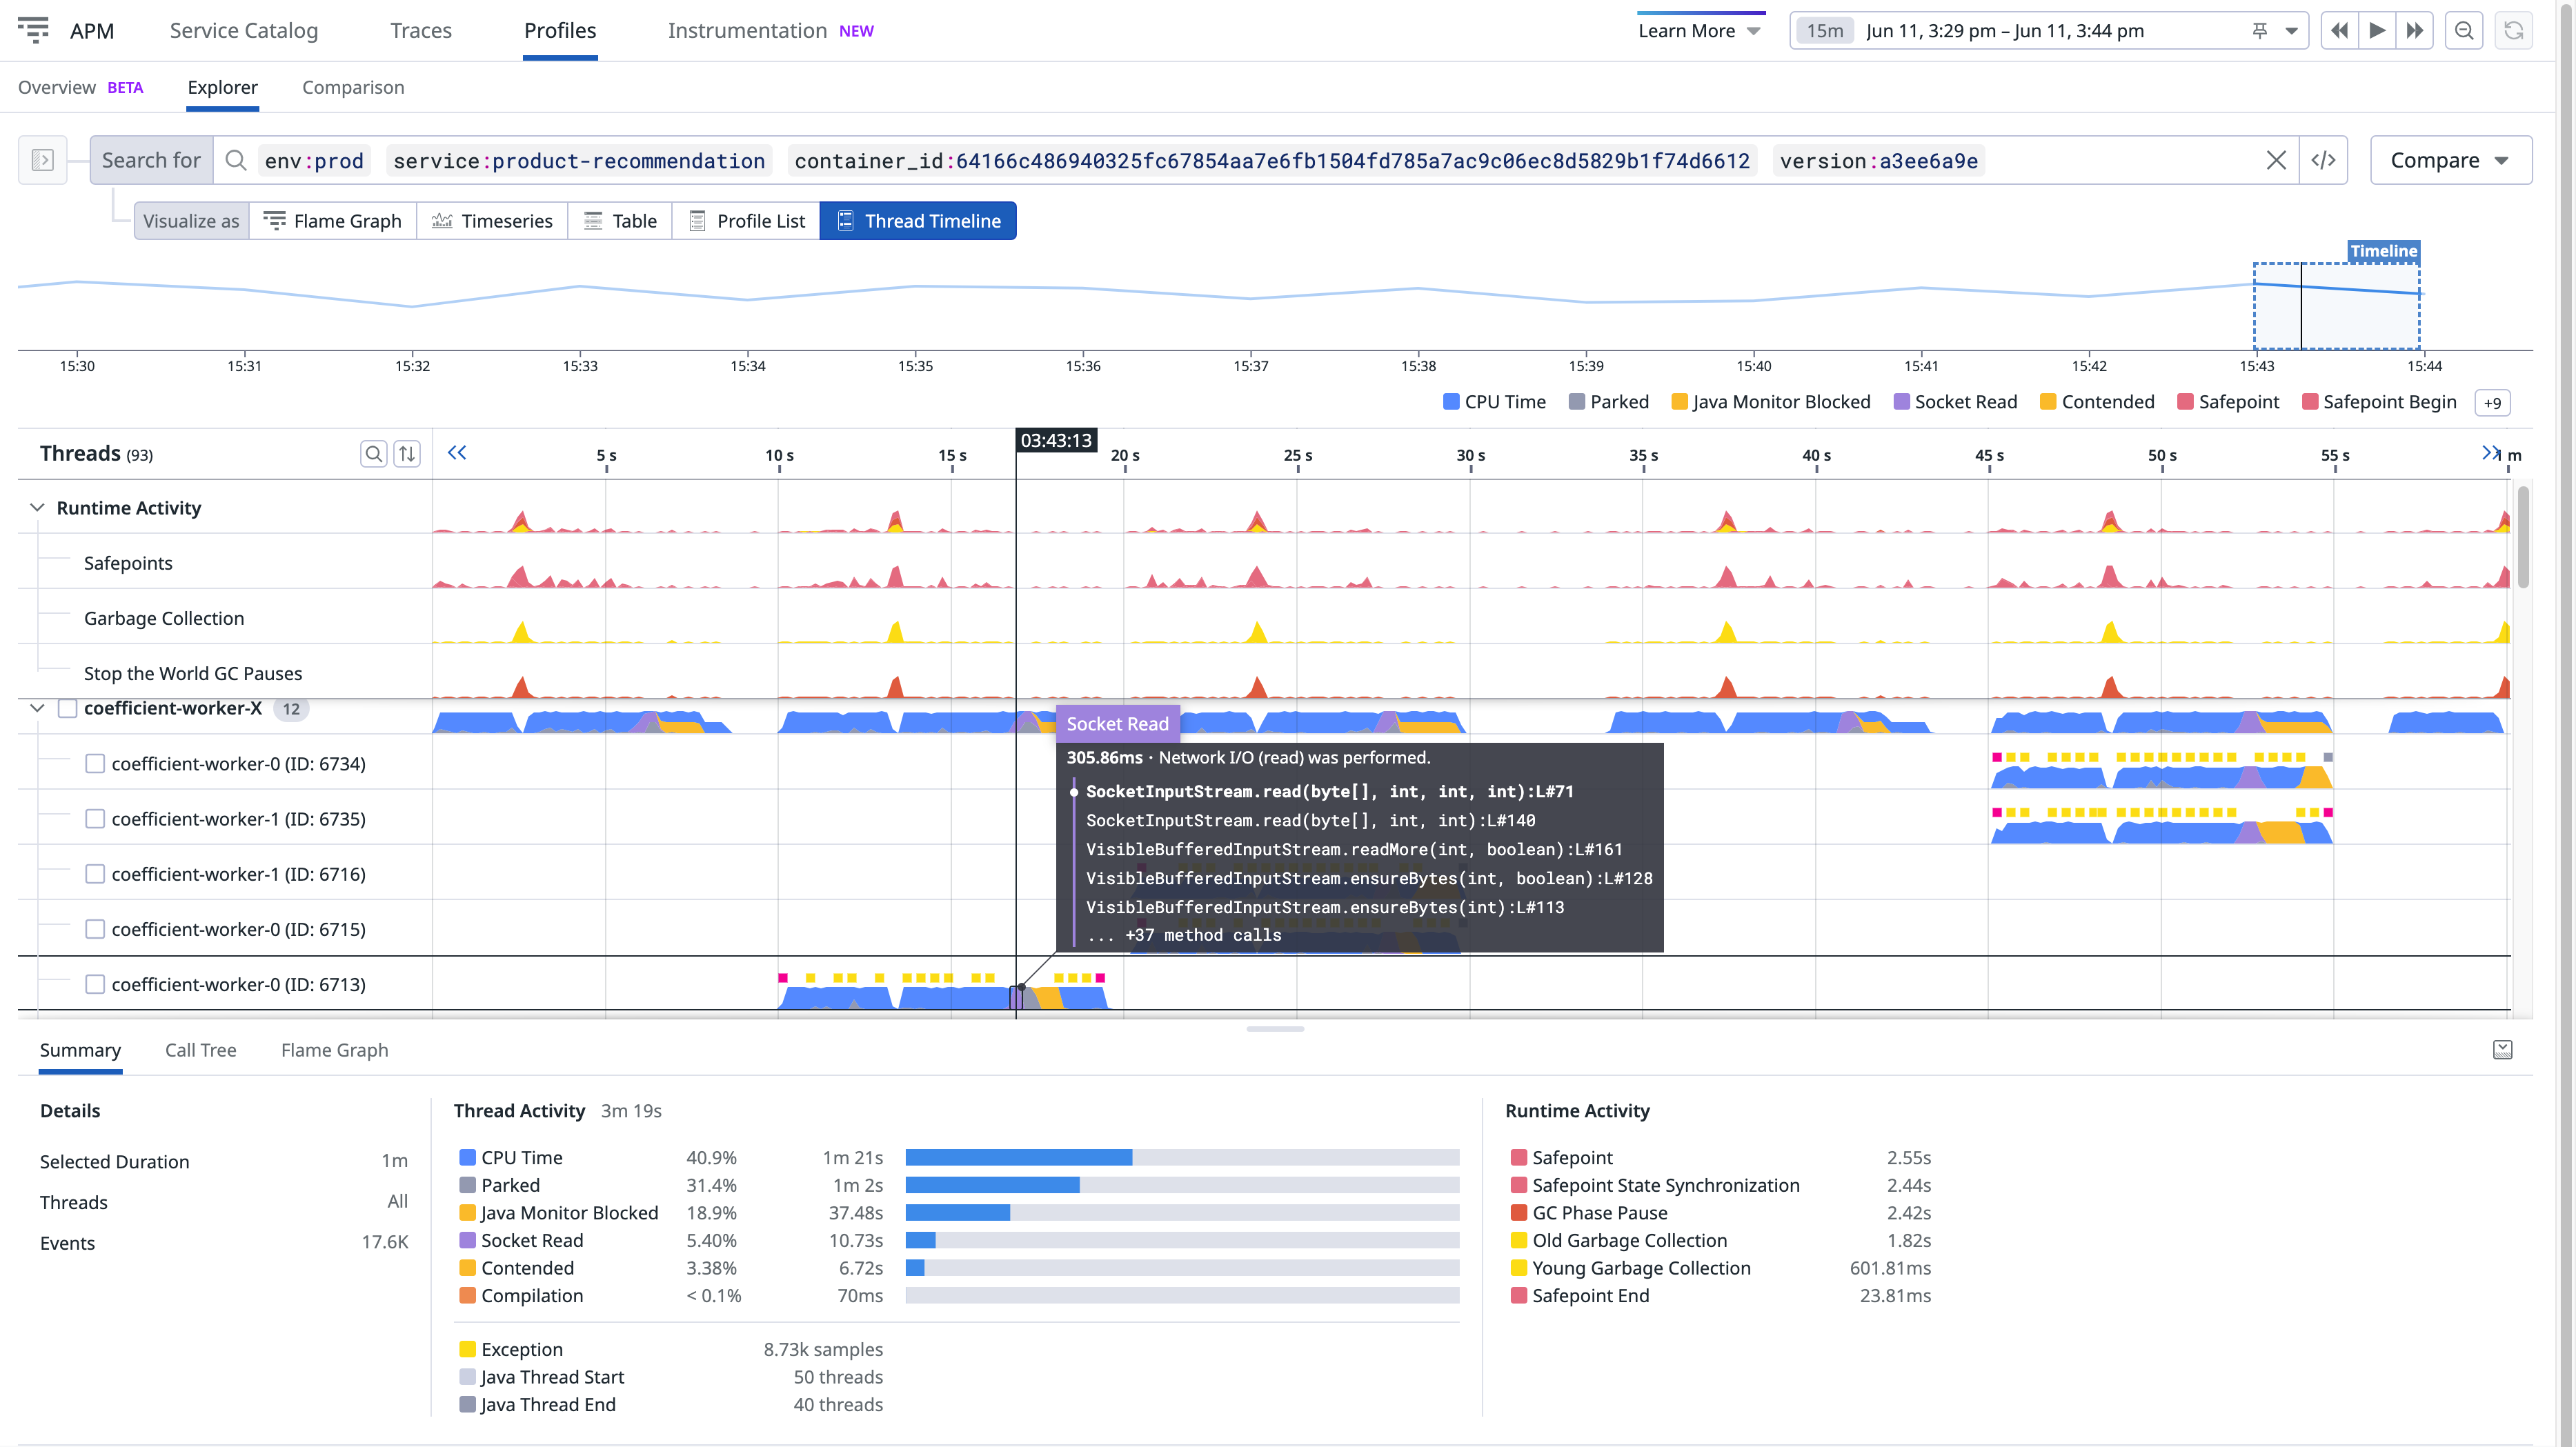
The timeline view is equivalent to the flame graph, with time-based patterns and work distribution over the period of a single profile, a single process in profiling explorer and a trace.
Compared to the flame graph, the timeline view can help you:
- Isolate spiky methods
- Sort out complex interactions between threads
- Surface runtime activity that impacted the process
To access the timeline view:
- Go to APM > Profiles > Explorer.
- Set the Visualize as option to Thread Timeline.
Depending on the runtime and language, the timeline lanes vary:
Each lane represents a thread. Threads from a common pool are grouped together. You can expand the pool to view details for each thread.
Lanes on top are runtime activities that may impact performance.
For additional information about debugging slow p95 requests or timeouts using the timeline, see the blog post Understanding Request Latency with Profiling.
See prerequisites to learn how to enable this feature for Python.
Each lane represents a thread. Threads from a common pool are grouped together. You can expand the pool to view details for each thread.
See prerequisites to learn how to enable this feature for Go.
Each lane represents a goroutine. Goroutines created by the same go statement are grouped together. You can expand the group to view details for each goroutine.
Lanes on top are runtime activities that may impact performance.
For additional information about debugging slow p95 requests or timeouts using the timeline, see the blog post Debug Go Request Latency with Datadog’s Profiling Timeline.
See prerequisites to learn how to enable this feature for Ruby.
Each lane represents a thread. Threads from a common pool are grouped together. You can expand the pool to view details for each thread.
The thread ID is shown as native-thread-id (ruby-object-id) where the native thread ID is Thread#native_thread_id (when available) and the Ruby object ID is Thread#object_id.
Note: The Ruby VM or your operating system might reuse native thread IDs.
See prerequisites to learn how to enable this feature for Node.js.
There is one lane for the JavaScript thread.
There can also be lanes visualizing various kinds of asynchronous activity consisting of DNS requests and TCP connect operations. The number of lanes matches the maximum concurrency of these activities so they can be visualized without overlaps.
Lanes on the top are garbage collector runtime activities that may add extra latency to your request.
Each lane represents a thread. Threads from a common pool are grouped together. You can expand the pool to view details for each thread.
Lanes on top are runtime activities that may impact performance.
The thread ID is shown as <unique-id> [#OS-thread-id].
Note: Your operating system might reuse thread IDs.
See prerequisites to learn how to enable this feature for PHP.
There is one lane for each PHP thread (in PHP NTS, this is only one lane as there is only one thread per process). Fibers that run in this thread are represented in the same lane.
Lanes on the top are runtime activities that may add extra latency to your request, due to file compilation and garbage collection.


