- 重要な情報
- はじめに
- Datadog
- Datadog サイト
- DevSecOps
- AWS Lambda のサーバーレス
- エージェント
- インテグレーション
- コンテナ
- ダッシュボード
- アラート設定
- ログ管理
- トレーシング
- プロファイラー
- タグ
- API
- Service Catalog
- Session Replay
- Continuous Testing
- Synthetic モニタリング
- Incident Management
- Database Monitoring
- Cloud Security Management
- Cloud SIEM
- Application Security Management
- Workflow Automation
- CI Visibility
- Test Visibility
- Intelligent Test Runner
- Code Analysis
- Learning Center
- Support
- 用語集
- Standard Attributes
- ガイド
- インテグレーション
- エージェント
- OpenTelemetry
- 開発者
- 認可
- DogStatsD
- カスタムチェック
- インテグレーション
- Create an Agent-based Integration
- Create an API Integration
- Create a Log Pipeline
- Integration Assets Reference
- Build a Marketplace Offering
- Create a Tile
- Create an Integration Dashboard
- Create a Recommended Monitor
- Create a Cloud SIEM Detection Rule
- OAuth for Integrations
- Install Agent Integration Developer Tool
- サービスのチェック
- IDE インテグレーション
- コミュニティ
- ガイド
- API
- モバイルアプリケーション
- CoScreen
- Cloudcraft
- アプリ内
- Service Management
- インフラストラクチャー
- アプリケーションパフォーマンス
- APM
- Continuous Profiler
- データベース モニタリング
- Data Streams Monitoring
- Data Jobs Monitoring
- Digital Experience
- Software Delivery
- CI Visibility (CI/CDの可視化)
- CD Visibility
- Test Visibility
- Intelligent Test Runner
- Code Analysis
- Quality Gates
- DORA Metrics
- セキュリティ
- セキュリティの概要
- Cloud SIEM
- クラウド セキュリティ マネジメント
- Application Security Management
- AI Observability
- ログ管理
- Observability Pipelines(観測データの制御)
- ログ管理
- 管理
Declare an Incident
このページは日本語には対応しておりません。随時翻訳に取り組んでいます。翻訳に関してご質問やご意見ございましたら、お気軽にご連絡ください。
Overview
In the Datadog paradigm, any of the following are appropriate situations for declaring an incident:
- An issue is or may be impacting customers.
- You believe an issue (including an internal one) needs to be addressed as an emergency.
- You don’t know if you should call an incident - notify other people and increase severity appropriately.
You can declare an incident from multiple places within the Datadog platform, such as a graph widget on a dashboard, the Incidents UI, or any alert reporting into Datadog.
From the Incident page
In the Datadog UI, click Declare Incident to create an incident.
The Declare Incident modal displays a collapsible side panel that contains helper text and descriptions for the severities and statuses used by your organization. The helper text and descriptions are customizable in Incident Settings.
From a monitor
You can declare an incident directly from a monitor from the Actions dropdown. Select Declare incident to open an incident creation modal, and the monitor is added into the incident as a signal. You can also add a monitor to an existing incident.
From a Security Signal
Declare an incident directly from a Cloud SIEM or Cloud Security Management Threats signal side panel, by clicking Declare incident or Escalate Investigation. For more information, see Investigate Security Signals for Cloud Security Management.
Declare an incident from an Application Security Management signal through the actions listed in the signal side panel. Click Show all actions and click Declare Incident. For more information, see Investigate Security Signals for Application Security Management.
From a case
Declare an incident from Case Management. From the individual case detail page, click Declare incident to escalate a case to an incident.
From a graph
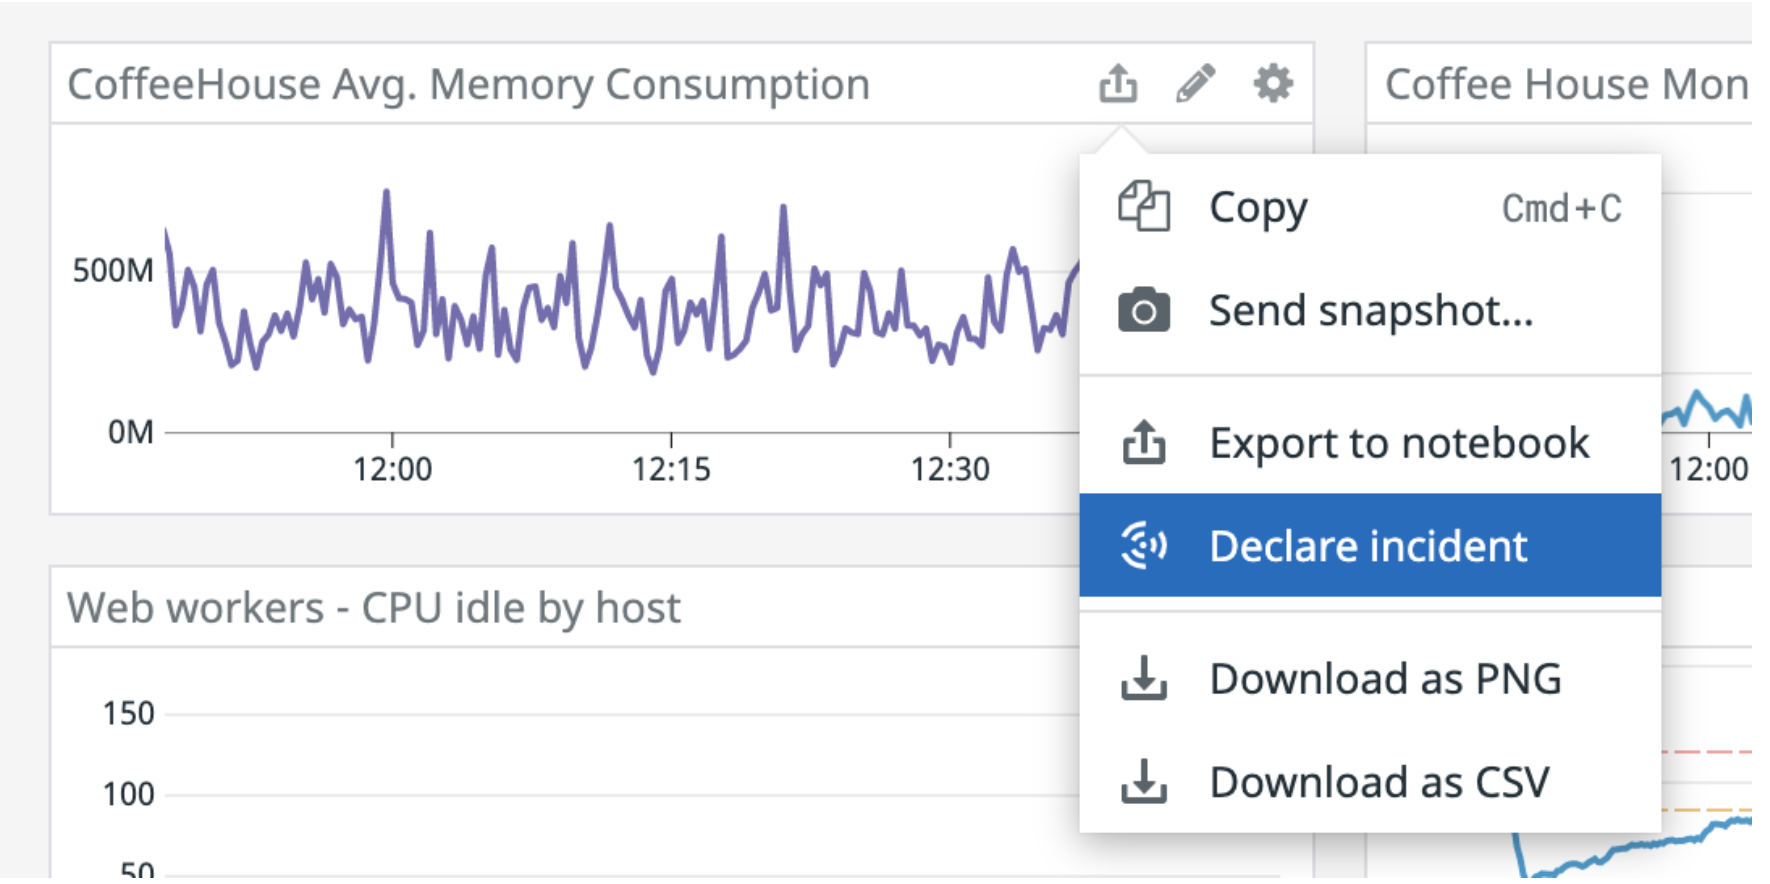
You can declare an incident directly from a graph by clicking the export button on the graph and then clicking Declare incident. The incident creation modal appears, and the graph is added to the incident as a signal.
From a Synthetic test
Create incidents directly from a Synthetic test through the Actions dropdown. Select Declare incident to open an incident creation modal, where a summary of the test is added to your incident timeline, allowing you to pursue the investigation from there.
From the Datadog Clipboard
Use the Datadog Clipboard to gather multiple monitors and graphs and to generate an incident. To declare an incident from the Clipboard, copy a graph you want to investigate and open the Clipboard with the command Cmd/Ctrl + Shift + K. Click Declare Incident or the export icon to add to the incident as a signal.
From Slack
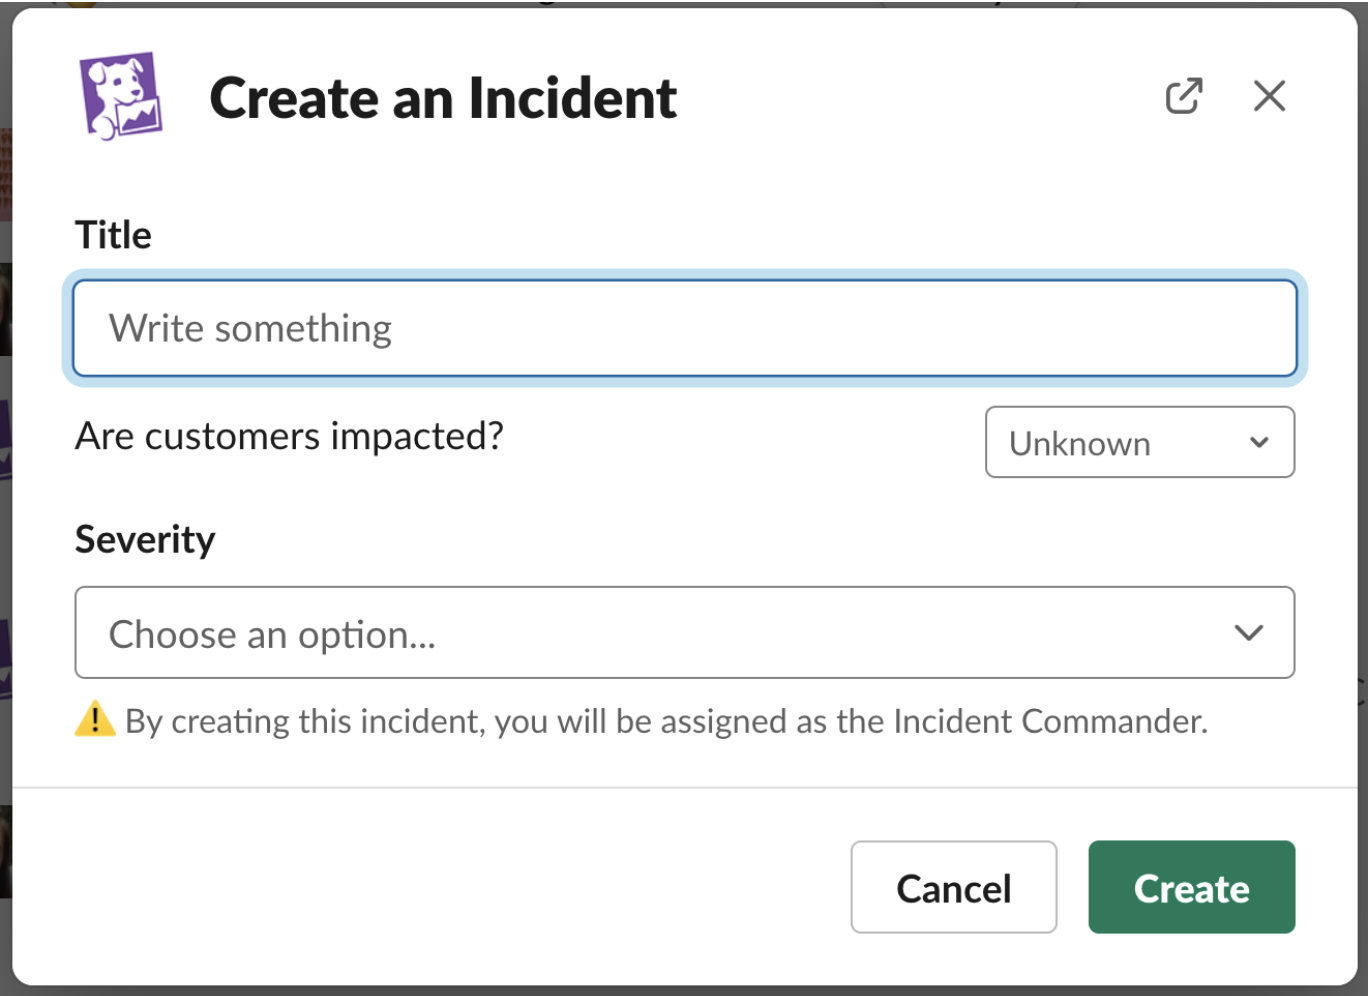
If you have the Datadog integration enabled on Slack, you can declare a new incident with the slash command /datadog incident from any Slack channel.
If the user declaring the incident connected their Slack to their Datadog account, by default, that user is listed as the Incident Commander. The Incident Commander (IC) can be changed later in-app if necessary. If the user declaring an incident is not a member of a Datadog account, then the IC is assigned to a generic Slack app user and can be assigned to another IC in-app.
After you declare an incident from Slack, it generates an incident channel.
What’s next
Add helpful information to your incident and give context to everyone that is involved in the investigation.


