- Essentials
- Getting Started
- Datadog
- Datadog Site
- DevSecOps
- Serverless for AWS Lambda
- Agent
- Integrations
- Containers
- Dashboards
- Monitors
- Logs
- APM Tracing
- Profiler
- Tags
- API
- Service Catalog
- Session Replay
- Continuous Testing
- Synthetic Monitoring
- Incident Management
- Database Monitoring
- Cloud Security Management
- Cloud SIEM
- Application Security Management
- Workflow Automation
- CI Visibility
- Test Visibility
- Test Impact Analysis
- Code Analysis
- Learning Center
- Support
- Glossary
- Standard Attributes
- Guides
- Agent
- Integrations
- OpenTelemetry
- Developers
- Authorization
- DogStatsD
- Custom Checks
- Integrations
- Create an Agent-based Integration
- Create an API Integration
- Create a Log Pipeline
- Integration Assets Reference
- Build a Marketplace Offering
- Create a Tile
- Create an Integration Dashboard
- Create a Recommended Monitor
- Create a Cloud SIEM Detection Rule
- OAuth for Integrations
- Install Agent Integration Developer Tool
- Service Checks
- IDE Plugins
- Community
- Guides
- API
- Datadog Mobile App
- CoScreen
- Cloudcraft
- In The App
- Dashboards
- Notebooks
- DDSQL Editor
- Sheets
- Monitors and Alerting
- Infrastructure
- Metrics
- Watchdog
- Bits AI
- Service Catalog
- API Catalog
- Error Tracking
- Service Management
- Infrastructure
- Application Performance
- APM
- Continuous Profiler
- Database Monitoring
- Data Streams Monitoring
- Data Jobs Monitoring
- Digital Experience
- Real User Monitoring
- Product Analytics
- Synthetic Testing and Monitoring
- Continuous Testing
- Software Delivery
- CI Visibility
- CD Visibility
- Test Optimization
- Code Analysis
- Quality Gates
- DORA Metrics
- Security
- Security Overview
- Cloud SIEM
- Cloud Security Management
- Application Security Management
- AI Observability
- Log Management
- Observability Pipelines
- Log Management
- Administration
LLM Observability
LLM Observability is not available in the selected site () at this time.
Overview
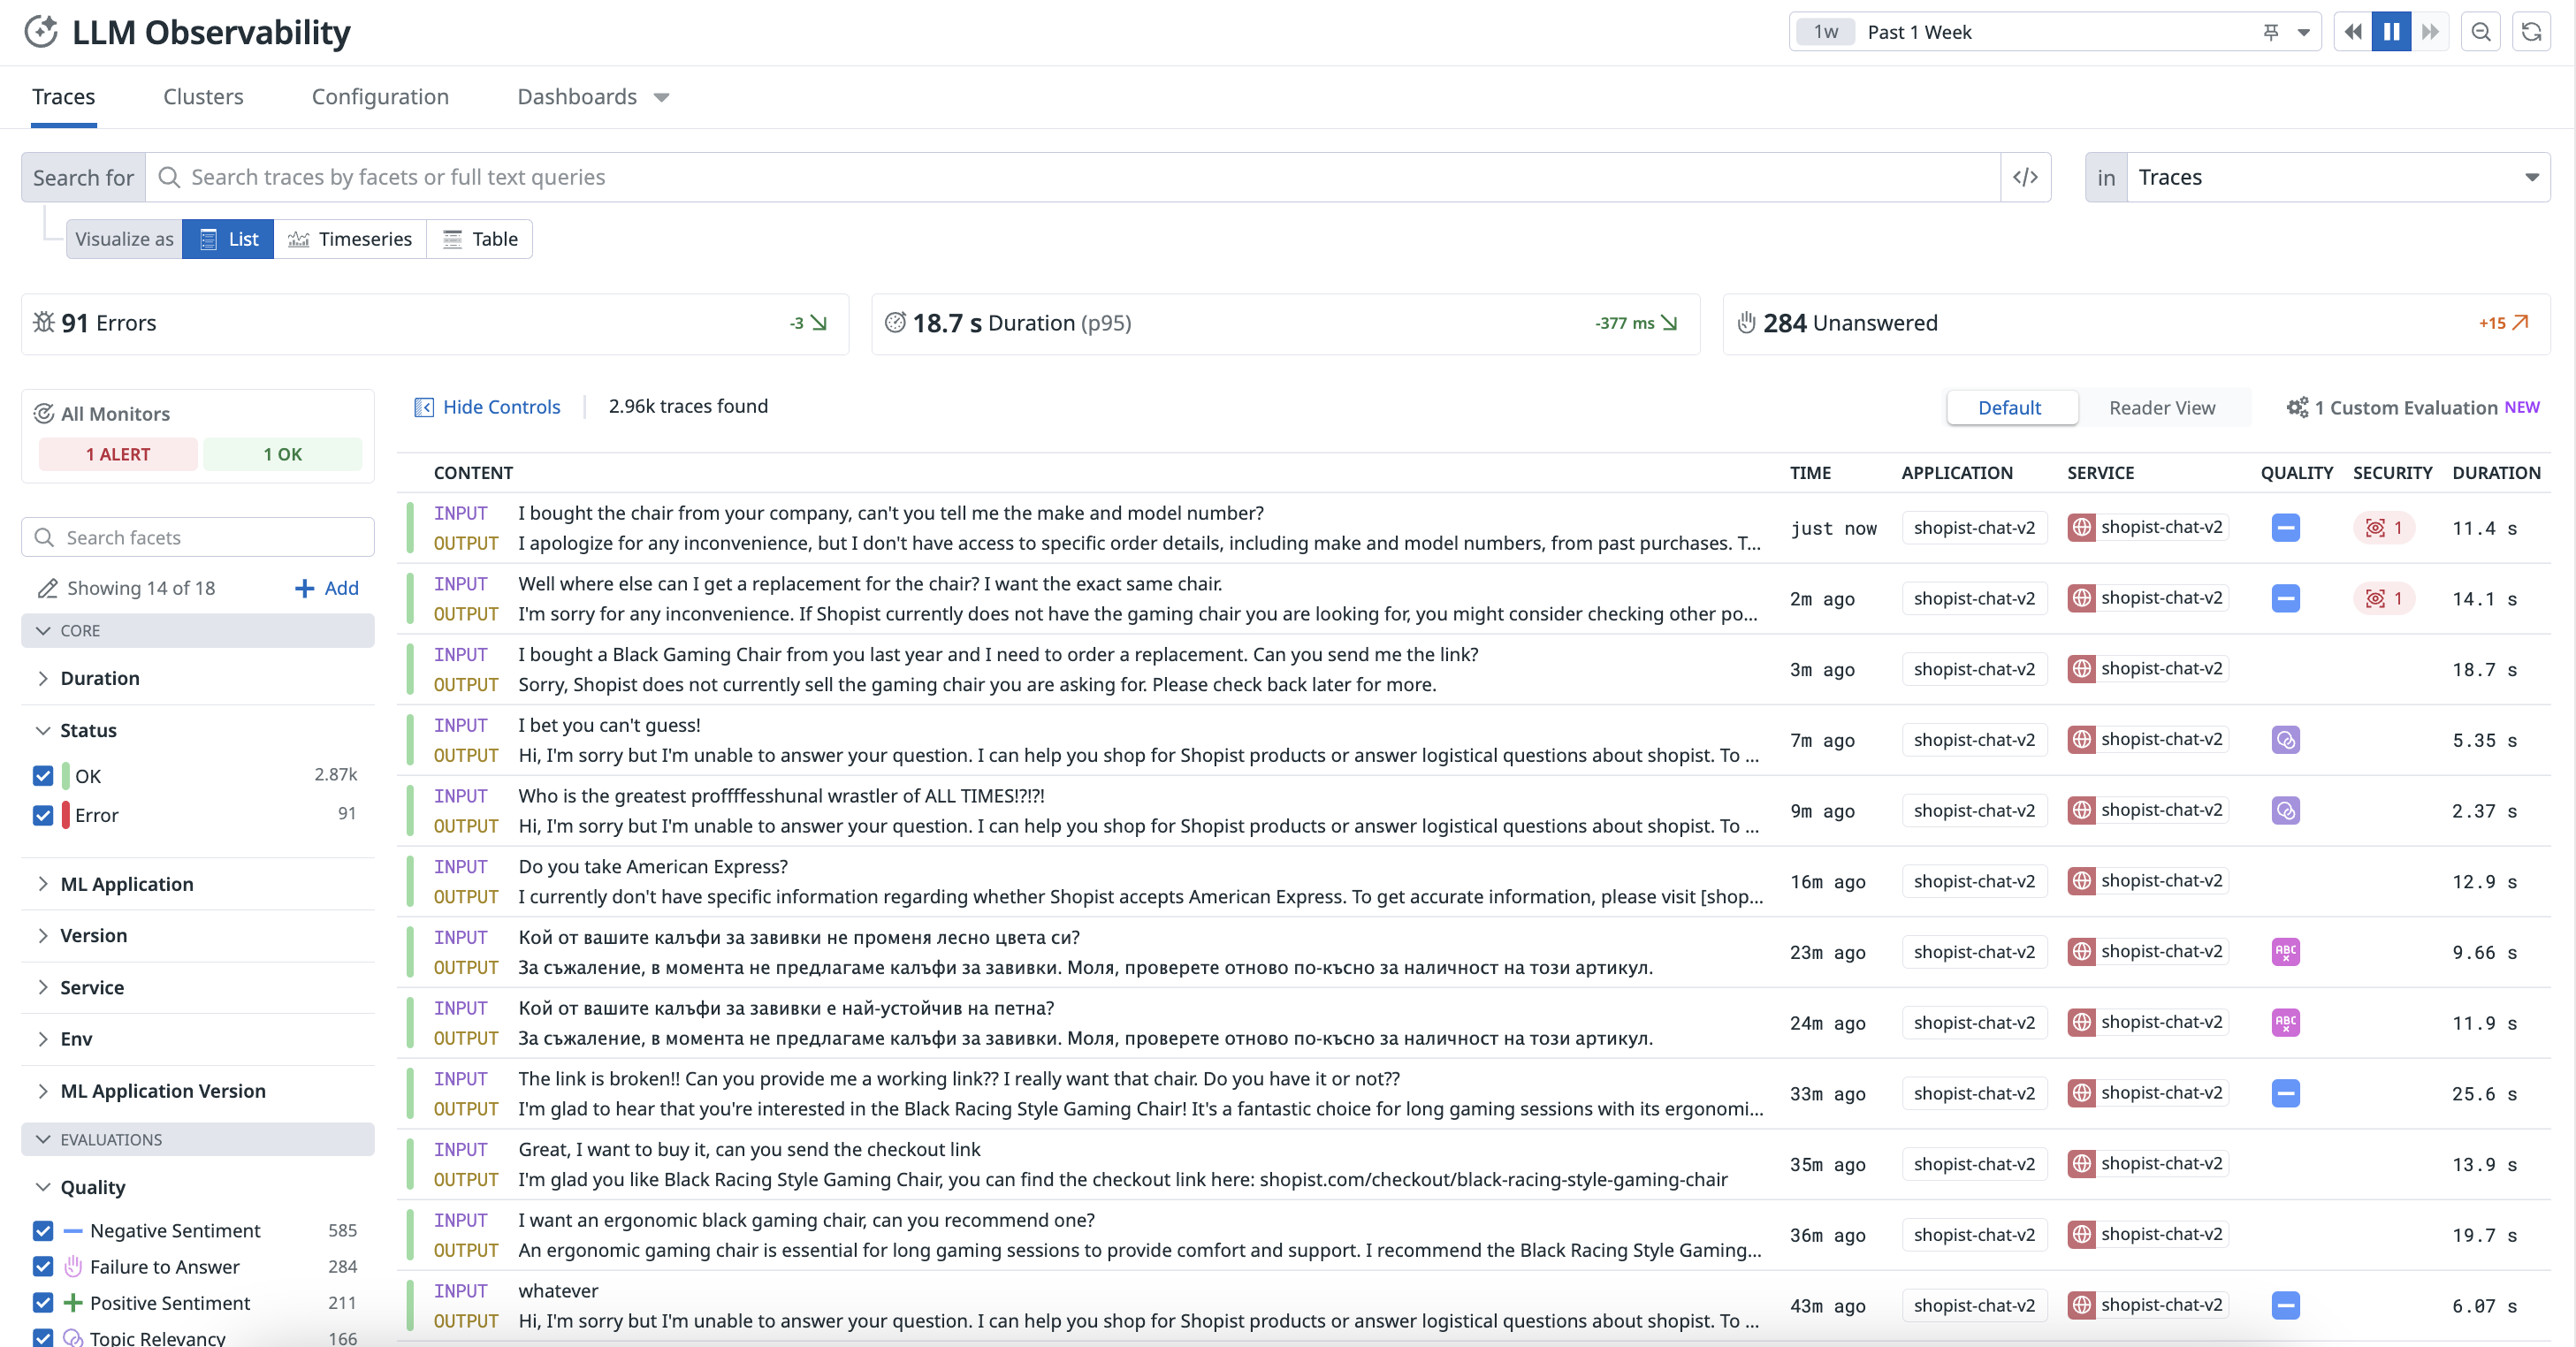
With LLM Observability, you can monitor, troubleshoot, and evaluate your LLM-powered applications, such as chatbots. You can investigate the root cause of issues, monitor operational performance, and evaluate the quality, privacy, and safety of your LLM applications.
Each request fulfilled by your application is represented as a trace on the LLM Observability page in Datadog.
A trace can represent:
- An individual LLM inference, including tokens, error information, and latency
- A predetermined LLM workflow, which is a grouping of LLM calls and their contextual operations, such as tool calls or preprocessing steps
- A dynamic LLM workflow executed by an LLM agent
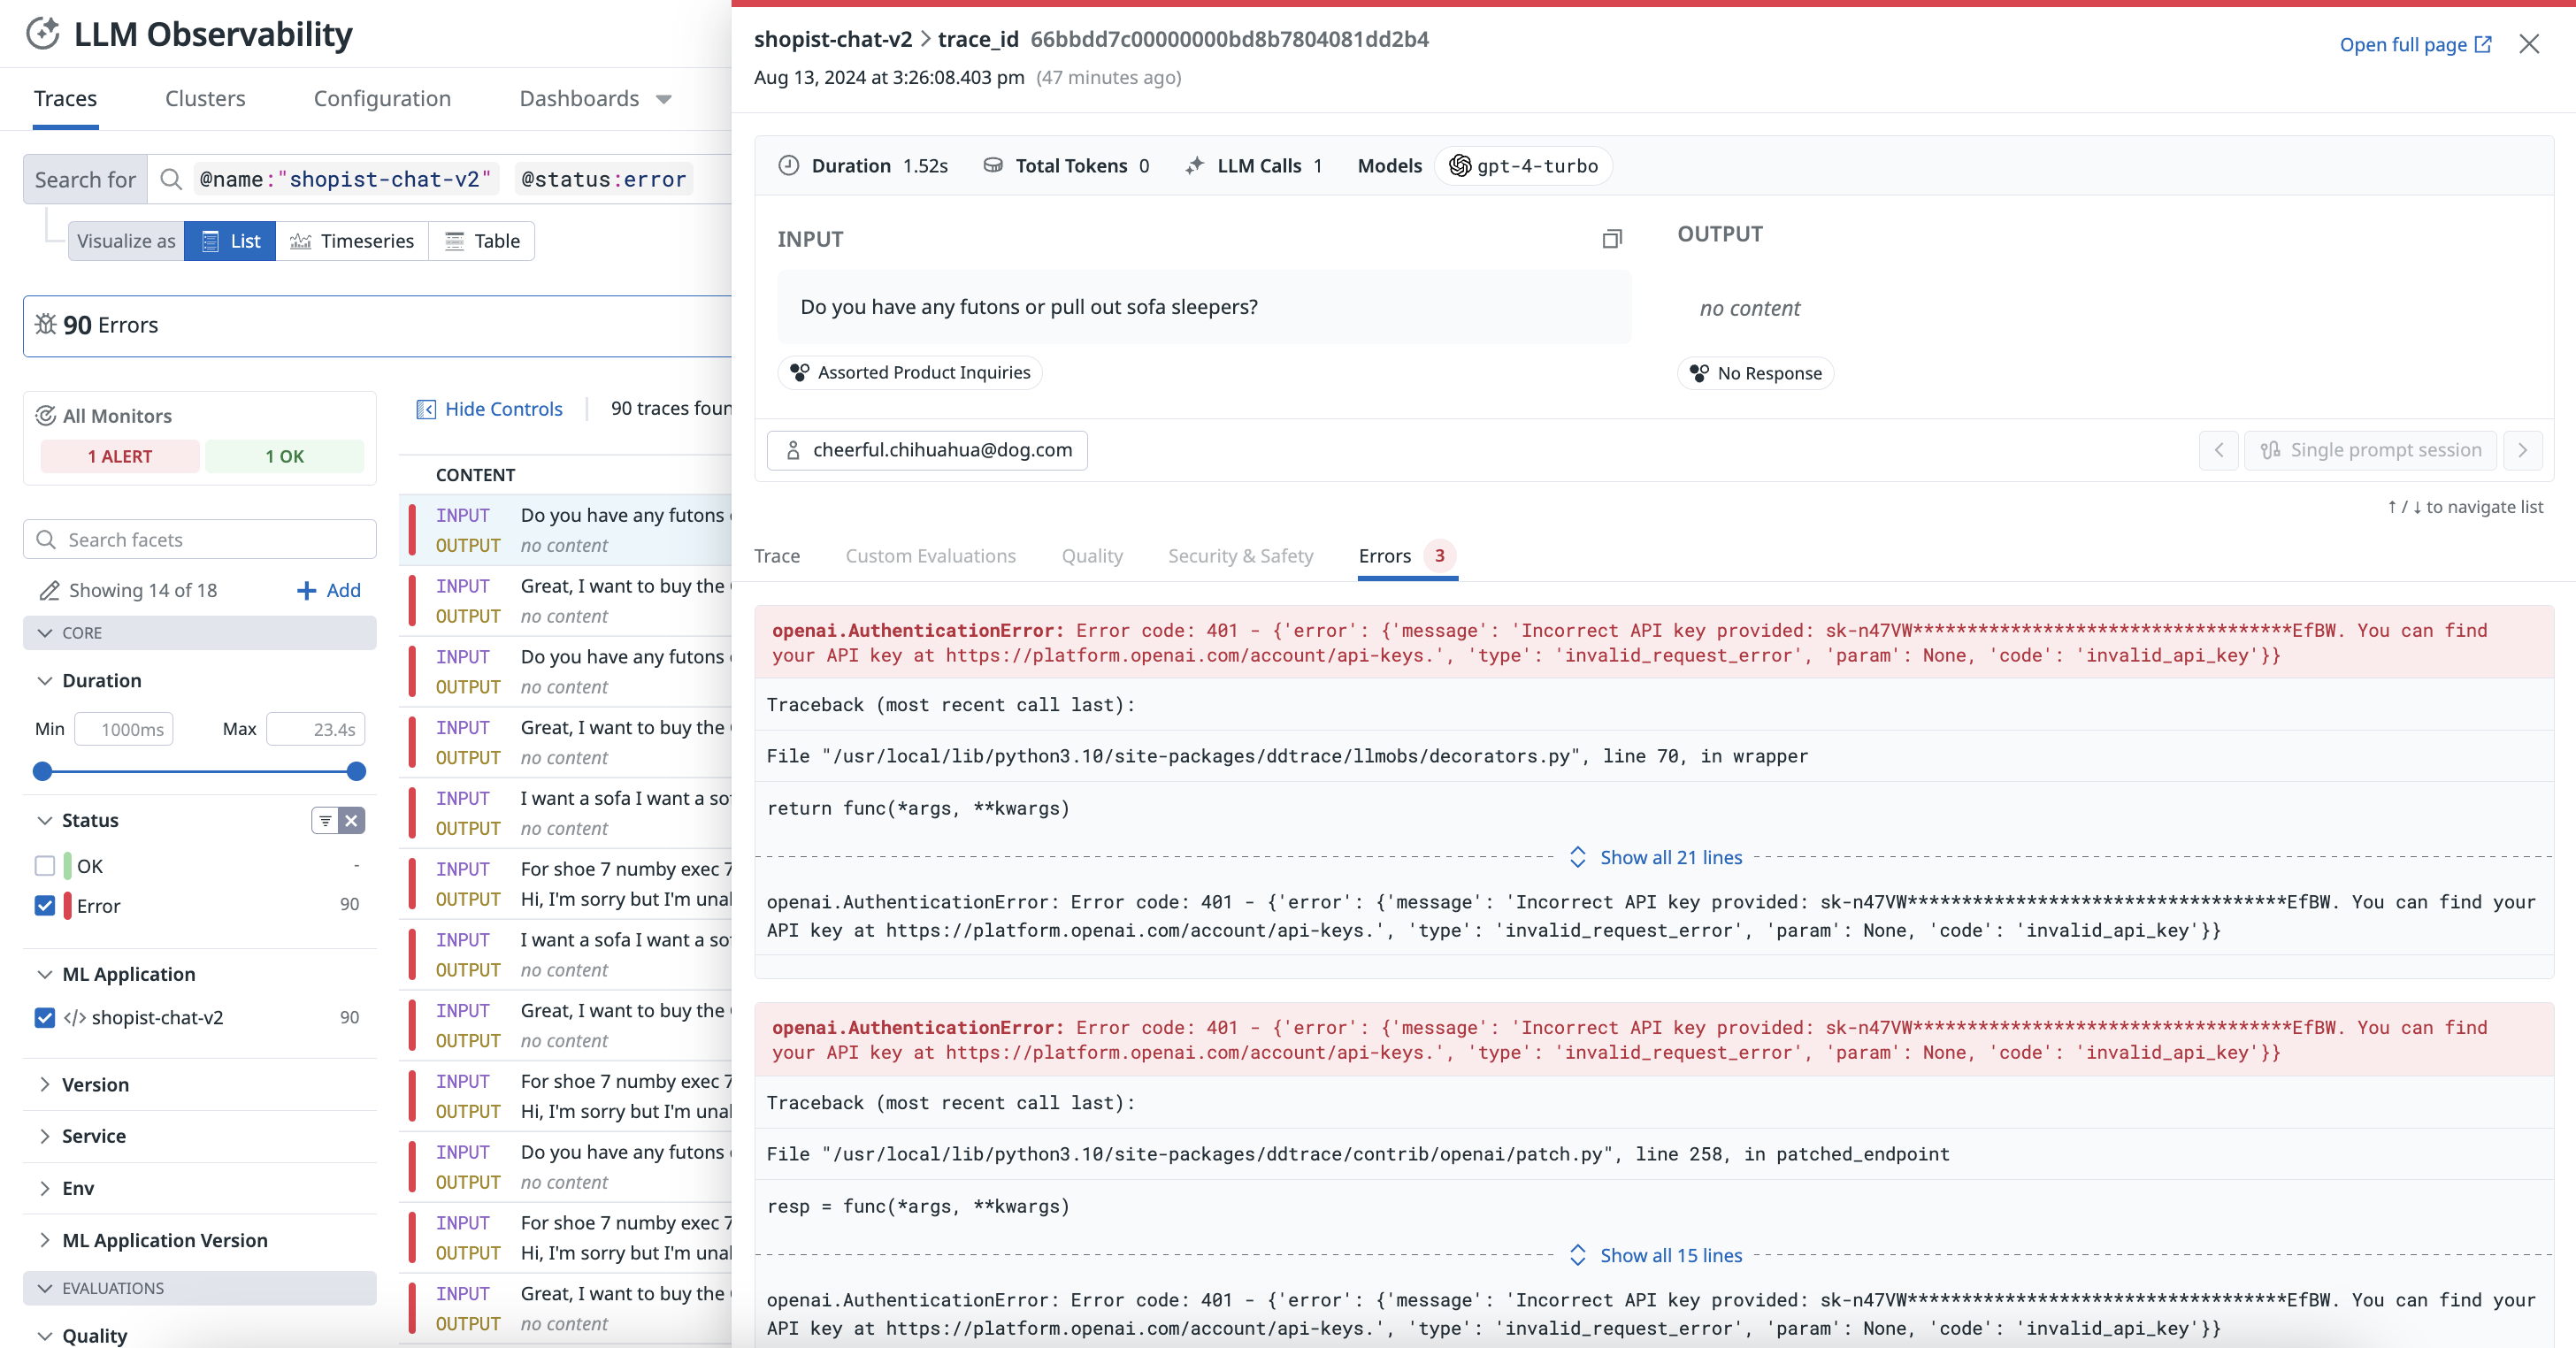
Each trace contains spans representing each choice made by an agent or each step of a given workflow. A given trace can also include input and output, latency, privacy issues, errors, and more. For more information, see Terms and Concepts.
Troubleshoot with end-to-end tracing
View every step of your LLM application chains and calls to pinpoint problematic requests and identify the root cause of errors.
Monitor operational metrics and optimize cost
Monitor the cost, latency, performance, and usage trends for all your LLM applications with out-of-the-box dashboards.
Evaluate the quality and effectiveness of your LLM applications
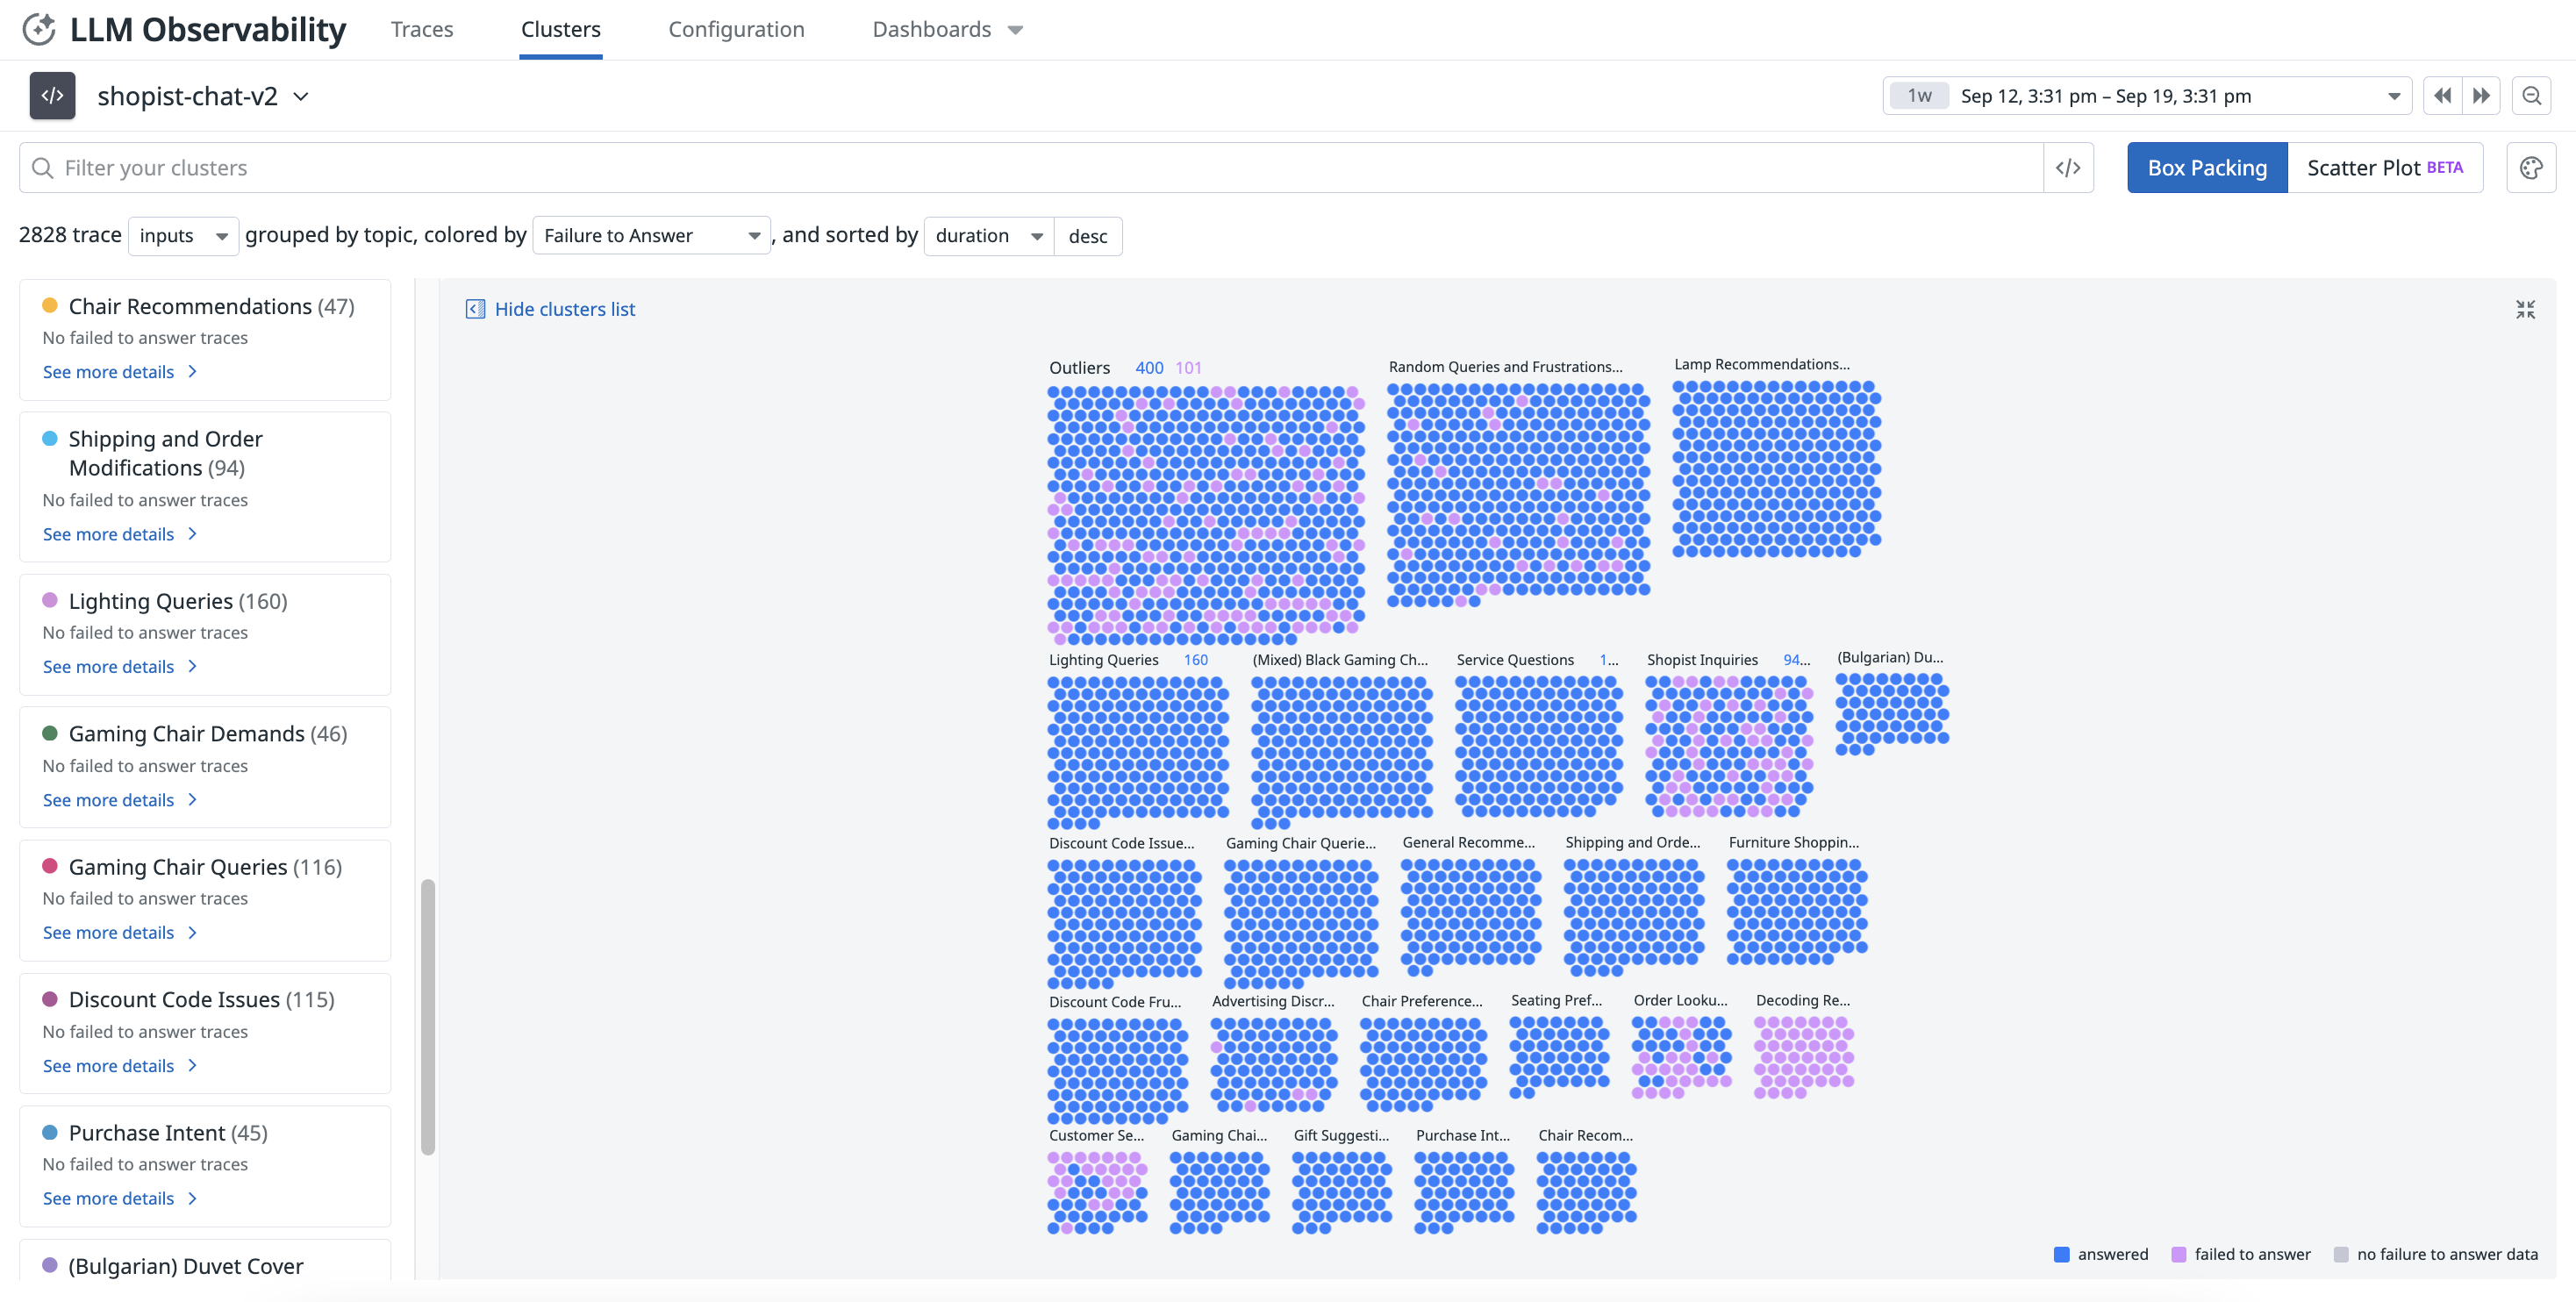
Identify problematic clusters and monitor the quality of responses over time with topical clustering and checks like sentiment, failure to answer, and so on.
Safeguard sensitive data and identify malicious users
Automatically scan and redact any sensitive data in your AI applications and identify prompt injections, among other evaluations.
Use integrations with LLM Observability
The LLM Observability SDK for Python integrates with frameworks such as OpenAI, LangChain, AWS Bedrock, and Anthropic. It automatically traces and annotate LLM calls, capturing latency, errors, and token usage metrics—without code changes.
Datadog offers a variety of artificial intelligence (AI) and machine learning (ML) capabilities. The AI/ML integrations on the Integrations page and the Datadog Marketplace are platform-wide Datadog functionalities.
For example, APM offers a native integration with OpenAI for monitoring your OpenAI usage, while Infrastructure Monitoring offers an integration with NVIDIA DCGM Exporter for monitoring compute-intensive AI workloads. These integrations are different from the LLM Observability offering.
For example, APM offers a native integration with OpenAI for monitoring your OpenAI usage, while Infrastructure Monitoring offers an integration with NVIDIA DCGM Exporter for monitoring compute-intensive AI workloads. These integrations are different from the LLM Observability offering.
For more information, see the Auto Instrumentation documentation.
Ready to start?
By using LLM Observability, you acknowledge that Datadog is authorized to share your company's data with OpenAI LLC for the purpose of providing and improving LLM Observability. OpenAI will not use your data for training or tuning purposes. If you have any questions or want to opt out of features that depend on OpenAI, reach out to your account representative.
See the Setup documentation for instructions on instrumenting your LLM application or follow the Trace an LLM Application guide to generate a trace using the LLM Observability SDK for Python.
Further Reading
Additional helpful documentation, links, and articles:


