- Essentials
- Getting Started
- Datadog
- Datadog Site
- DevSecOps
- Serverless for AWS Lambda
- Agent
- Integrations
- Containers
- Dashboards
- Monitors
- Logs
- APM Tracing
- Profiler
- Tags
- API
- Service Catalog
- Session Replay
- Continuous Testing
- Synthetic Monitoring
- Incident Management
- Database Monitoring
- Cloud Security Management
- Cloud SIEM
- Application Security Management
- Workflow Automation
- CI Visibility
- Test Visibility
- Test Impact Analysis
- Code Analysis
- Learning Center
- Support
- Glossary
- Standard Attributes
- Guides
- Agent
- Integrations
- OpenTelemetry
- Developers
- Authorization
- DogStatsD
- Custom Checks
- Integrations
- Create an Agent-based Integration
- Create an API Integration
- Create a Log Pipeline
- Integration Assets Reference
- Build a Marketplace Offering
- Create a Tile
- Create an Integration Dashboard
- Create a Recommended Monitor
- Create a Cloud SIEM Detection Rule
- OAuth for Integrations
- Install Agent Integration Developer Tool
- Service Checks
- IDE Plugins
- Community
- Guides
- API
- Datadog Mobile App
- CoScreen
- Cloudcraft
- In The App
- Dashboards
- Notebooks
- DDSQL Editor
- Sheets
- Monitors and Alerting
- Infrastructure
- Metrics
- Watchdog
- Bits AI
- Service Catalog
- API Catalog
- Error Tracking
- Service Management
- Infrastructure
- Application Performance
- APM
- Continuous Profiler
- Database Monitoring
- Data Streams Monitoring
- Data Jobs Monitoring
- Digital Experience
- Real User Monitoring
- Product Analytics
- Synthetic Testing and Monitoring
- Continuous Testing
- Software Delivery
- CI Visibility
- CD Visibility
- Test Optimization
- Code Analysis
- Quality Gates
- DORA Metrics
- Security
- Security Overview
- Cloud SIEM
- Cloud Security Management
- Application Security Management
- AI Observability
- Log Management
- Observability Pipelines
- Log Management
- Administration
Historical Metrics Ingestion
Overview
Enabling Historical Metrics Ingestion allows you to collect metric values with timestamps older than one hour from the time of submission, but no older than your total metric retention period (default of 15 months).
Having Historical Metrics Ingestion enabled on your metrics can be helpful for a variety of use cases such as recovering from an outage, correcting erroneous values, and managing IoT delays.
What is Historical Metrics Ingestion?
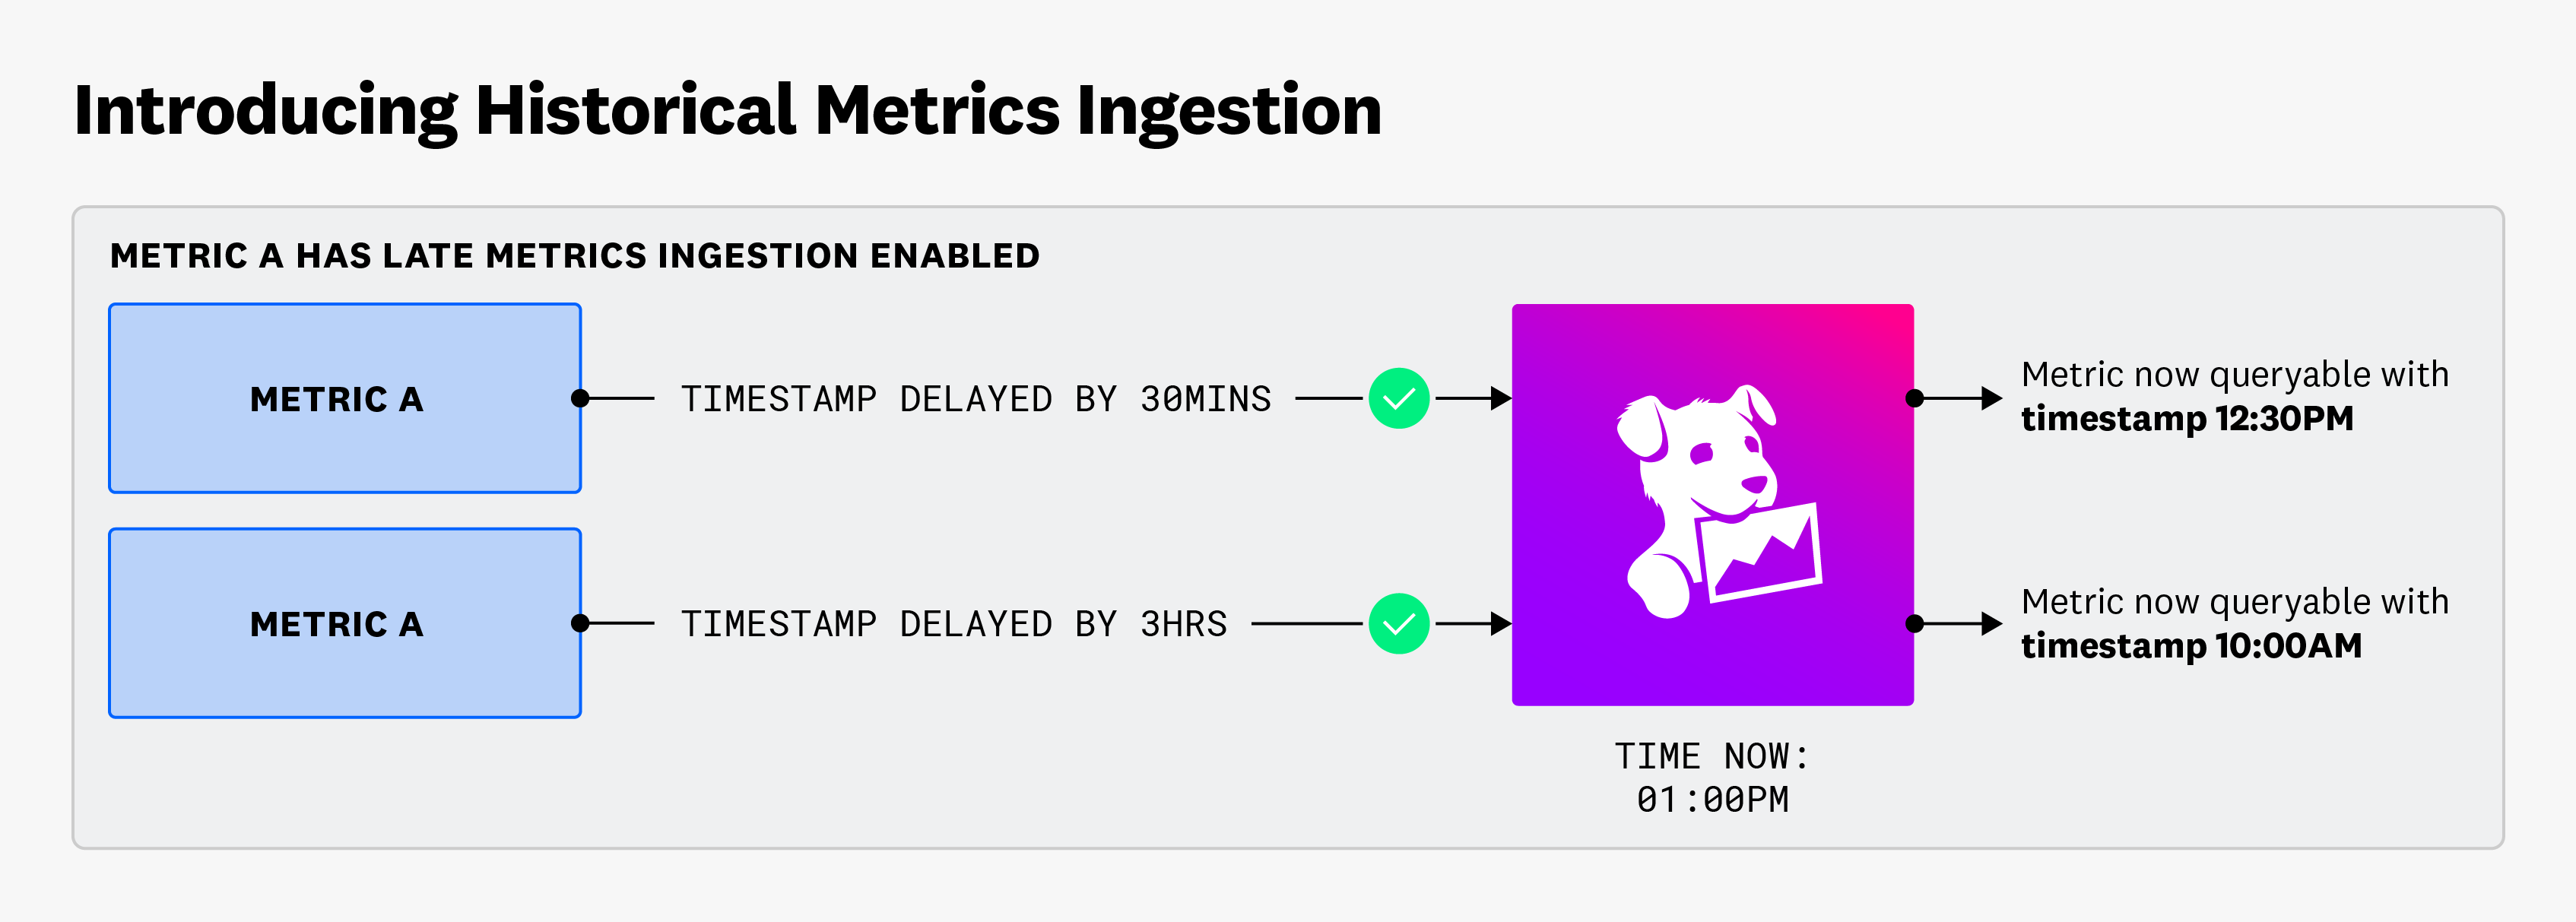
Datadog classifies historical metrics as metric points with timestamps that are older than an hour relative to the time of submission. If Historical Metrics Ingestion is not enabled, a metric’s values older than an hour from submission are not ingested.
For example, your metric (exampleMetricA) emits a value to Datadog at 1:00 PM EST, and the timestamp on that value is 10:00 AM EST. This metric value is classified as historical because it has a timestamp 3 hours older relative to the time of submission.
With Historical Metrics Ingestion enabled, if you submit multiple values with the same timestamp and same tag-value combination to Datadog, Datadog preserves the most recently submitted value. That is, If within the same timestamp, you submit a metric with a value of X, and also send that metric with a value of Y, whichever value is the most recently submitted will be preserved.
You can start ingesting historical metric values by enabling Historical Metrics Ingestion on the Metrics Summary Page for counts, rates, and gauges metric types.
Note: Historical Metrics Ingestion is not available for distribution metrics.
Configuration
To enable the ingestion of historical metrics for a specific metric:
- Navigate to the Metrics Summary Page.
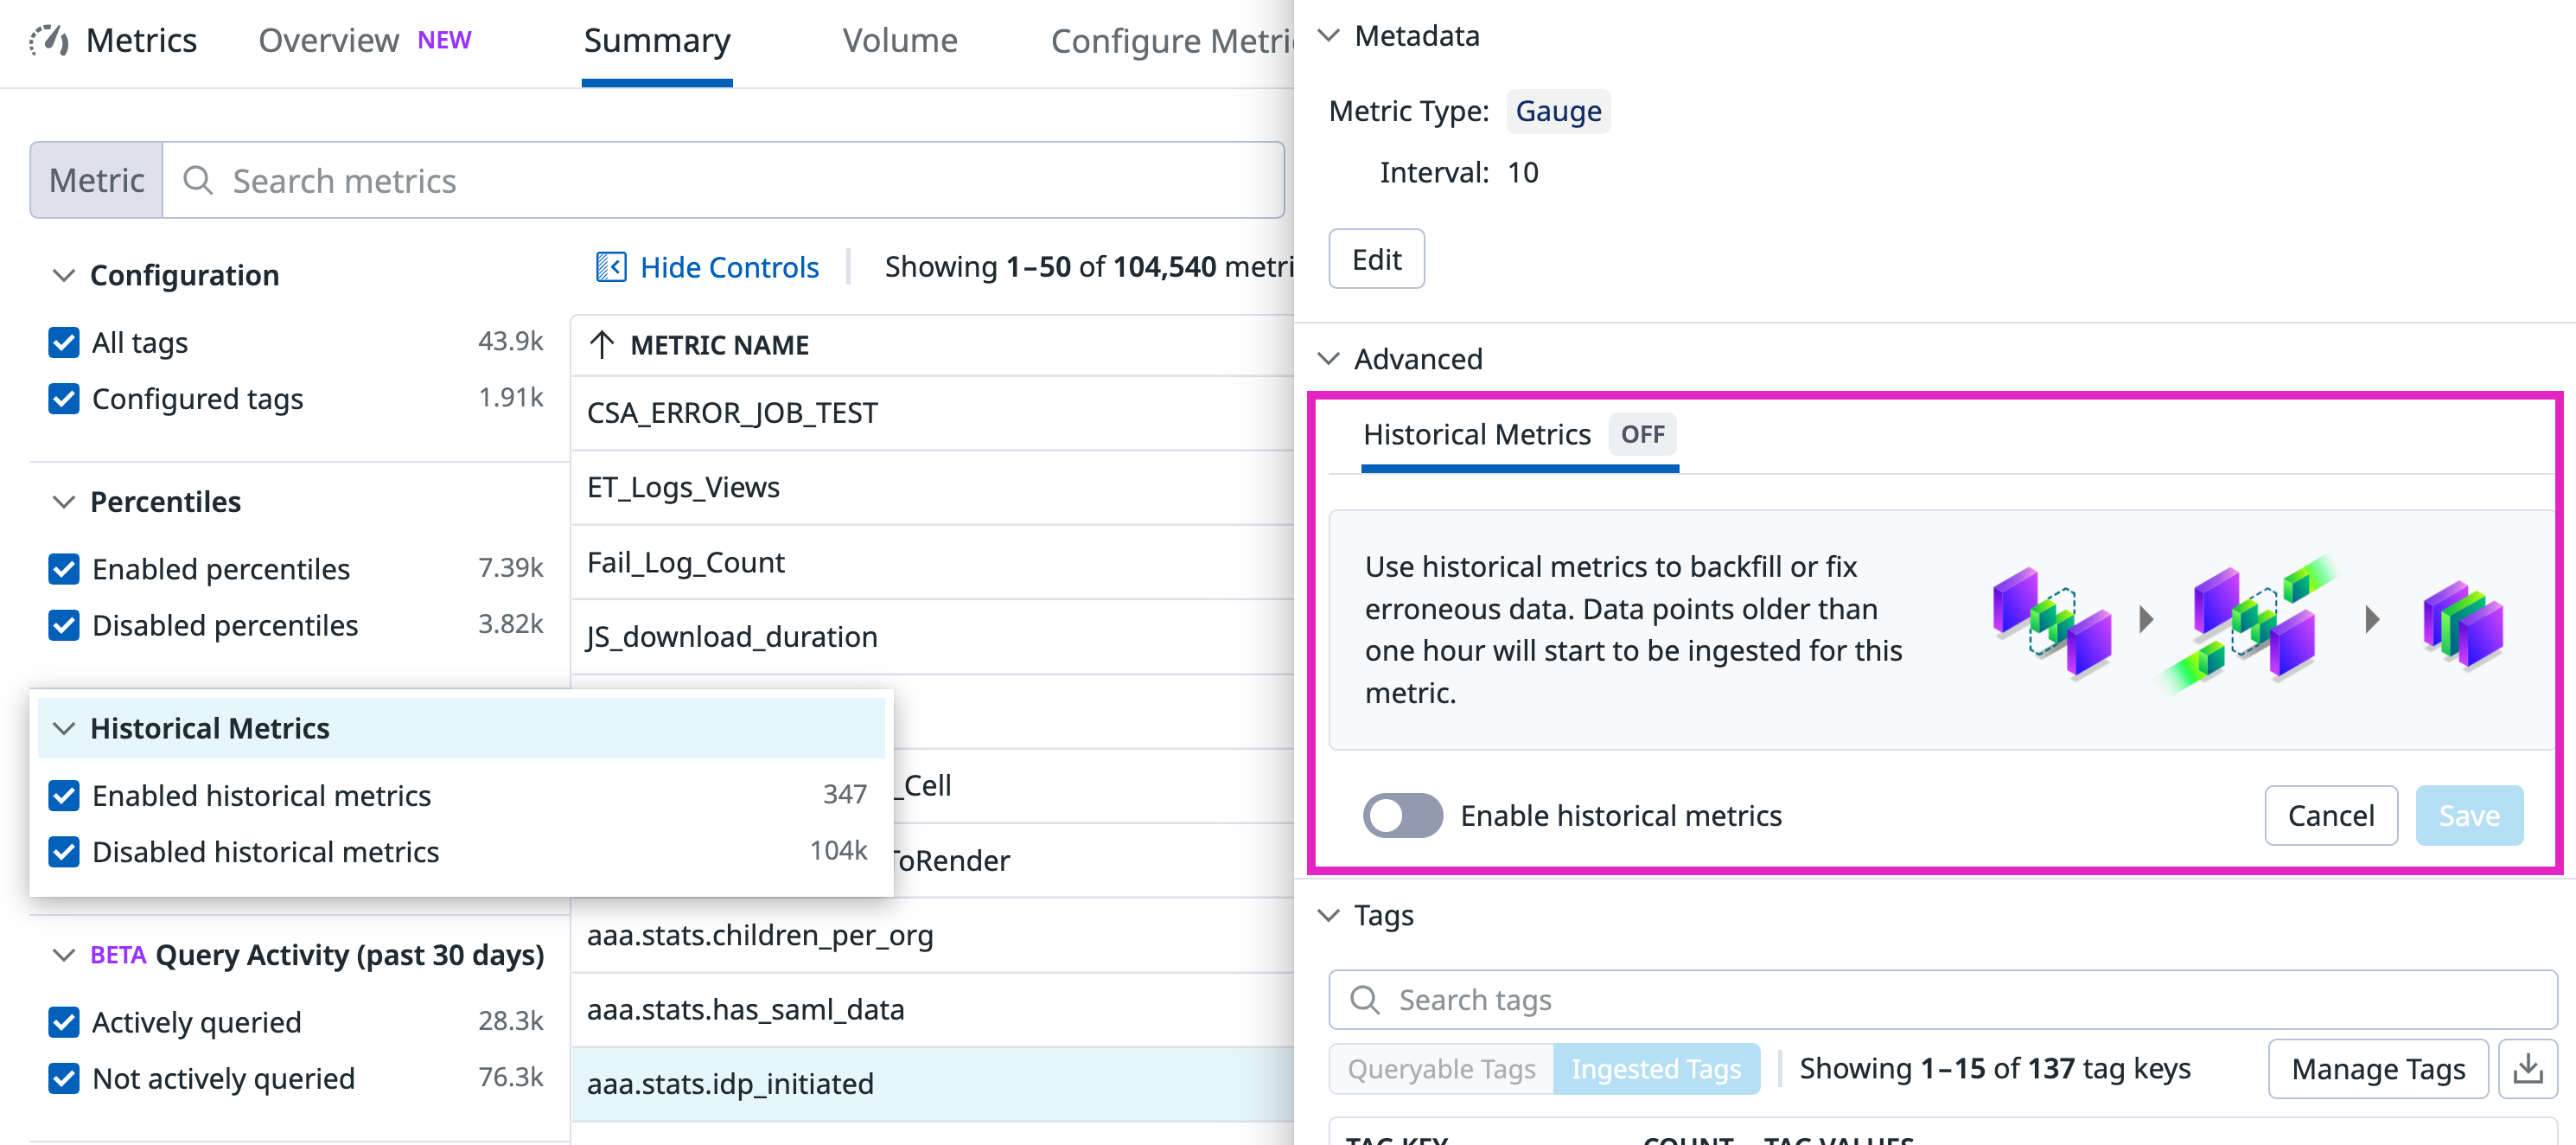
- Click on the metric name you want to enable Historical Metrics Ingestion for to open the metric’s details side panel.
- Within the Advanced section of the side panel, click Configure.
- Select the Enable historical metrics toggle and press Save.
Bulk configuration for multiple metrics
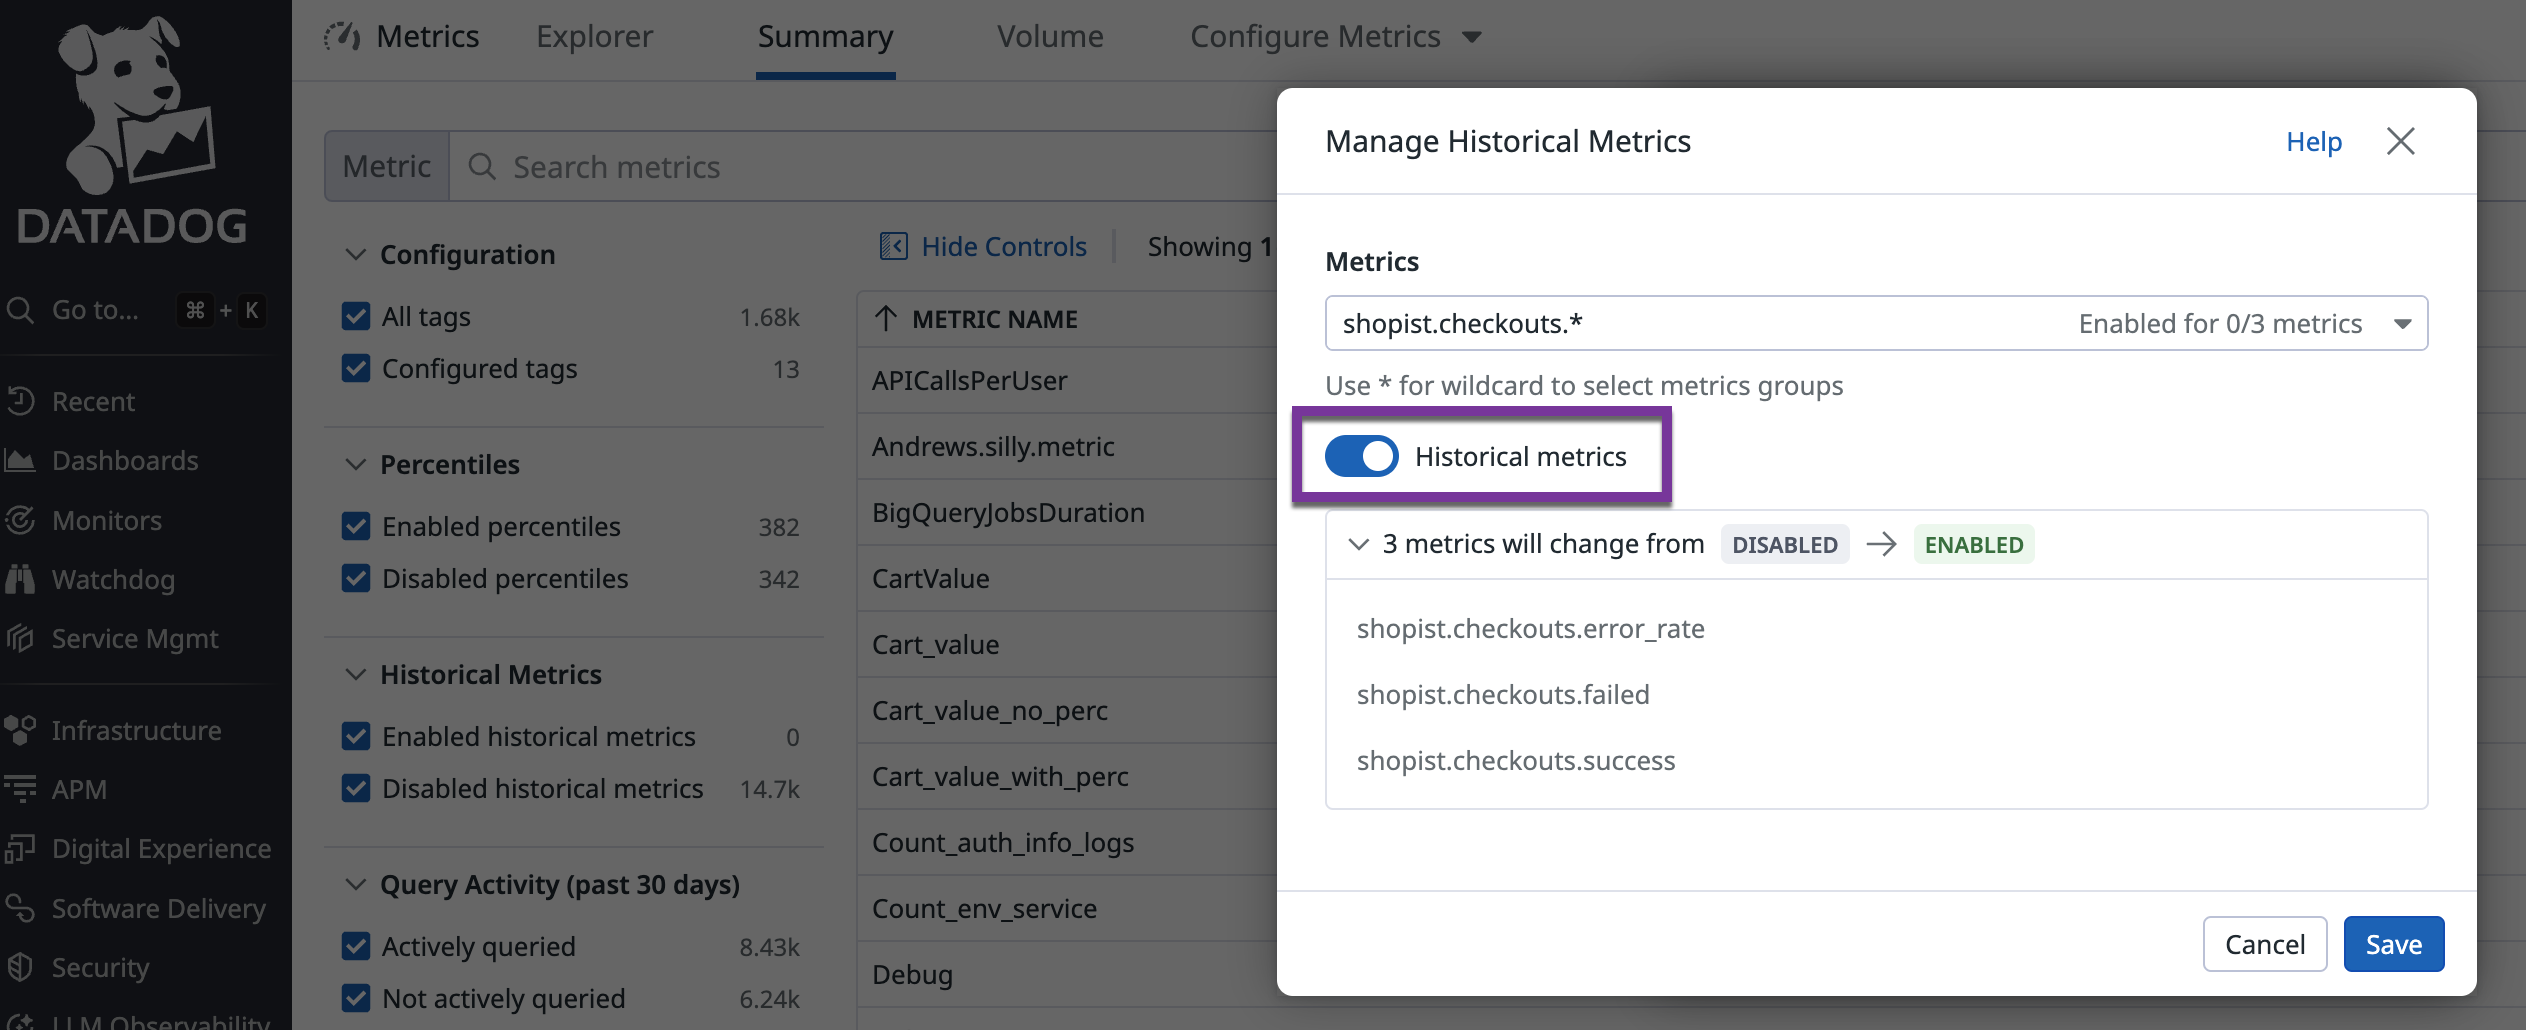
You can enable or disable Historical Metrics Ingestion for multiple metrics at once, rather than having to configure each one individually.
- Navigate to the Metrics Summary Page and click the Configure Metrics dropdown.
- Select Enable historical metrics.
- Specify a metric namespace prefix to select all metrics that match that namespace.
- (Optional) To disable Historical Metrics Ingestion for all metrics in the namespace, click the Historical metrics toggle.
Historical metrics submission
After enabling Historical Metrics Ingestion, you can submit metric values with historical timestamps through the API or through the Agent.
API
With the API, you can submit metric values with historical timestamps in the payload (as long as the metric name has already been enabled to accept historical metrics through the user interface described above).
"""
Submit metrics returns "Payload accepted" response
"""

from datetime import datetime
from datadog_api_client import ApiClient, Configuration
from datadog_api_client.v2.api.metrics_api import MetricsApi
from datadog_api_client.v2.model.metric_intake_type import MetricIntakeType
from datadog_api_client.v2.model.metric_payload import MetricPayload
from datadog_api_client.v2.model.metric_point import MetricPoint
from datadog_api_client.v2.model.metric_resource import MetricResource
from datadog_api_client.v2.model.metric_series import MetricSeries

body = MetricPayload(
    series=[
        MetricSeries(
            metric="system.load.1",
            type=MetricIntakeType.UNSPECIFIED,
            points=[
                MetricPoint(

                    """ Add historical timestamp here """
                    timestamp=int(datetime.now().timestamp()),
                    """ *********************** """

                    value=0.7,
                ),
            ],
            resources=[
                MetricResource(
                    name="dummyhost",
                    type="host",
                ),
            ],
        ),
    ],
)

configuration = Configuration()
with ApiClient(configuration) as api_client:
    api_instance = MetricsApi(api_client)
    response = api_instance.submit_metrics(body=body)

    print(response)
// Submit metrics returns "Payload accepted" response
import com.datadog.api.client.ApiClient;
import com.datadog.api.client.ApiException;
import com.datadog.api.client.v2.api.MetricsApi;
import com.datadog.api.client.v2.model.IntakePayloadAccepted;
import com.datadog.api.client.v2.model.MetricIntakeType;
import com.datadog.api.client.v2.model.MetricPayload;
import com.datadog.api.client.v2.model.MetricPoint;
import com.datadog.api.client.v2.model.MetricResource;
import com.datadog.api.client.v2.model.MetricSeries;
import java.time.OffsetDateTime;
import java.util.Collections;

public class Example {
  public static void main(String[] args) {
    ApiClient defaultClient = ApiClient.getDefaultApiClient();
    MetricsApi apiInstance = new MetricsApi(defaultClient);

    MetricPayload body =
        new MetricPayload()
            .series(
                Collections.singletonList(
                    new MetricSeries()
                        .metric("system.load.1")
                        .type(MetricIntakeType.UNSPECIFIED)
                        .points(
                            Collections.singletonList(
                                new MetricPoint()

                                    //Add historical timestamp here
                                    .timestamp(OffsetDateTime.now().toInstant().getEpochSecond())
                                    //***********************

                                    .value(0.7)))
                        .resources(
                            Collections.singletonList(
                                new MetricResource().name("dummyhost").type("host")))));

    try {
      IntakePayloadAccepted result = apiInstance.submitMetrics(body);
      System.out.println(result);
    } catch (ApiException e) {
      System.err.println("Exception when calling MetricsApi#submitMetrics");
      System.err.println("Status code: " + e.getCode());
      System.err.println("Reason: " + e.getResponseBody());
      System.err.println("Response headers: " + e.getResponseHeaders());
      e.printStackTrace();
    }
  }
}
// Submit metrics returns "Payload accepted" response

package main

import (
	"context"
	"encoding/json"
	"fmt"
	"os"
	"time"

	"github.com/DataDog/datadog-api-client-go/v2/api/datadog"
	"github.com/DataDog/datadog-api-client-go/v2/api/datadogV2"
)

func main() {
	body := datadogV2.MetricPayload{
		Series: []datadogV2.MetricSeries{
			{
				Metric: "system.load.1",
				Type:   datadogV2.METRICINTAKETYPE_UNSPECIFIED.Ptr(),
				Points: []datadogV2.MetricPoint{
					{
                        //Add historical timestamp here
						Timestamp: datadog.PtrInt64(time.Now().Unix()),
                        //***********************

						Value:     datadog.PtrFloat64(0.7),
					},
				},
				Resources: []datadogV2.MetricResource{
					{
						Name: datadog.PtrString("dummyhost"),
						Type: datadog.PtrString("host"),
					},
				},
			},
		},
	}
	ctx := datadog.NewDefaultContext(context.Background())
	configuration := datadog.NewConfiguration()
	apiClient := datadog.NewAPIClient(configuration)
	api := datadogV2.NewMetricsApi(apiClient)
	resp, r, err := api.SubmitMetrics(ctx, body, *datadogV2.NewSubmitMetricsOptionalParameters())

	if err != nil {
		fmt.Fprintf(os.Stderr, "Error when calling `MetricsApi.SubmitMetrics`: %v\n", err)
		fmt.Fprintf(os.Stderr, "Full HTTP response: %v\n", r)
	}

	responseContent, _ := json.MarshalIndent(resp, "", "  ")
	fmt.Fprintf(os.Stdout, "Response from `MetricsApi.SubmitMetrics`:\n%s\n", responseContent)
}
# Submit metrics returns "Payload accepted" response

require "datadog_api_client"
api_instance = DatadogAPIClient::V2::MetricsAPI.new

body = DatadogAPIClient::V2::MetricPayload.new({
  series: [
    DatadogAPIClient::V2::MetricSeries.new({
      metric: "system.load.1",
      type: DatadogAPIClient::V2::MetricIntakeType::UNSPECIFIED,
      points: [
        DatadogAPIClient::V2::MetricPoint.new({

          #Add historical timestamp here
          timestamp: Time.now.to_i,
          #***********************

          value: 0.7,
        }),
      ],
      resources: [
        DatadogAPIClient::V2::MetricResource.new({
          name: "dummyhost",
          type: "host",
        }),
      ],
    }),
  ],
})
p api_instance.submit_metrics(body)
/**
 * Submit metrics returns "Payload accepted" response
 */

import { client, v2 } from "@datadog/datadog-api-client";

const configuration = client.createConfiguration();
const apiInstance = new v2.MetricsApi(configuration);

const params: v2.MetricsApiSubmitMetricsRequest = {
  body: {
    series: [
      {
        metric: "system.load.1",
        type: 0,
        points: [
          {
            //Add historical timestamp here
            timestamp: Math.round(new Date().getTime() / 1000),
            //***********************

            value: 0.7,
          },
        ],
        resources: [
          {
            name: "dummyhost",
            type: "host",
          },
        ],
      },
    ],
  },
};

apiInstance
  .submitMetrics(params)
  .then((data: v2.IntakePayloadAccepted) => {
    console.log(
      "API called successfully. Returned data: " + JSON.stringify(data)
    );
  })
  .catch((error: any) => console.error(error));
## Dynamic Points
# Post time-series data that can be graphed on Datadog’s dashboards.
# Template variables
export NOW="$(date +%s)"
# Curl command
curl -X POST "https://api.datadoghq.com/api/v2/series" \
-H "Accept: application/json" \
-H "Content-Type: application/json" \
-H "DD-API-KEY: ${DD_API_KEY}" \
-d @- << EOF
{
  "series": [
    {
      "metric": "system.load.1",
      "type": 0,
      "points": [
        {
            # Add historical timestamp here
          "timestamp": 1636629071,
            # ***********************

          "value": 0.7
        }
      ],
      "resources": [
        {
          "name": "dummyhost",
          "type": "host"
        }
      ]
    }
  ]
}
EOF
Agent
To submit historical metrics with the Agent, make sure you have Agent version 7.40.0 or later installed. This version includes an updated DogStatsD interface, which supports Java, GoLang, and .NET. This allows you to send delayed metric points through the Agent.
import com.timgroup.statsd.NonBlockingStatsDClientBuilder;
import com.timgroup.statsd.StatsDClient;
import java.util.Random;

public class DogStatsdClient {

    public static void main(String[] args) throws Exception {

        StatsDClient Statsd = new NonBlockingStatsDClientBuilder()
            .prefix("statsd").
            .hostname("localhost")
            .port(8125)
            .build();
        Statsd.gaugeWithTimestamp("example_metric.gauge_with_timestamp", new Random().nextInt(20), 1205794800, new String[]{"environment:dev"});
        Statsd.countWithTimestamp("example_metric.count_with_timestamp", new Random().nextInt(20), 1205794800, new String[]{"environment:dev"});
    }
}
package main

import (
	"log"
  "time"

	"github.com/DataDog/datadog-go/statsd"
)

func main() {
	statsd, err := statsd.New("127.0.0.1:8125")
	if err != nil {
		log.Fatal(err)
	}

  ts := time.Date(2008, time.March, 17, 23, 0, 0, 0, time.UTC)
	statsd.GaugeWithTimestamp("example_metric.gauge_with_timestamp", 12, []string{"environment:dev"}, 1, ts)
  statsd.CountWithTimestamp("example_metric.count_with_timestamp", 12, []string{"environment:dev"}, 1, ts)
}
using StatsdClient;

public class DogStatsdClient
{
    public static void Main()
    {
        var dogstatsdConfig = new StatsdConfig
        {
            StatsdServerName = "127.0.0.1",
            StatsdPort = 8125,
        };

        using (var dogStatsdService = new DogStatsdService())
        {
            dogStatsdService.Configure(dogstatsdConfig);
            var random = new Random(0);
            var dto = new DateTimeOffset(2008, 03, 17, 23, 00, 00, new TimeSpan(0, 0, 0))
            dogStatsdService.Gauge("example_metric.gauge_with_timestamp", 10, tags: new[] {"environment:dev"}, dto);
            dogStatsdService.Counter("example_metric.count_with_timestamp", 10, tags: new[] {"environment:dev"}, dto);
        }
    }
}
Historical Metrics Ingestion’s latency
Historical Metrics Ingestion has varying latency depending on how far in the past your metrics’ timestamps are.
| Metric Delayed by: | Ingestion Latency |
|---|---|
| 1-12 hours | Near Real-Time Ingestion (1 hour MAX) |
| 12 hours - 30 days | Up to 14 hour latency |
| +30 days | +14 hours latency |
Historical Metrics Ingestion billing
Historical Metrics are counted and billed as indexed custom metrics. Billable custom metrics are determined by the timestamp of the metrics submitted, regardless of whether they have a timestamp of today or 15 months into the past. As long as that metric name and tag value combination is actively reporting ANY value (regardless of the timestamp), it would be considered active in the hour that it was submitted. For more information, see the Custom Metrics billing documentation.
Track your indexed historical metrics through the Usage Summary section of the Plan and Usage page.
Further Reading
Additional helpful documentation, links, and articles:


