- Essentials
- Getting Started
- Datadog
- Datadog Site
- DevSecOps
- Serverless for AWS Lambda
- Agent
- Integrations
- Containers
- Dashboards
- Monitors
- Logs
- APM Tracing
- Profiler
- Tags
- API
- Service Catalog
- Session Replay
- Continuous Testing
- Synthetic Monitoring
- Incident Management
- Database Monitoring
- Cloud Security Management
- Cloud SIEM
- Application Security Management
- Workflow Automation
- CI Visibility
- Test Visibility
- Test Impact Analysis
- Code Analysis
- Learning Center
- Support
- Glossary
- Standard Attributes
- Guides
- Agent
- Integrations
- OpenTelemetry
- Developers
- Authorization
- DogStatsD
- Custom Checks
- Integrations
- Create an Agent-based Integration
- Create an API Integration
- Create a Log Pipeline
- Integration Assets Reference
- Build a Marketplace Offering
- Create a Tile
- Create an Integration Dashboard
- Create a Recommended Monitor
- Create a Cloud SIEM Detection Rule
- OAuth for Integrations
- Install Agent Integration Developer Tool
- Service Checks
- IDE Plugins
- Community
- Guides
- API
- Datadog Mobile App
- CoScreen
- Cloudcraft
- In The App
- Dashboards
- Notebooks
- DDSQL Editor
- Sheets
- Monitors and Alerting
- Infrastructure
- Metrics
- Watchdog
- Bits AI
- Service Catalog
- API Catalog
- Error Tracking
- Service Management
- Infrastructure
- Application Performance
- APM
- Continuous Profiler
- Database Monitoring
- Data Streams Monitoring
- Data Jobs Monitoring
- Digital Experience
- Real User Monitoring
- Product Analytics
- Synthetic Testing and Monitoring
- Continuous Testing
- Software Delivery
- CI Visibility
- CD Visibility
- Test Optimization
- Code Analysis
- Quality Gates
- DORA Metrics
- Security
- Security Overview
- Cloud SIEM
- Cloud Security Management
- Application Security Management
- AI Observability
- Log Management
- Observability Pipelines
- Log Management
- Administration
Getting Started with Device Profiles
The Device Onboarding Experience is not supported on this site.
Overview
Device profiles define which metrics to collect and how to transform them into Datadog metrics. Each profile is expected to monitor a class of similar devices from the same vendor.
The Device Onboarding Experience provides a guided, GUI-based experience to:
- Seamlessly create and manage device profiles
- Specify tags and metrics to be collected from your network devices
- Verify the matching devices to each profile
For more information on advanced profile details, review the Profile Format Reference page.
Prerequisites
The minimum Agent version required is 7.50 or higher.
Device profile onboarding
Profile home page
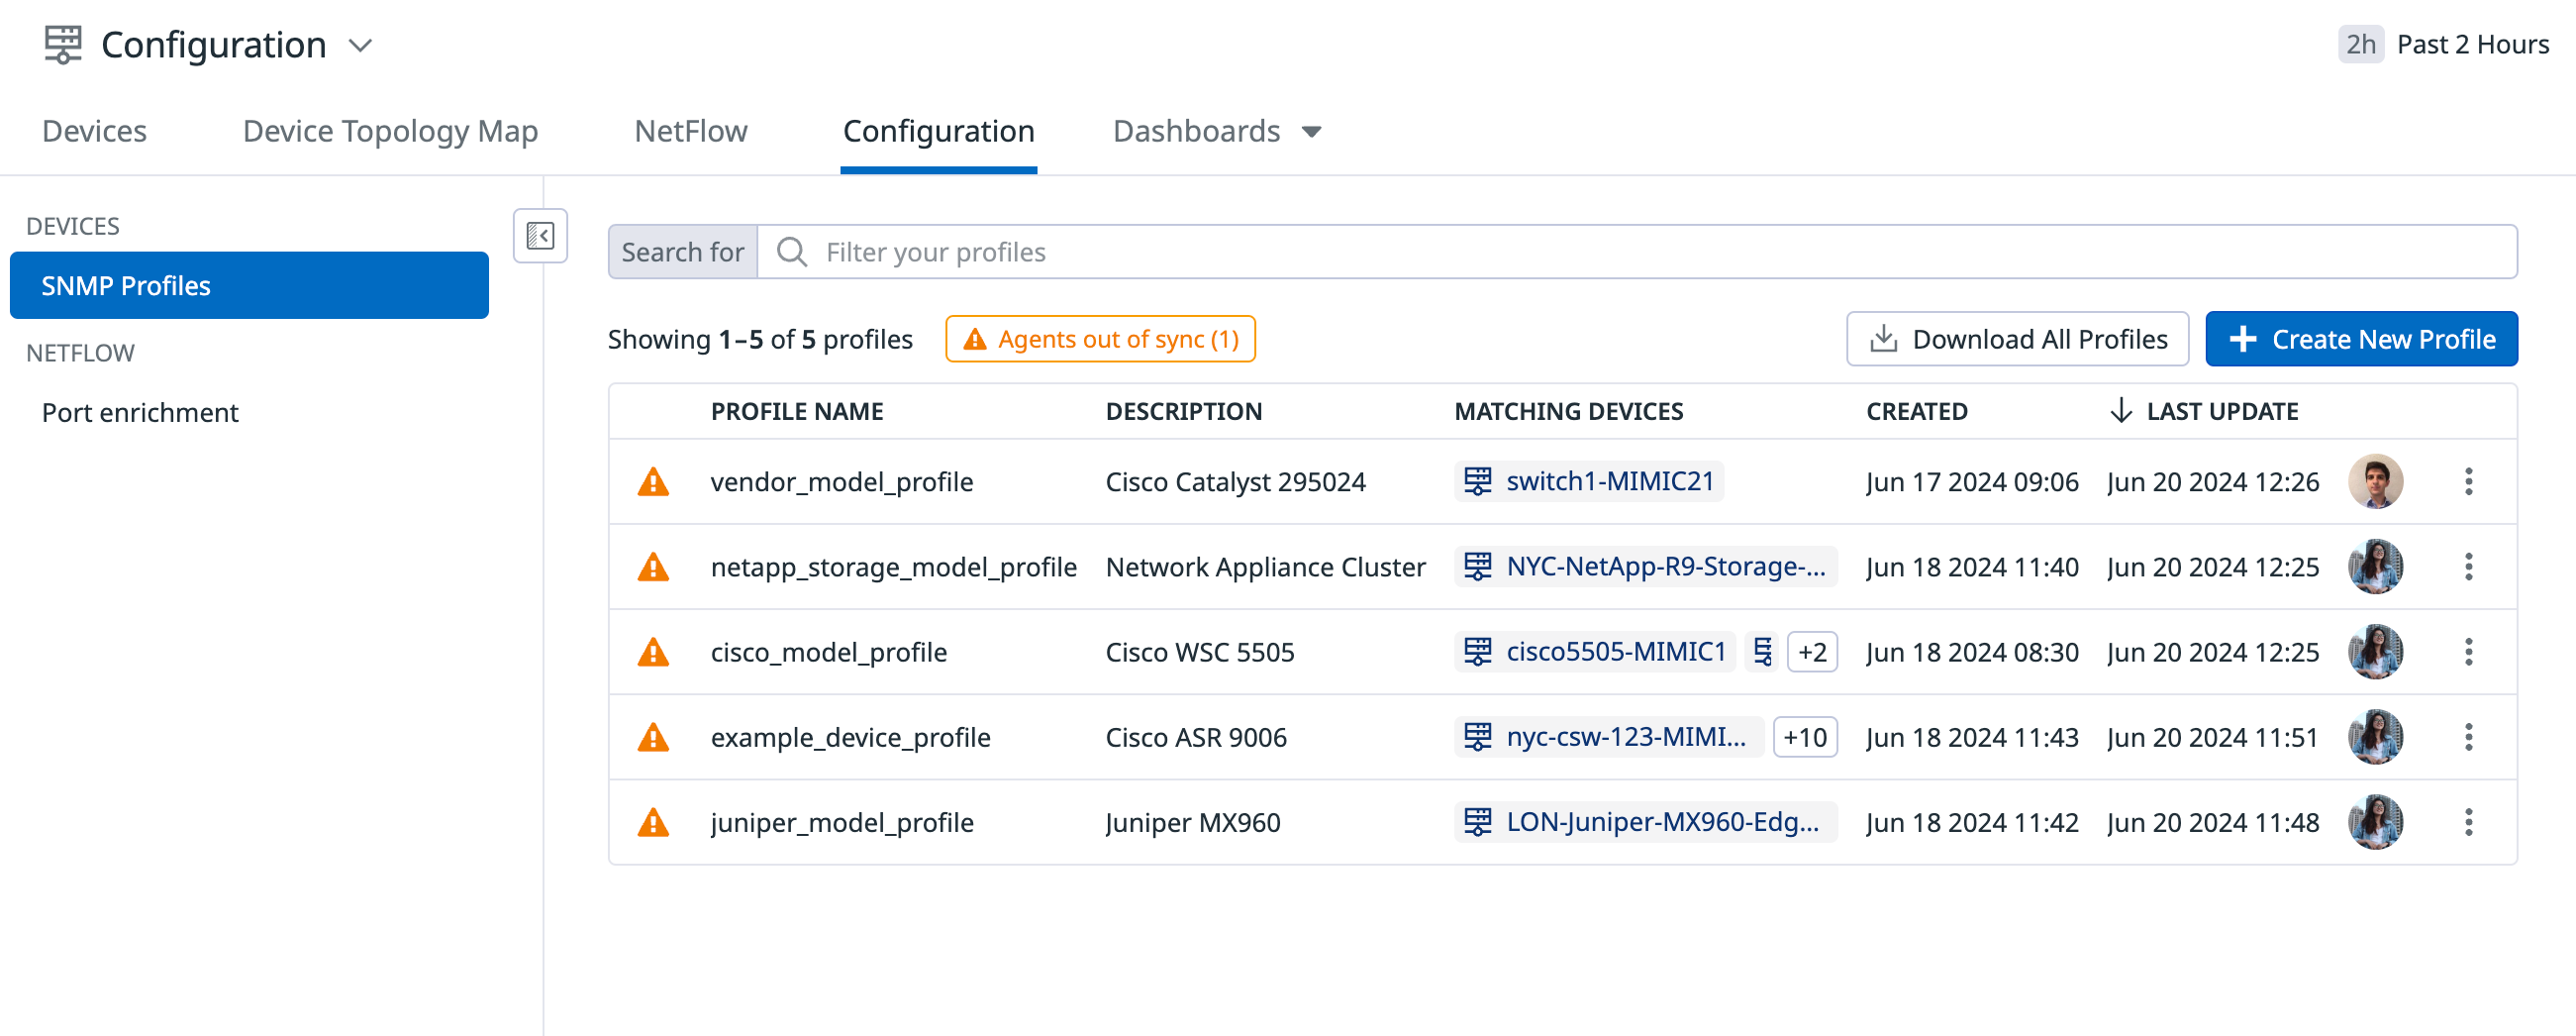
The profile home page is where you can see a snapshot of the device profiles you created using the Device Onboarding Experience.
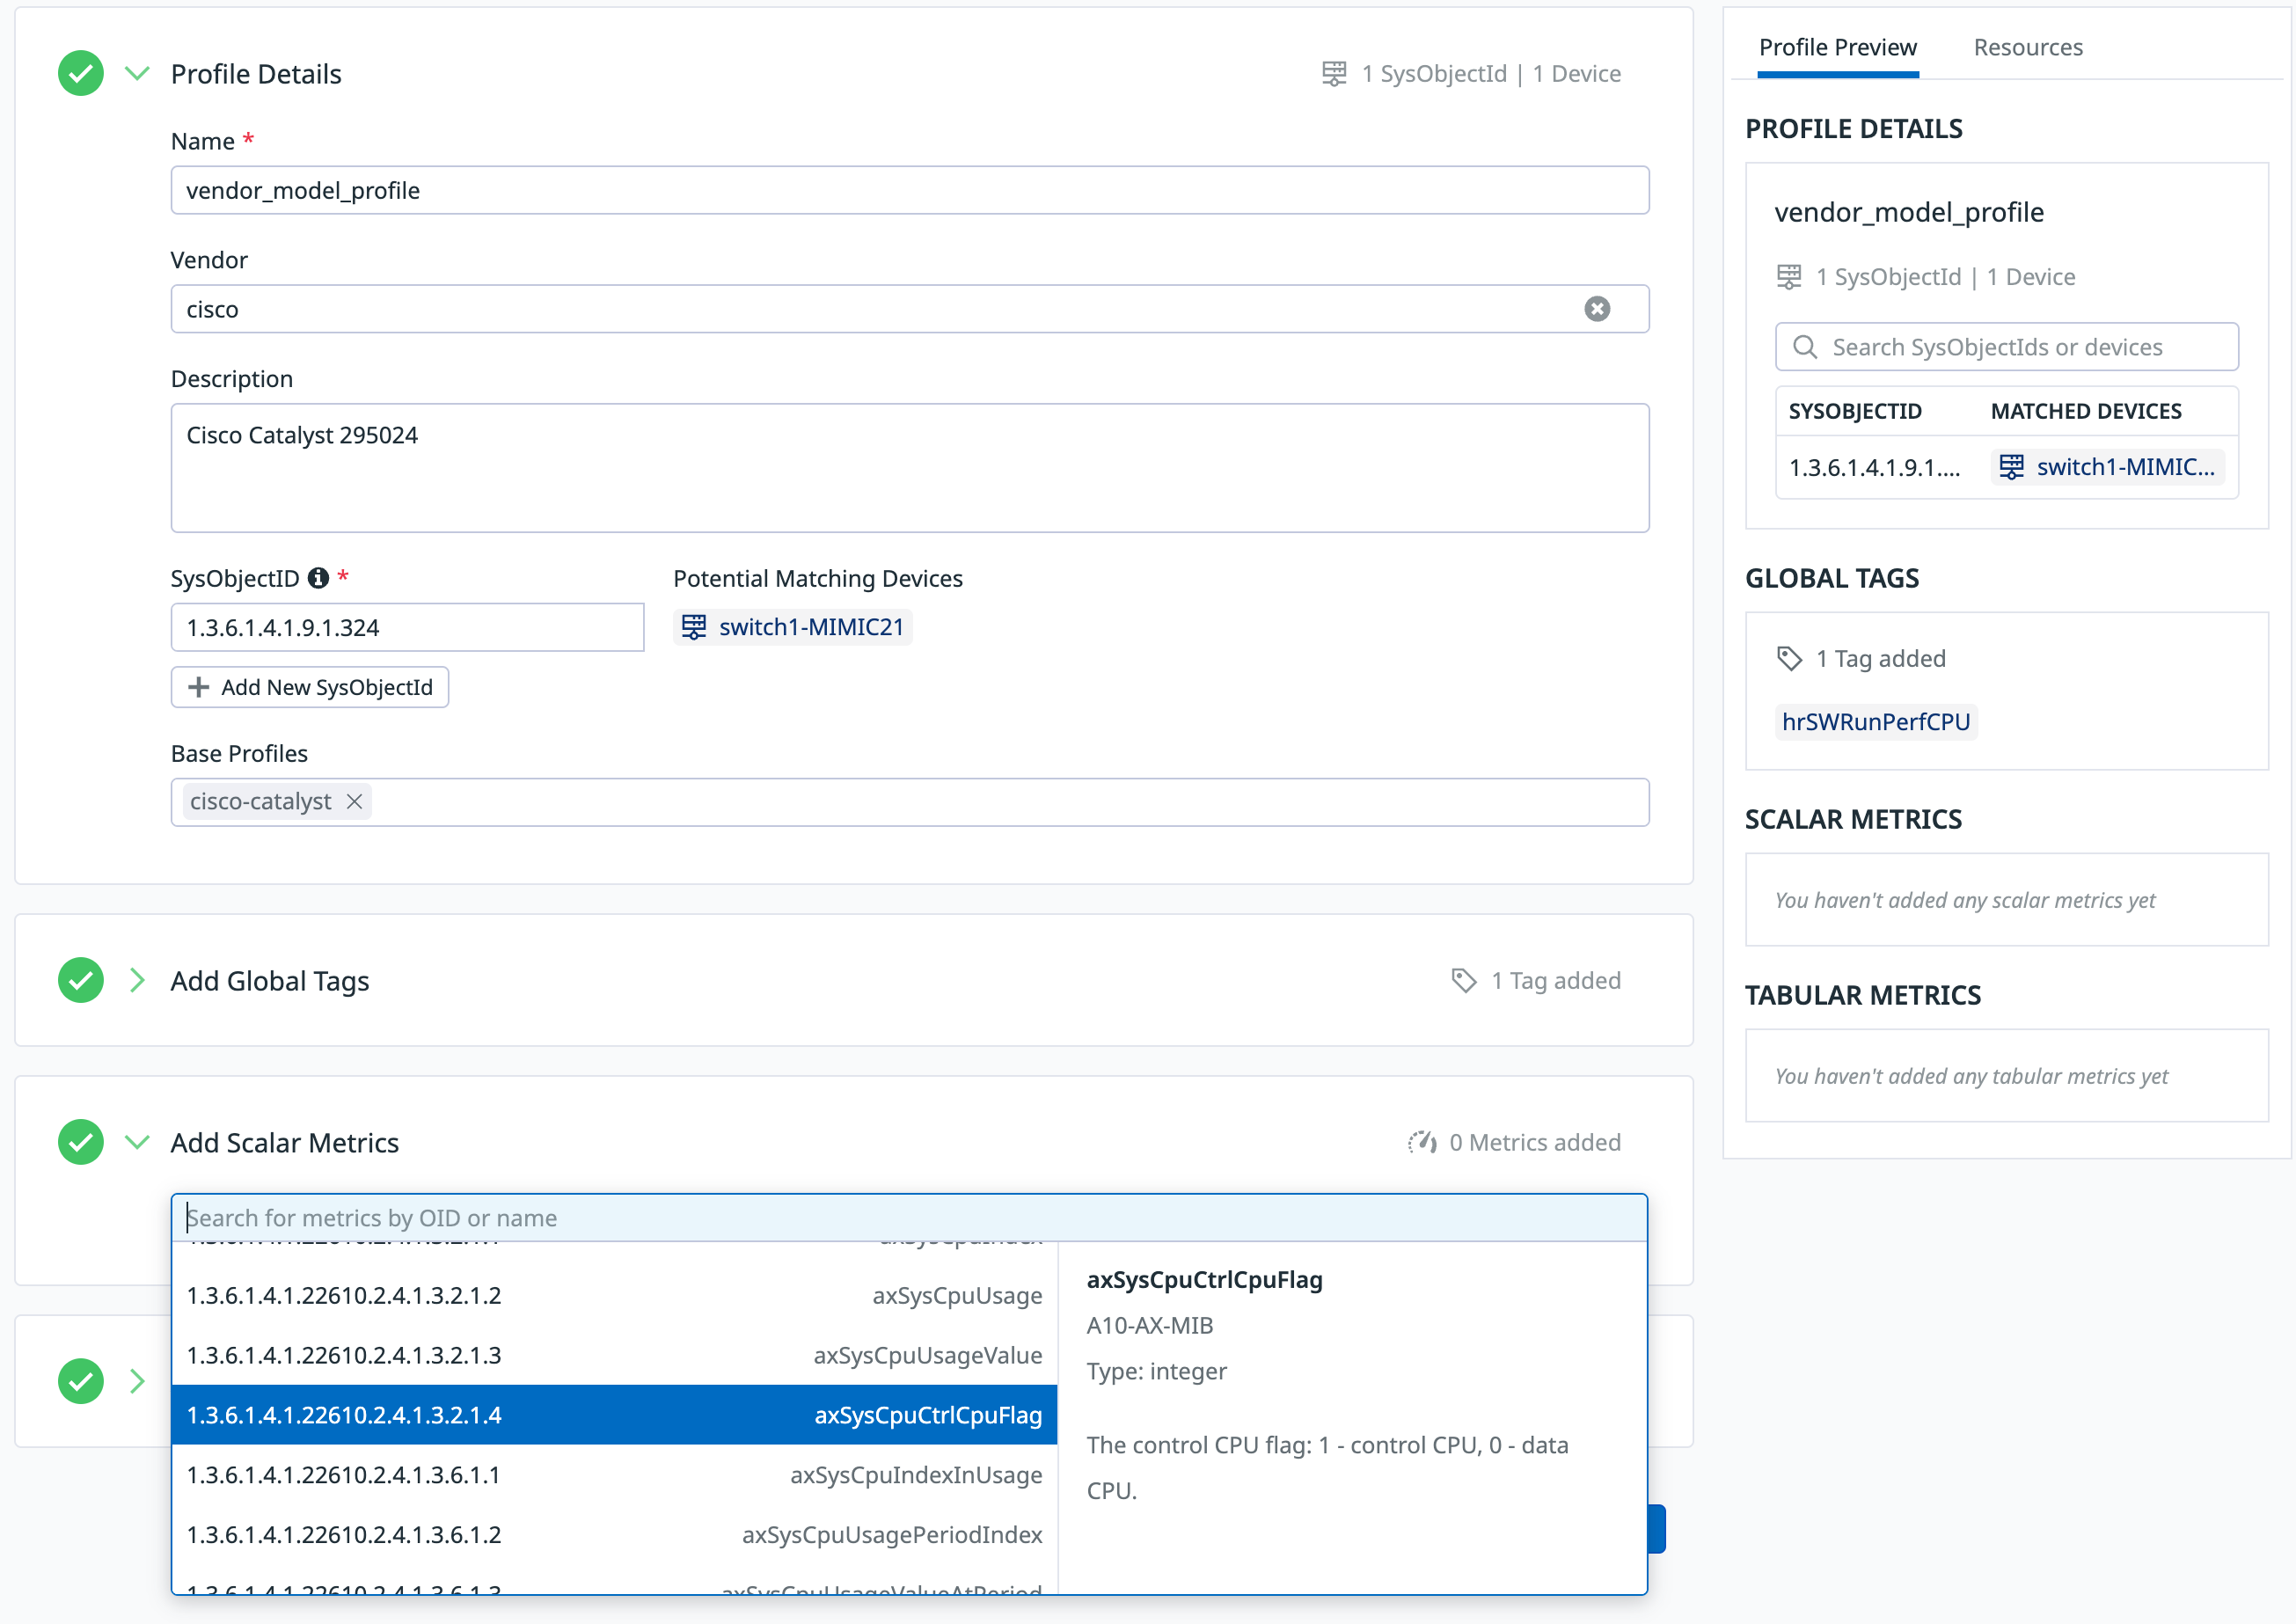
Profile details
- Build your own NDM profile by navigating to Infrastructure > Network Devices > Configuration.
- Click on SNMP Profiles > Create New Profile.
- Provide your device profile a name, vendor information(optional) and description (optional).
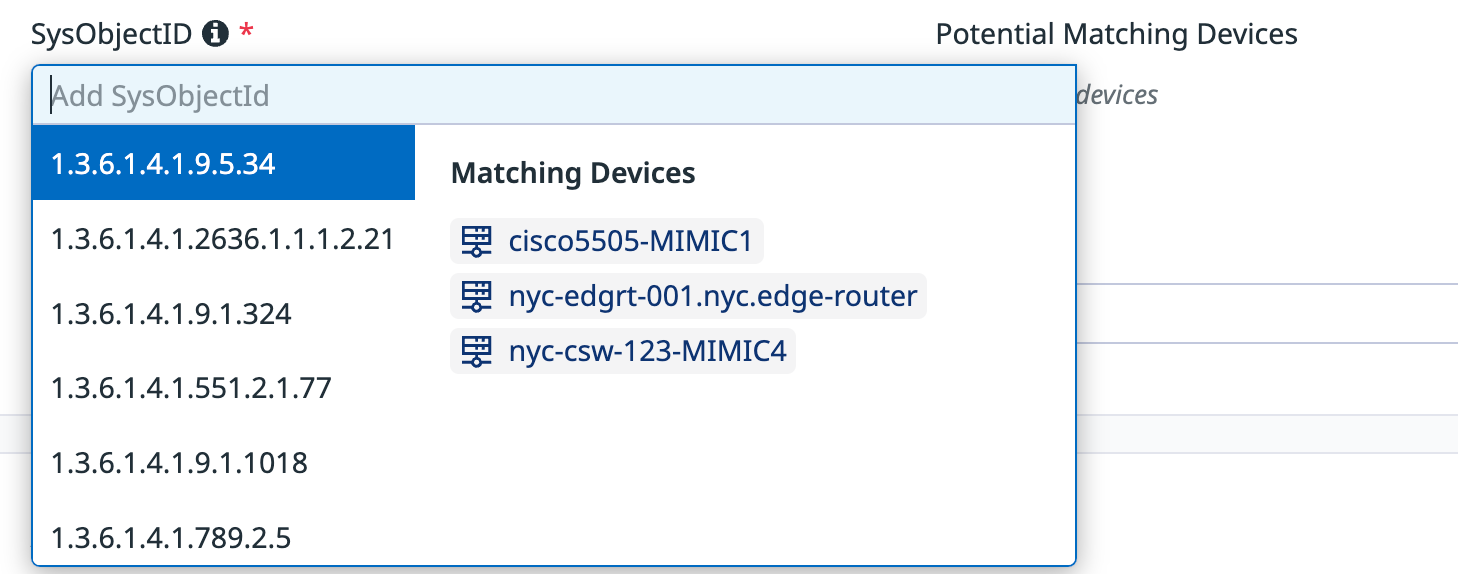
- Select the
SysObjectID. This is what is used to match network devices to the device profiles that define what is collected and monitored from each device.
Global Tags
Add global tags for more advanced and granular options, which allows you to assign a weight to a specific metric.
Advanced Options
| Modification | Description |
|---|---|
| No Modification | The device’s returned value will be used directly as the tag value. |
| Format | This can be mac_address or ip_address. |
| Extract Value | A regular expression used to extract the tag value from the SNMP value provided by the device. |
| Mapping | This is described here. |
Scalar metrics
Tabular metrics
Add Tabular Tags
Adding tags to tabular metrics is similar to adding global tags, with two additional options:
Select whether the tag value originates from an
OIDvalue or a segment of the table index. IfIndexis chosen as the source, an index position must be specified, which then becomes the tag.Example of using an Index position
Consider a table at
OID 1.2.3.1.1with two indices. Each row in this table includes a two-number index. Suppose column 3 of a row hasOID 1.2.3.1.1.3.55.12- here,1.2.3.1.1represents the table,.3is the column number within the table, and.55.12is the index of this specific row (all other columns for this row will also end with.55.12). If you establish a tag with the Source set toIndexandIndex Positionset to 1, the tag’s value for metrics from this table row will be55; if you set the index position to 2, it will be 12. If you use an index less than 1 or more than the number of indices in the table, the tag will not be populated.See Using an Index for more information.
Use Index Transformation when you need to tag a table metric value with a value from a different table that employs a subset of this table’s index. This is not a typical scenario. You configure this by adding one or more transformation segments, each with a start and end number. These numbers index into the original table’s index to create a new index value for the new table.
Example of using Index Transformation
Consider the
CPI-UNITY-MIBmodule. It has atable,cpiPduTable, with details about a specific PDU, and another table,cpiPduBranchTable, with information about specific PDU branches. The index of the main table is the PDU’s MAC address, such as6.0.36.155.53.3.246. The branch table’s index is abranch IDfollowed by thePDU MAC, therefore a branch table row index might be1.6.0.36.155.53.3.246. If you want to report the current on a PDU branch, you could addcpiPduBranchCurrent(OID 1.3.6.1.4.1.30932.1.10.1.3.110.1.3, from the branch table) as a tabular metric. To tag this metric with the PDU name, addcpiPduNameas a tag (OID 1.3.6.1.4.1.30932.1.10.1.2.10.1.3, from the main table), then add an index transform withstart:1andend:7. This means the branch current metric from the branch table indexed with1.6.0.36.155.53.3.246would be tagged using the name from the main table indexed with6.0.36.155.53.3.246.For more information see Using a column from a different table with different indexes.
Metrics Advanced Options
The advanced options for scalar and tabular metrics are the same:
- Metric Type
- One of
gauge,rate,monotonic_count, ormonotonic_count_and_rate. - Scale Factor
- Before being transmitted to Datadog, the extracted value is multiplied by this factor.
- Extract Value
- This is the same as the advanced options for global tags.
Apply a profile to created devices
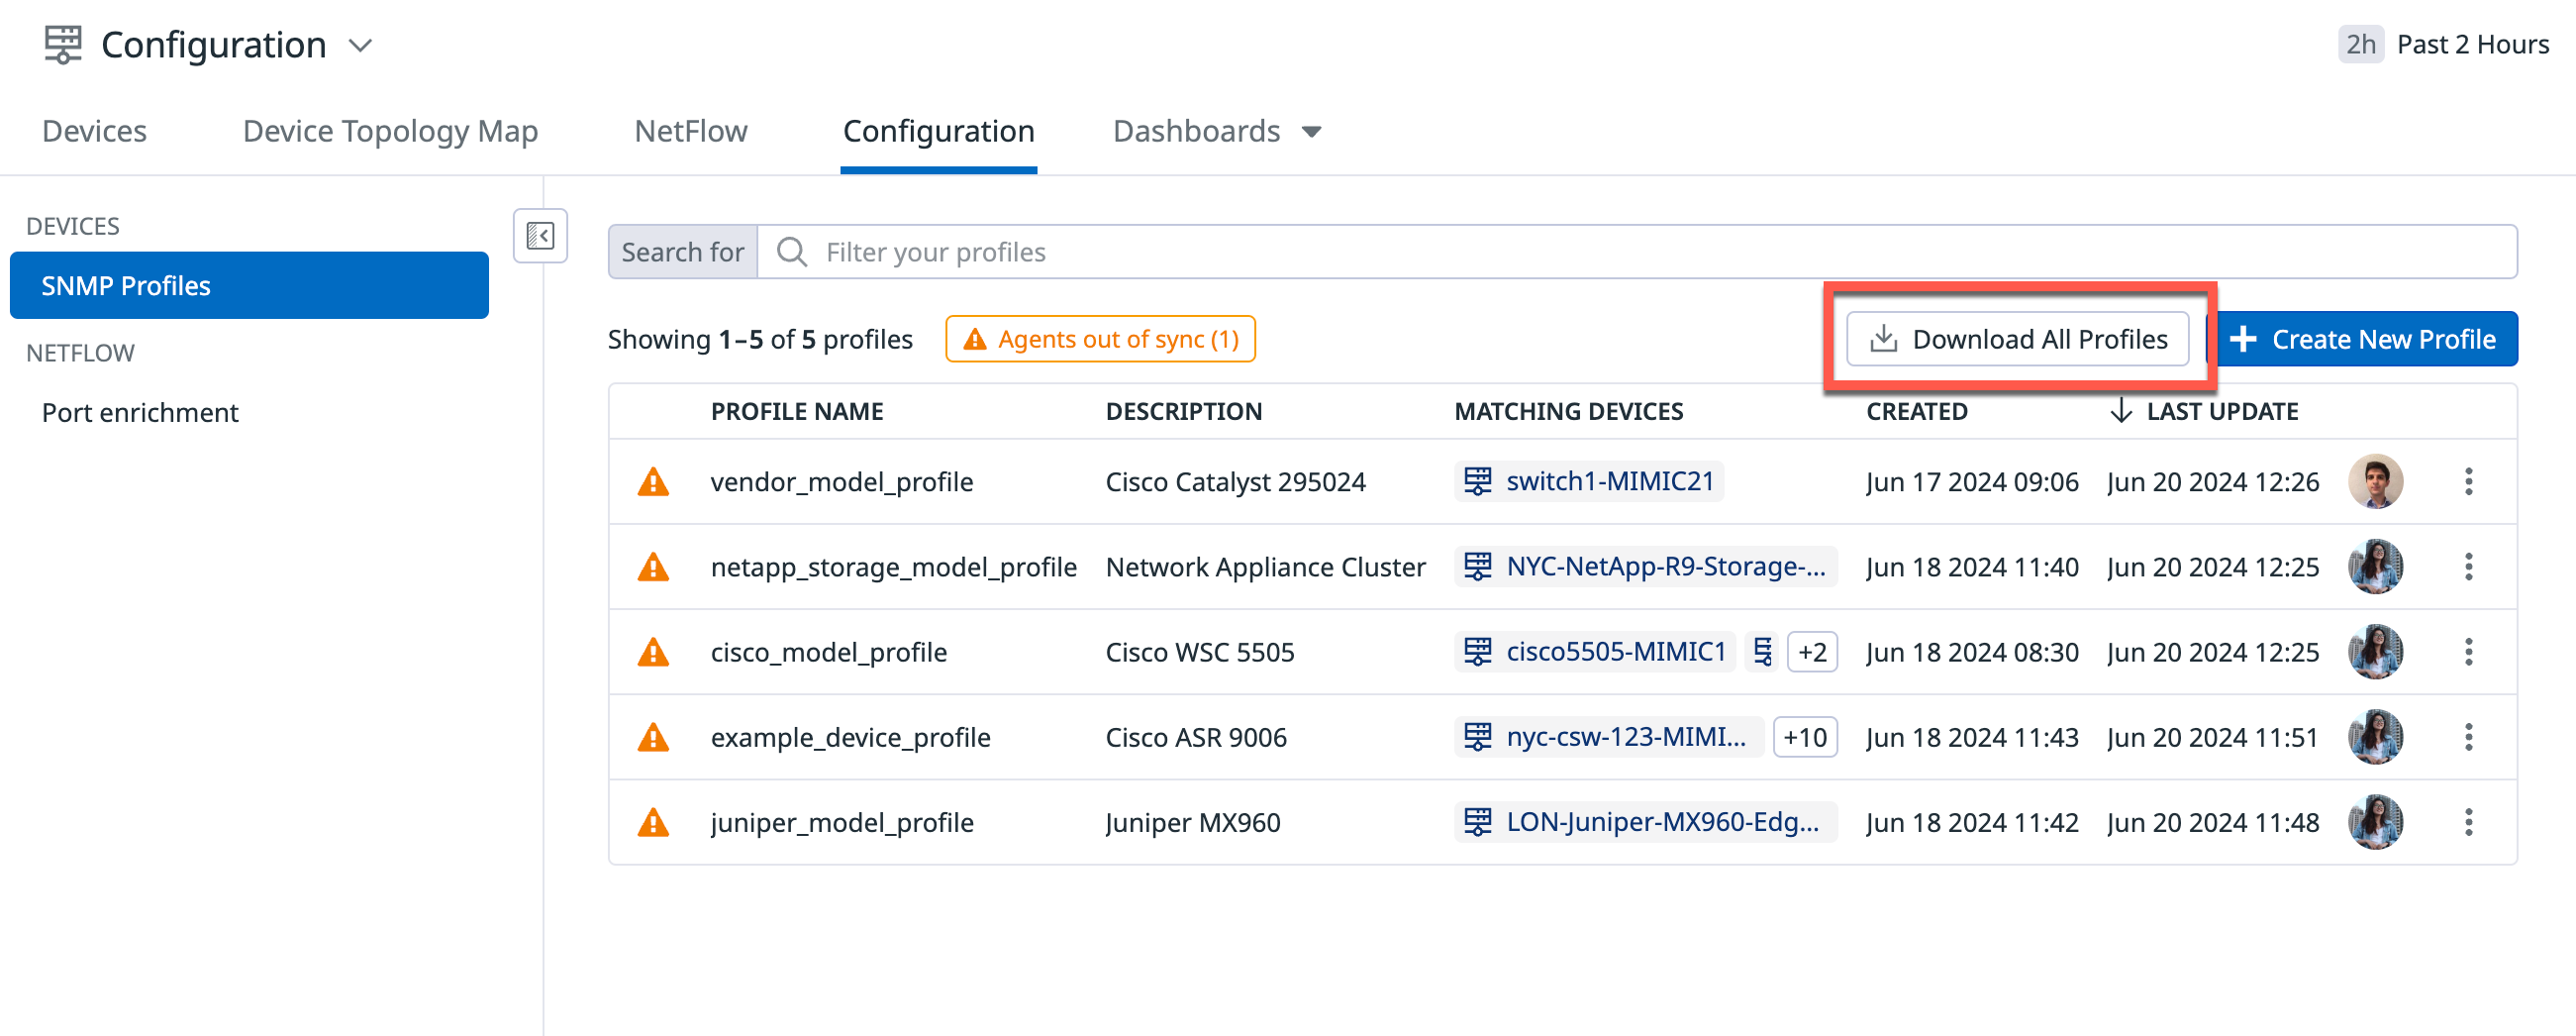
- After you save a profile, navigate back to the profile home page and select the Download All Profiles option. This allows you to download the
.zipbundle which contains theyamlfiles for the profiles you created. - Place the
yamlfiles in the profile directory on each of the relevant installed Agents. - Restart the Datadog Agent.
- To ensure the profiles you created are accurate, confirm that NDM is receiving metrics from the matched devices as expected.
Further Reading
Additional helpful documentation, links, and articles:


