- Essentials
- Getting Started
- Datadog
- Datadog Site
- DevSecOps
- Serverless for AWS Lambda
- Agent
- Integrations
- Containers
- Dashboards
- Monitors
- Logs
- APM Tracing
- Profiler
- Tags
- API
- Service Catalog
- Session Replay
- Continuous Testing
- Synthetic Monitoring
- Incident Management
- Database Monitoring
- Cloud Security Management
- Cloud SIEM
- Application Security Management
- Workflow Automation
- CI Visibility
- Test Visibility
- Test Impact Analysis
- Code Analysis
- Learning Center
- Support
- Glossary
- Standard Attributes
- Guides
- Agent
- Integrations
- OpenTelemetry
- Developers
- Authorization
- DogStatsD
- Custom Checks
- Integrations
- Create an Agent-based Integration
- Create an API Integration
- Create a Log Pipeline
- Integration Assets Reference
- Build a Marketplace Offering
- Create a Tile
- Create an Integration Dashboard
- Create a Recommended Monitor
- Create a Cloud SIEM Detection Rule
- OAuth for Integrations
- Install Agent Integration Developer Tool
- Service Checks
- IDE Plugins
- Community
- Guides
- API
- Datadog Mobile App
- CoScreen
- Cloudcraft
- In The App
- Dashboards
- Notebooks
- DDSQL Editor
- Sheets
- Monitors and Alerting
- Infrastructure
- Metrics
- Watchdog
- Bits AI
- Service Catalog
- API Catalog
- Error Tracking
- Service Management
- Infrastructure
- Application Performance
- APM
- Continuous Profiler
- Database Monitoring
- Data Streams Monitoring
- Data Jobs Monitoring
- Digital Experience
- Real User Monitoring
- Product Analytics
- Synthetic Testing and Monitoring
- Continuous Testing
- Software Delivery
- CI Visibility
- CD Visibility
- Test Optimization
- Code Analysis
- Quality Gates
- DORA Metrics
- Security
- Security Overview
- Cloud SIEM
- Cloud Security Management
- Application Security Management
- AI Observability
- Log Management
- Observability Pipelines
- Log Management
- Administration
Overview Page
Overview
The NPM overview page provides a high-level overview of your network, from costly network traffic to DNS health to service top talkers. Use the Overview page to filter network traffic by environment or team with tags, and adjust the time frame for your network data.
External network traffic
Use the External Network Traffic section to get an overview of costly network traffic. Egress traffic that leaves your network is a common cost source, so determining which external endpoints have the most traffic reaching them is helpful to ensure that traffic volume remains within an expected range. For example, Top AWS gateway users shows top endpoints communicating to an AWS Internet Gateway or AWS NAT Gateway. AWS PrivateLink eligible traffic shows traffic that could leverage AWS PrivateLink to reduce the overall cost of traffic.
To dig deeper into any of these areas, click the View in Analytics button at the bottom right of each section of the overview page. The Analytics page opens with the query pre-populated so you can continue your investigation.
Application and dependency top talkers
Application and Dependency Top Talkers allow you to select a specific endpoint in your network and look at top traffic sources upstream and downstream of the endpoint. Select See all Dependencies to see the highest traffic dependencies both upstream and downstream of the endpoint, and toggle between the graph (timeseries) view and top list view for the selected time frame.
DNS health
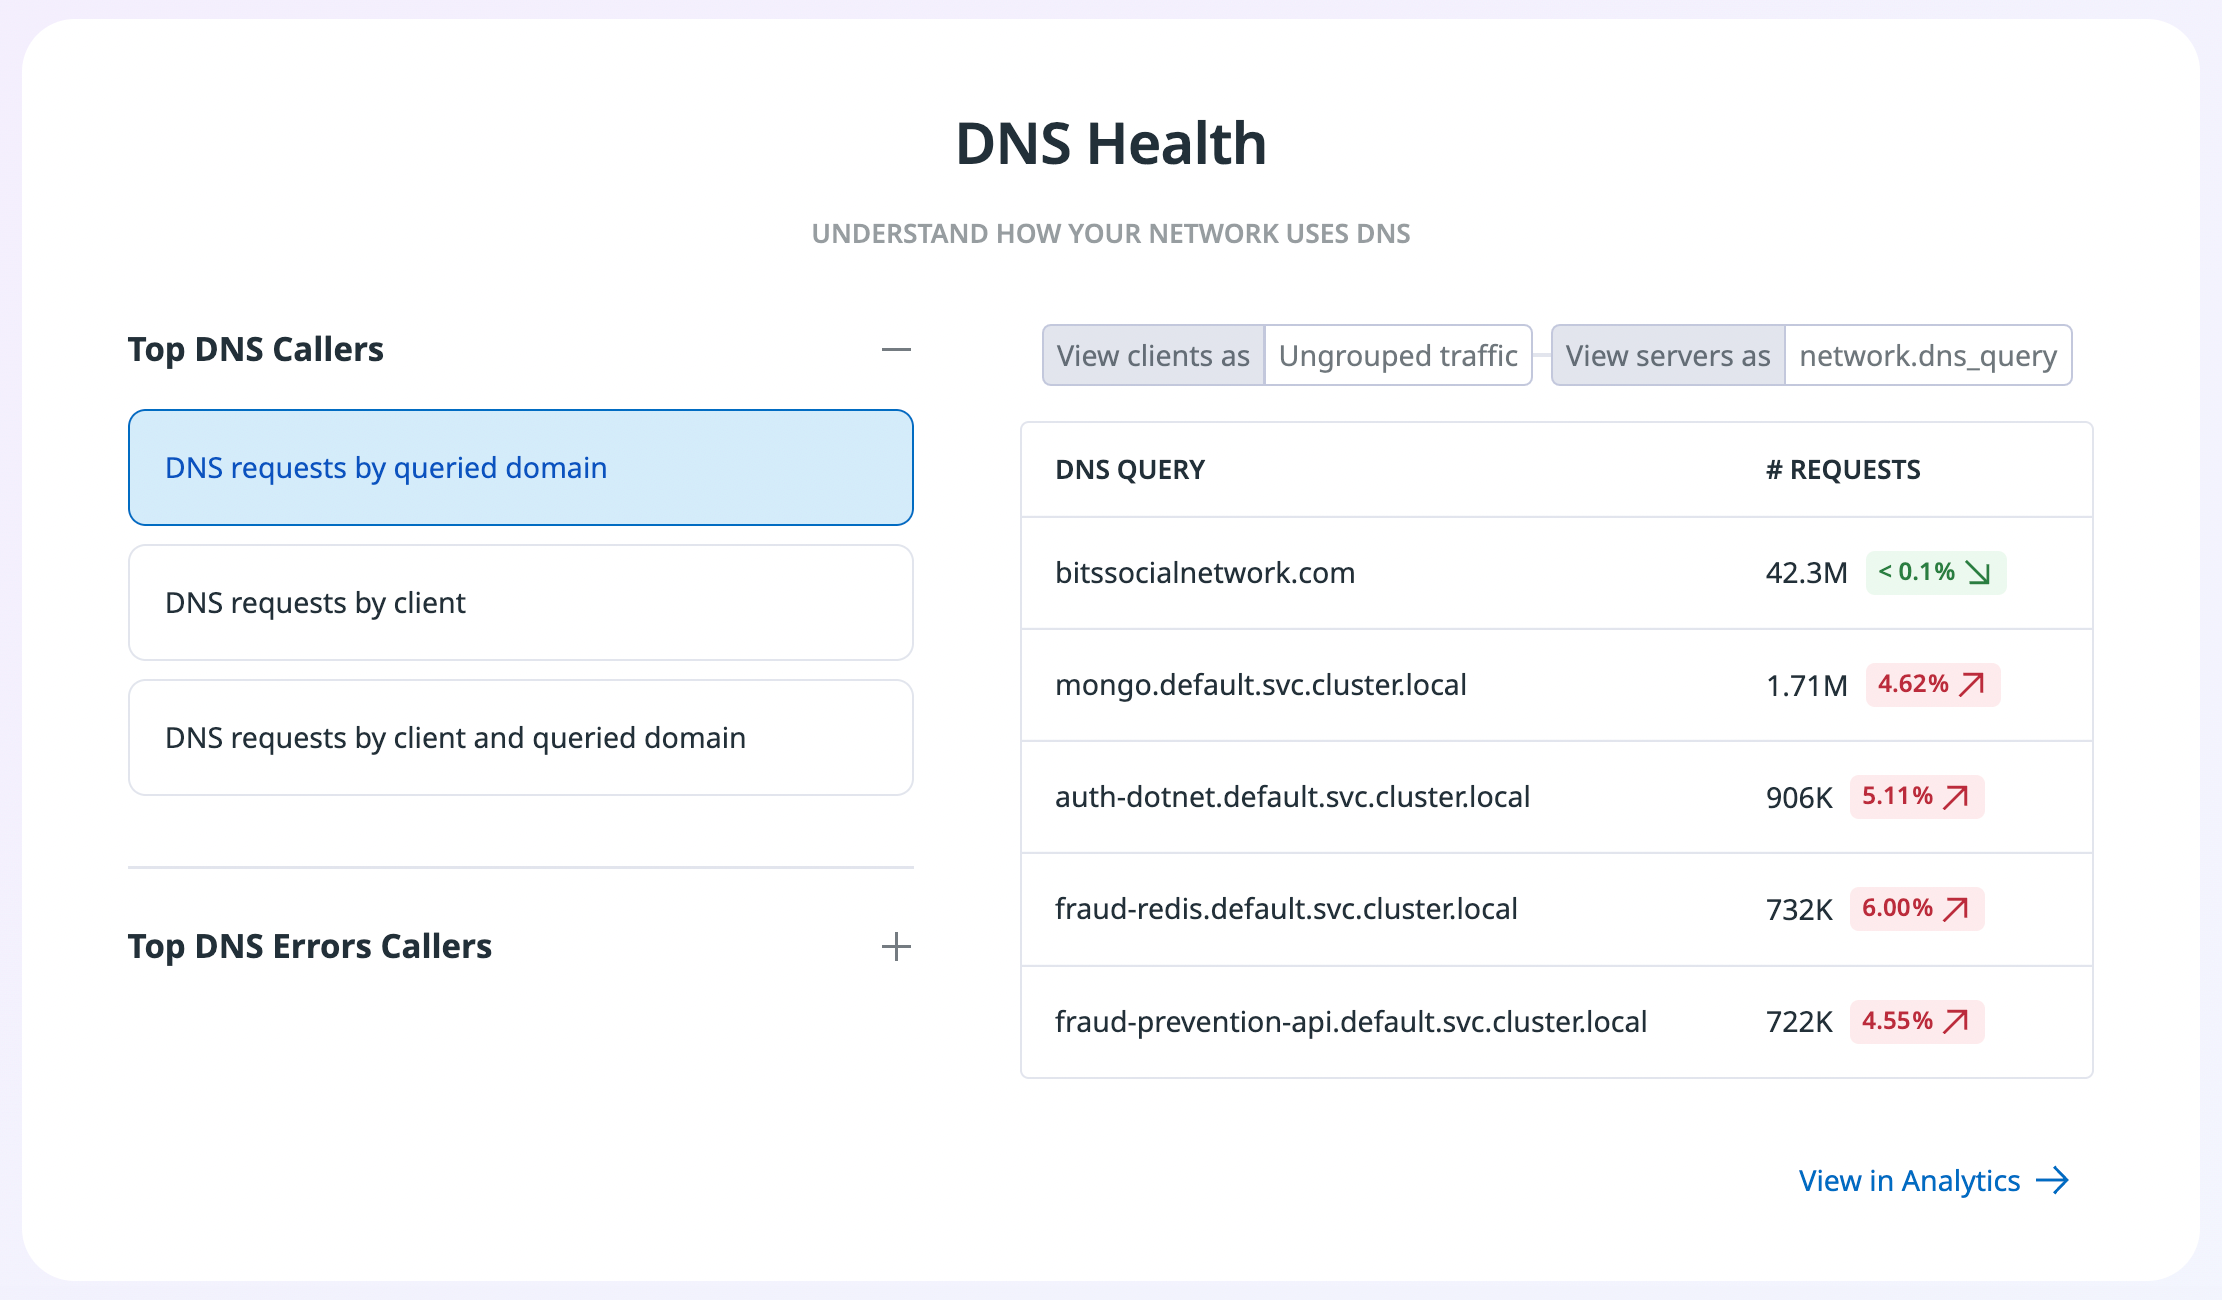
The DNS Health section provides a high-level overview of the top DNS callers by queried domain, client, or both. See the most queried domains, the top clients making DNS queries, or a combination of the two, and check the change icons to see if there have been any unexpected changes in the selected time frame.
You can also view the top callers for common DNS errors, such as NXDOMAIN, timeouts, and SERVFAIL. Find the top client-to-DNS query combinations resulting in any given error type, and see how that error rate has changed over the selected time frame. This helps to identify unusual DNS errors that may need investigation, especially while troubleshooting an incident.
Identify top traffic sources
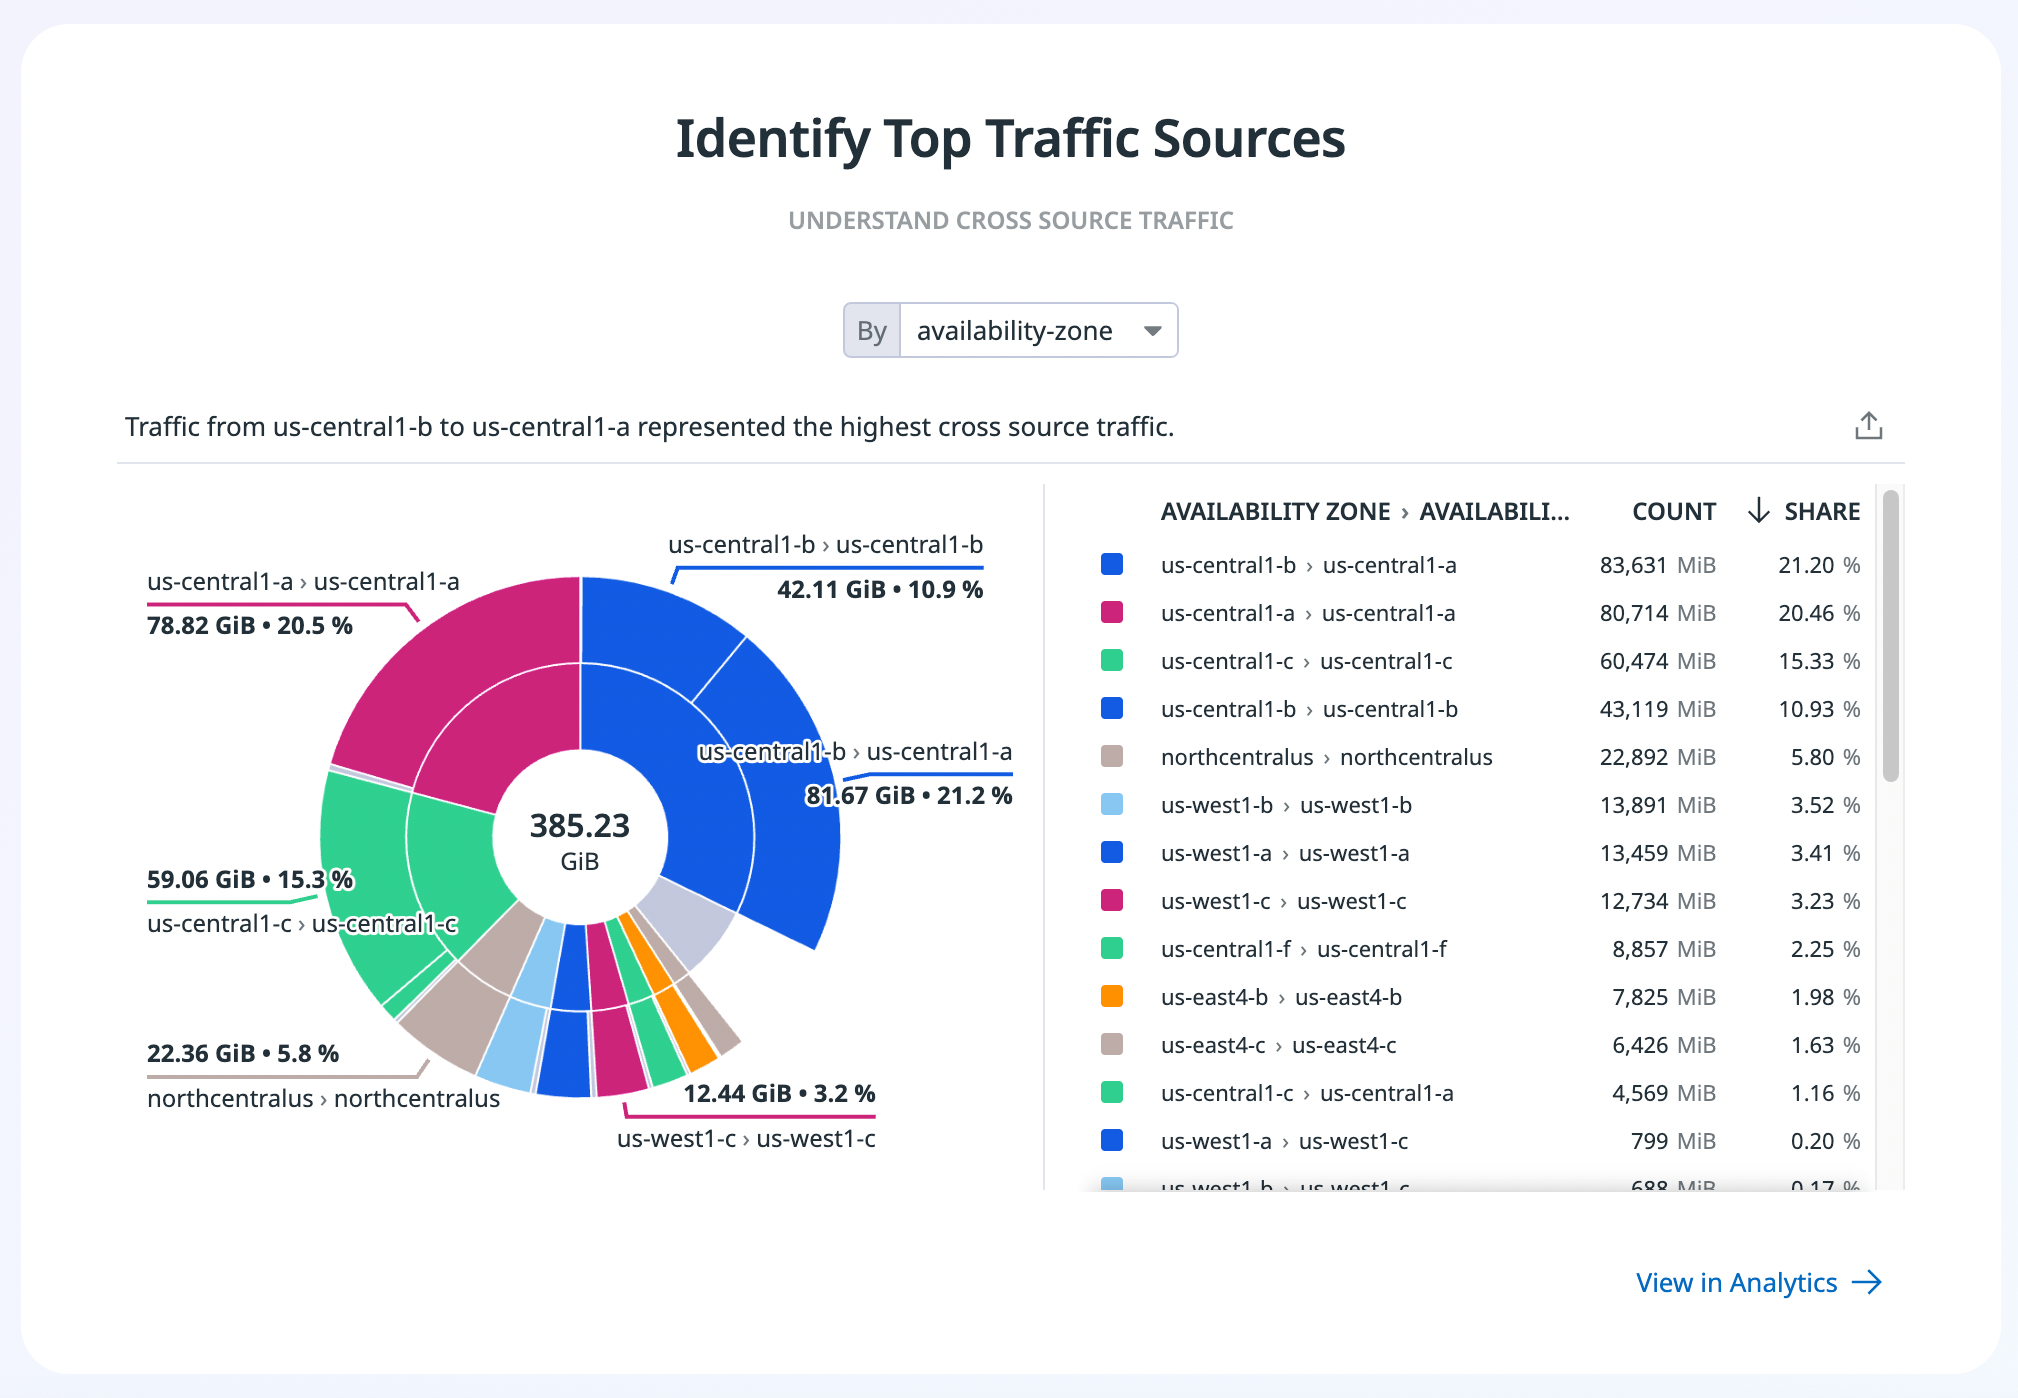
The Identify Top Traffic Sources section shows traffic across different sources such as availability zone, team, cloud provider, or region, depending on how you tag your data. Seeing the top availability zone (AZ) traffic, for example, can help start an investigation into cloud cost reduction, as cross-AZ traffic is a common expense. Continue investigating by clicking the View in Analytics button to discover which services make up most of the cross-AZ traffic. You can use this section for similar exploration of top cross-team, cross-cloud provider, or cross-region traffic.
Further Reading
Additional helpful documentation, links, and articles:


