- Essentials
- Getting Started
- Datadog
- Datadog Site
- DevSecOps
- Serverless for AWS Lambda
- Agent
- Integrations
- Containers
- Dashboards
- Monitors
- Logs
- APM Tracing
- Profiler
- Tags
- API
- Service Catalog
- Session Replay
- Continuous Testing
- Synthetic Monitoring
- Incident Management
- Database Monitoring
- Cloud Security Management
- Cloud SIEM
- Application Security Management
- Workflow Automation
- CI Visibility
- Test Visibility
- Test Impact Analysis
- Code Analysis
- Learning Center
- Support
- Glossary
- Standard Attributes
- Guides
- Agent
- Integrations
- OpenTelemetry
- Developers
- Authorization
- DogStatsD
- Custom Checks
- Integrations
- Create an Agent-based Integration
- Create an API Integration
- Create a Log Pipeline
- Integration Assets Reference
- Build a Marketplace Offering
- Create a Tile
- Create an Integration Dashboard
- Create a Recommended Monitor
- Create a Cloud SIEM Detection Rule
- OAuth for Integrations
- Install Agent Integration Developer Tool
- Service Checks
- IDE Plugins
- Community
- Guides
- API
- Datadog Mobile App
- CoScreen
- Cloudcraft
- In The App
- Dashboards
- Notebooks
- DDSQL Editor
- Sheets
- Monitors and Alerting
- Infrastructure
- Metrics
- Watchdog
- Bits AI
- Service Catalog
- API Catalog
- Error Tracking
- Service Management
- Infrastructure
- Application Performance
- APM
- Continuous Profiler
- Database Monitoring
- Data Streams Monitoring
- Data Jobs Monitoring
- Digital Experience
- Real User Monitoring
- Product Analytics
- Synthetic Testing and Monitoring
- Continuous Testing
- Software Delivery
- CI Visibility
- CD Visibility
- Test Optimization
- Code Analysis
- Quality Gates
- DORA Metrics
- Security
- Security Overview
- Cloud SIEM
- Cloud Security Management
- Application Security Management
- AI Observability
- Log Management
- Observability Pipelines
- Log Management
- Administration
Docker Metrics
Overview
To collect container metrics, configure the Docker stats receiver in your Datadog Exporter.
For more information, see the OpenTelemetry project documentation for the Docker stats receiver.
Setup
The Docker stats receiver needs access to the Docker socket. By default, the receiver looks for the Docker socket at unix:///var/run/docker.sock. If this is not the Docker socket path, specify the path in the endpoint configuration line.
Add the following lines to your Collector configuration:
receivers:
  docker_stats:
    endpoint: unix:///var/run/docker.sock # (default)
    metrics:
      container.network.io.usage.rx_packets:
        enabled: true
      container.network.io.usage.tx_packets:
        enabled: true
      container.cpu.usage.system:
        enabled: true
      container.memory.rss:
        enabled: true
      container.blockio.io_serviced_recursive:
        enabled: true
      container.uptime:
        enabled: true
      container.memory.hierarchical_memory_limit:
        enabled: true
Note: If you are using the collector image, you may need to configure additional permissions for the collector to have access to the Docker socket.
The Docker stats receiver needs access to the Docker socket. In Kubernetes, if you are running Docker as a runtime, mount the Docker socket:
Add the following lines to values.yaml:
extraVolumes:
 - name: docker-sock
   hostPath:
     path: /var/run/docker.sock
extraVolumeMounts:
 - name: docker-sock
   mountPath: /var/run/docker.sock
Add the following in the Collector configuration:
receivers:
  docker_stats:
    endpoint: unix:///var/run/docker.sock # default
    metrics:
      container.network.io.usage.rx_packets:
        enabled: true
      container.network.io.usage.tx_packets:
        enabled: true
      container.cpu.usage.system:
        enabled: true
      container.memory.rss:
        enabled: true
      container.blockio.io_serviced_recursive:
        enabled: true
      container.uptime:
        enabled: true
      container.memory.hierarchical_memory_limit:
        enabled: true
Data collected
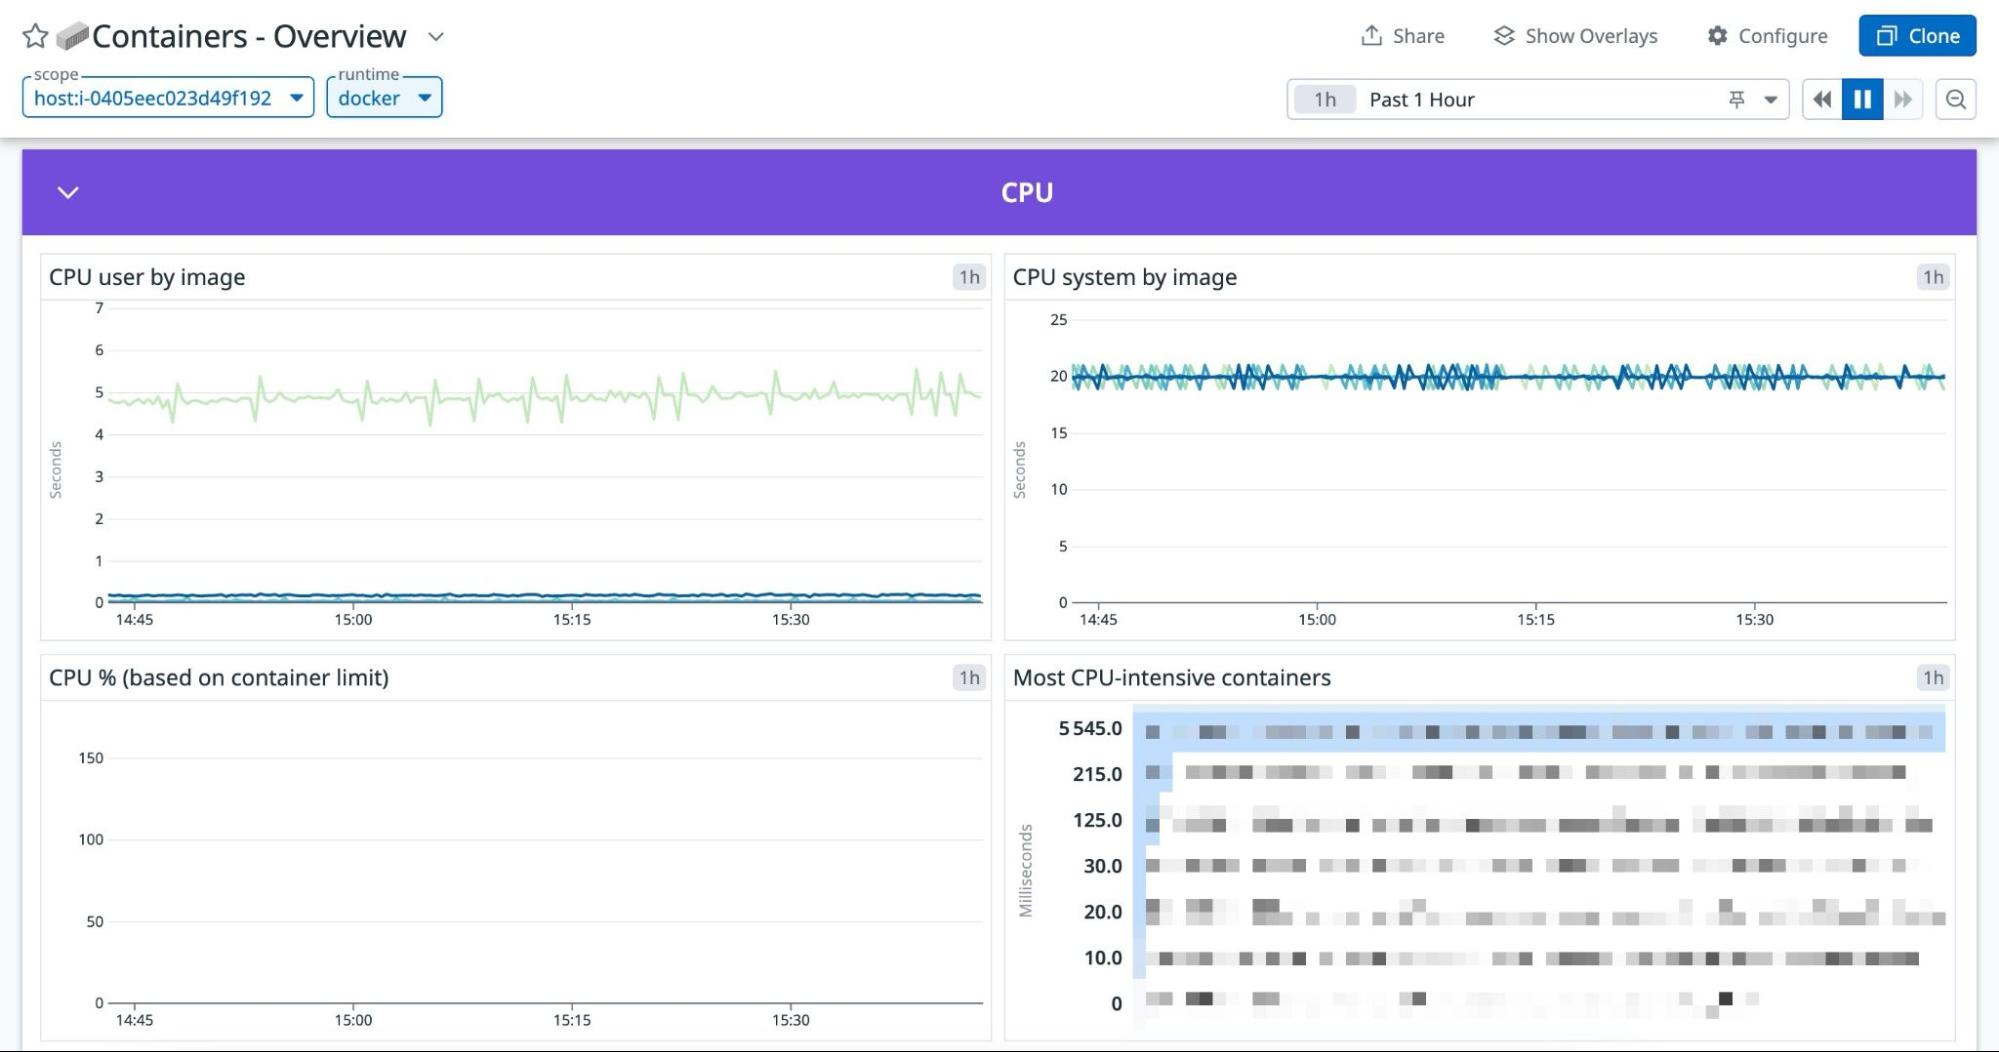
The Docker Stats receiver generates container metrics for the OpenTelemetry Collector. The Datadog Exporter translates container metrics to their Datadog counterparts for use in the following views:
- Containers Overview default dashboard
- APM Trace view with container metrics
Note: To correlate trace and container metrics, configure Universal Service Monitoring attributes for each service, and set the following resource attributes for each service:
k8s.container.namek8s.pod.namecontainer.namecontainer.id
Learn more about mapping between OpenTelemetry and Datadog semantic conventions for resource attributes.
The following table shows what Datadog container metric names are associated with corresponding OpenTelemetry container metric names
| Datadog Metric Name | OTel Docker Stats Metric Name | Metric Description |
|---|---|---|
container.cpu.usage | container.cpu.usage.total | The container total CPU Usage |
container.cpu.user | container.cpu.usage.usermode | The container userspace CPU usage |
container.cpu.system | container.cpu.usage.system | The container system CPU usage |
container.cpu.throttled | container.cpu. throttling_data.throttled_time | The total cpu throttled time |
container.cpu.throttled.periods | container.cpu. throttling_data.throttled_periods | The number of periods during which the container was throttled |
container.memory.usage | container.memory.usage.total | The container total memory usage |
container.memory.kernel | container.memory.active_anon | The container kernel memory usage |
container.memory.limit | container.memory. hierarchical_memory_limit | The container memory limit |
container.memory.soft_limit | container.memory.usage.limit | The container memory soft limit |
container.memory.cache | container.memory.total_cache | The container cache usage |
container.memory.swap | container.memory.total_swap | The container swap usage |
container.io.write | container.blockio. io_service_bytes_recursiveAttribute Filter operation= write | The number of bytes written to disks by this container |
container.io.read | container.blockio. io_service_bytes_recursiveAttribute Filter operation= read | The number of bytes read from disks by this container |
container.io.write.operations | container.blockio. io_serviced_recursiveAttribute Filter operation= write | The number of write operations done by this container |
container.io.read.operations | container.blockio. io_serviced_recursiveAttribute Filter operation= read | The number of read operations done by this container |
container.net.sent | container.network.io. usage.tx_bytes | The number of network bytes sent (per interface) |
container.net.sent.packets | container.network.io. usage.tx_packets | The number of network packets sent (per interface) |
container.net.rcvd | container.network.io. usage.rx_bytes | The number of network bytes received (per interface) |
container.net.rcvd.packets | container.network.io. usage.rx_packets | The number of network packets received (per interface) |
See OpenTelemetry Metrics Mapping for more information.
Full example configuration
For a full working example configuration with the Datadog exporter, see docker-stats.yaml.
Example logging output
Resource SchemaURL: https://opentelemetry.io/schemas/1.6.1
Resource attributes:
     -> container.runtime: Str(docker)
     -> container.hostname: Str(be51776e036e)
     -> container.id: Str(be51776e036e04461169fce2847d4e77be3d83856b474ad544143afc3d48e9e5)
     -> container.image.name: Str(sha256:9bdff337981de15f8cdf9e73b24af64a03e2e6dd1f156a274a15c1d8db98ab79)
     -> container.name: Str(redis-otel)
ScopeMetrics #0
ScopeMetrics SchemaURL:
InstrumentationScope otelcol/dockerstatsreceiver 0.89.0-dev
Metric #6
Descriptor:
     -> Name: container.cpu.utilization
     -> Description: Percent of CPU used by the container.
     -> Unit: 1
     -> DataType: Gauge
NumberDataPoints #0
StartTimestamp: 2023-11-20 14:58:17.522765 +0000 UTC
Timestamp: 2023-11-20 14:58:19.550208 +0000 UTC
Value: 0.170933

