- Essentials
- Getting Started
- Datadog
- Datadog Site
- DevSecOps
- Serverless for AWS Lambda
- Agent
- Integrations
- Containers
- Dashboards
- Monitors
- Logs
- APM Tracing
- Profiler
- Tags
- API
- Service Catalog
- Session Replay
- Continuous Testing
- Synthetic Monitoring
- Incident Management
- Database Monitoring
- Cloud Security Management
- Cloud SIEM
- Application Security Management
- Workflow Automation
- CI Visibility
- Test Visibility
- Test Impact Analysis
- Code Analysis
- Learning Center
- Support
- Glossary
- Standard Attributes
- Guides
- Agent
- Integrations
- OpenTelemetry
- Developers
- Authorization
- DogStatsD
- Custom Checks
- Integrations
- Create an Agent-based Integration
- Create an API Integration
- Create a Log Pipeline
- Integration Assets Reference
- Build a Marketplace Offering
- Create a Tile
- Create an Integration Dashboard
- Create a Recommended Monitor
- Create a Cloud SIEM Detection Rule
- OAuth for Integrations
- Install Agent Integration Developer Tool
- Service Checks
- IDE Plugins
- Community
- Guides
- API
- Datadog Mobile App
- CoScreen
- Cloudcraft
- In The App
- Dashboards
- Notebooks
- DDSQL Editor
- Sheets
- Monitors and Alerting
- Infrastructure
- Metrics
- Watchdog
- Bits AI
- Service Catalog
- API Catalog
- Error Tracking
- Service Management
- Infrastructure
- Application Performance
- APM
- Continuous Profiler
- Database Monitoring
- Data Streams Monitoring
- Data Jobs Monitoring
- Digital Experience
- Real User Monitoring
- Product Analytics
- Synthetic Testing and Monitoring
- Continuous Testing
- Software Delivery
- CI Visibility
- CD Visibility
- Test Optimization
- Code Analysis
- Quality Gates
- DORA Metrics
- Security
- Security Overview
- Cloud SIEM
- Cloud Security Management
- Application Security Management
- AI Observability
- Log Management
- Observability Pipelines
- Log Management
- Administration
Synthetic Dashboards
Overview
When you create a Synthetic test, Datadog collects data and generates dashboards about your stack, browser applications, or overall tests’ performance, private locations, and events.
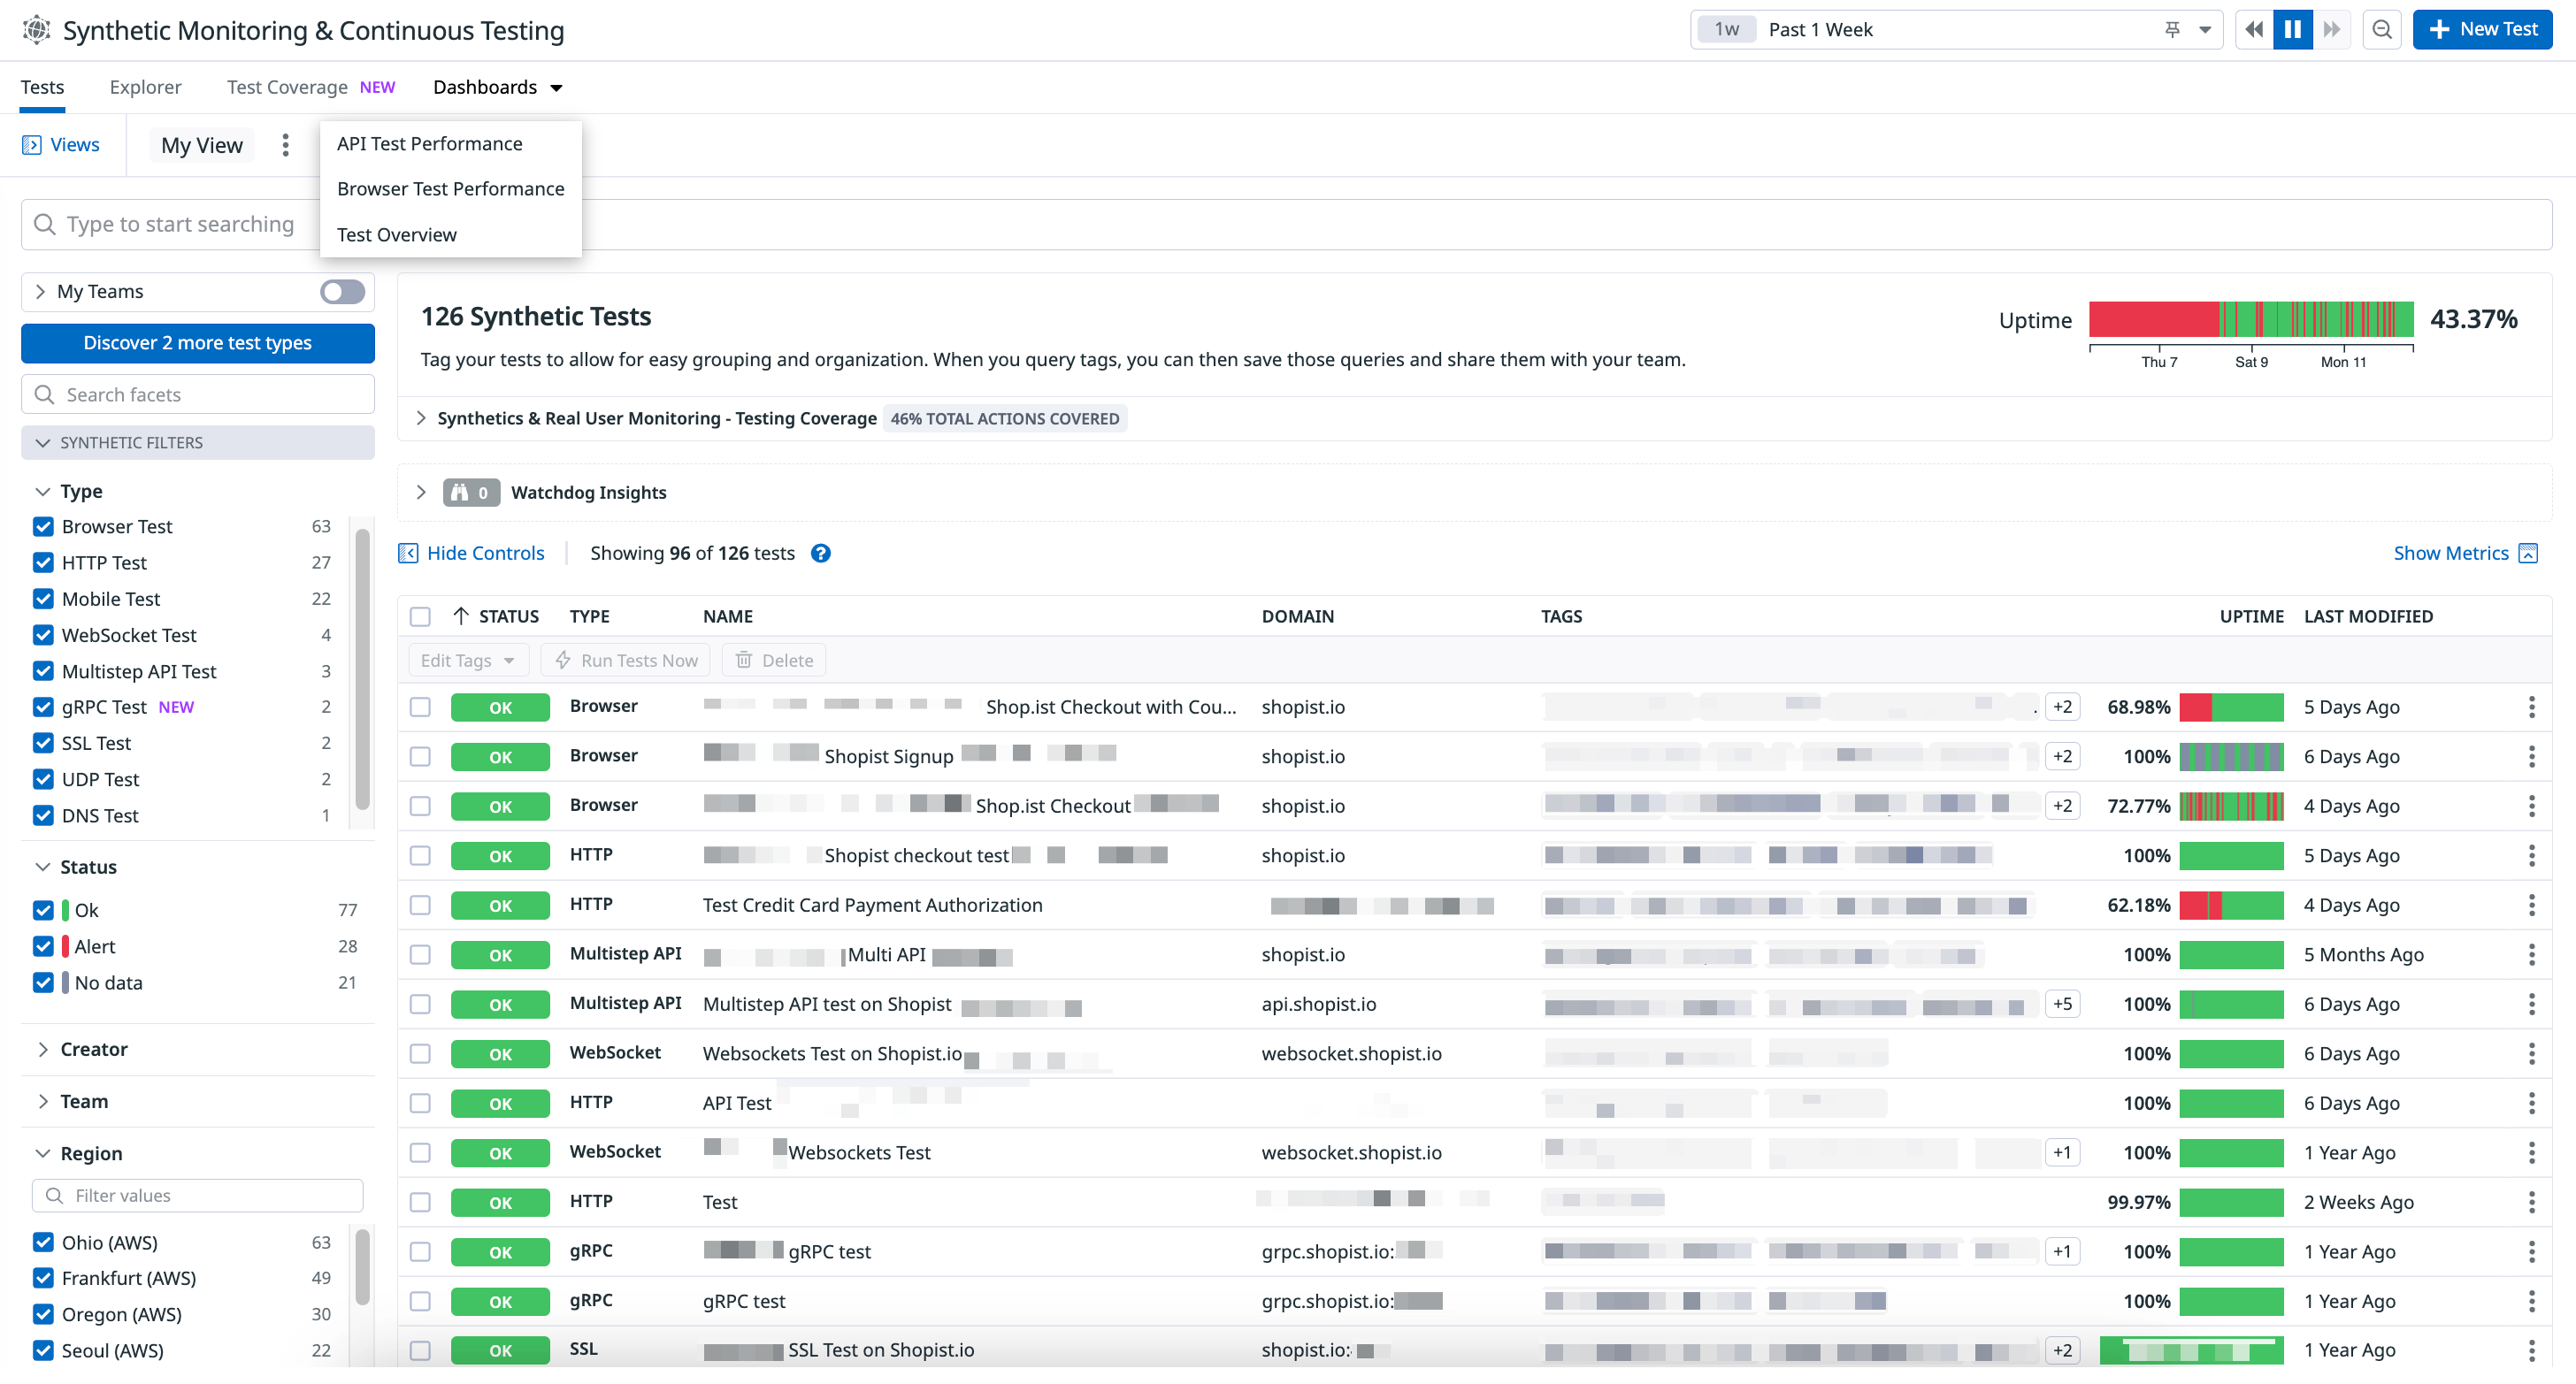
Access your Synthetic dashboards by filtering for Synthetics in the search query of the Dashboard List or by clicking on the dropdown menu under Dashboards on the Synthetic Monitoring & Continuous Testing page.
You can explore the following out-of-the-box Synthetic dashboards:
Customize your Synthetic dashboards
You can clone dashboards and customize them by team, environment, or region using template variables. You can also customize your view and create a saved view of your cloned dashboard.
Edit template variables
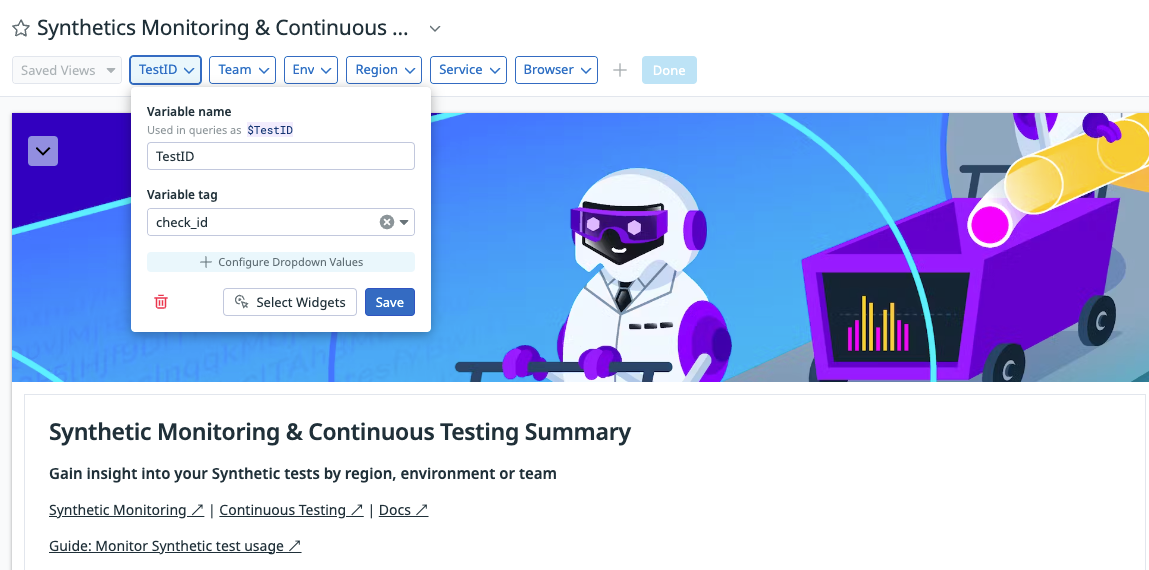
The generated Synthetic dashboards automatically contain a set of default template variables. Use the template variable dropdown menus to narrow the data shown in the dashboard. For example, you can filter for a specific browser type with the Browser template variable. For more information, see the Template Variables documentation. To clone your Synthetic dashboard, click the Clone button next to the Configure icon.
The Synthetic dashboard has a default view which you can adjust. Click the Edit icon to enter edit mode and customize your template variables.
Create a saved view
Once you are done editing, click Done and select Save selections as view from the left hand dropdown menu.
Enter a name for your saved view and click Save.
Further Reading
Additional helpful documentation, links, and articles:


