- Essentials
- Getting Started
- Datadog
- Datadog Site
- DevSecOps
- Serverless for AWS Lambda
- Agent
- Integrations
- Containers
- Dashboards
- Monitors
- Logs
- APM Tracing
- Profiler
- Tags
- API
- Service Catalog
- Session Replay
- Continuous Testing
- Synthetic Monitoring
- Incident Management
- Database Monitoring
- Cloud Security Management
- Cloud SIEM
- Application Security Management
- Workflow Automation
- CI Visibility
- Test Visibility
- Test Impact Analysis
- Code Analysis
- Learning Center
- Support
- Glossary
- Standard Attributes
- Guides
- Agent
- Integrations
- OpenTelemetry
- Developers
- Authorization
- DogStatsD
- Custom Checks
- Integrations
- Create an Agent-based Integration
- Create an API Integration
- Create a Log Pipeline
- Integration Assets Reference
- Build a Marketplace Offering
- Create a Tile
- Create an Integration Dashboard
- Create a Recommended Monitor
- Create a Cloud SIEM Detection Rule
- OAuth for Integrations
- Install Agent Integration Developer Tool
- Service Checks
- IDE Plugins
- Community
- Guides
- API
- Datadog Mobile App
- CoScreen
- Cloudcraft
- In The App
- Dashboards
- Notebooks
- DDSQL Editor
- Sheets
- Monitors and Alerting
- Infrastructure
- Metrics
- Watchdog
- Bits AI
- Service Catalog
- API Catalog
- Error Tracking
- Service Management
- Infrastructure
- Application Performance
- APM
- Continuous Profiler
- Database Monitoring
- Data Streams Monitoring
- Data Jobs Monitoring
- Digital Experience
- Real User Monitoring
- Product Analytics
- Synthetic Testing and Monitoring
- Continuous Testing
- Software Delivery
- CI Visibility
- CD Visibility
- Test Optimization
- Code Analysis
- Quality Gates
- DORA Metrics
- Security
- Security Overview
- Cloud SIEM
- Cloud Security Management
- Application Security Management
- AI Observability
- Log Management
- Observability Pipelines
- Log Management
- Administration
Tutorial - Enabling Tracing for a Python Application and Datadog Agent in Containers
Overview
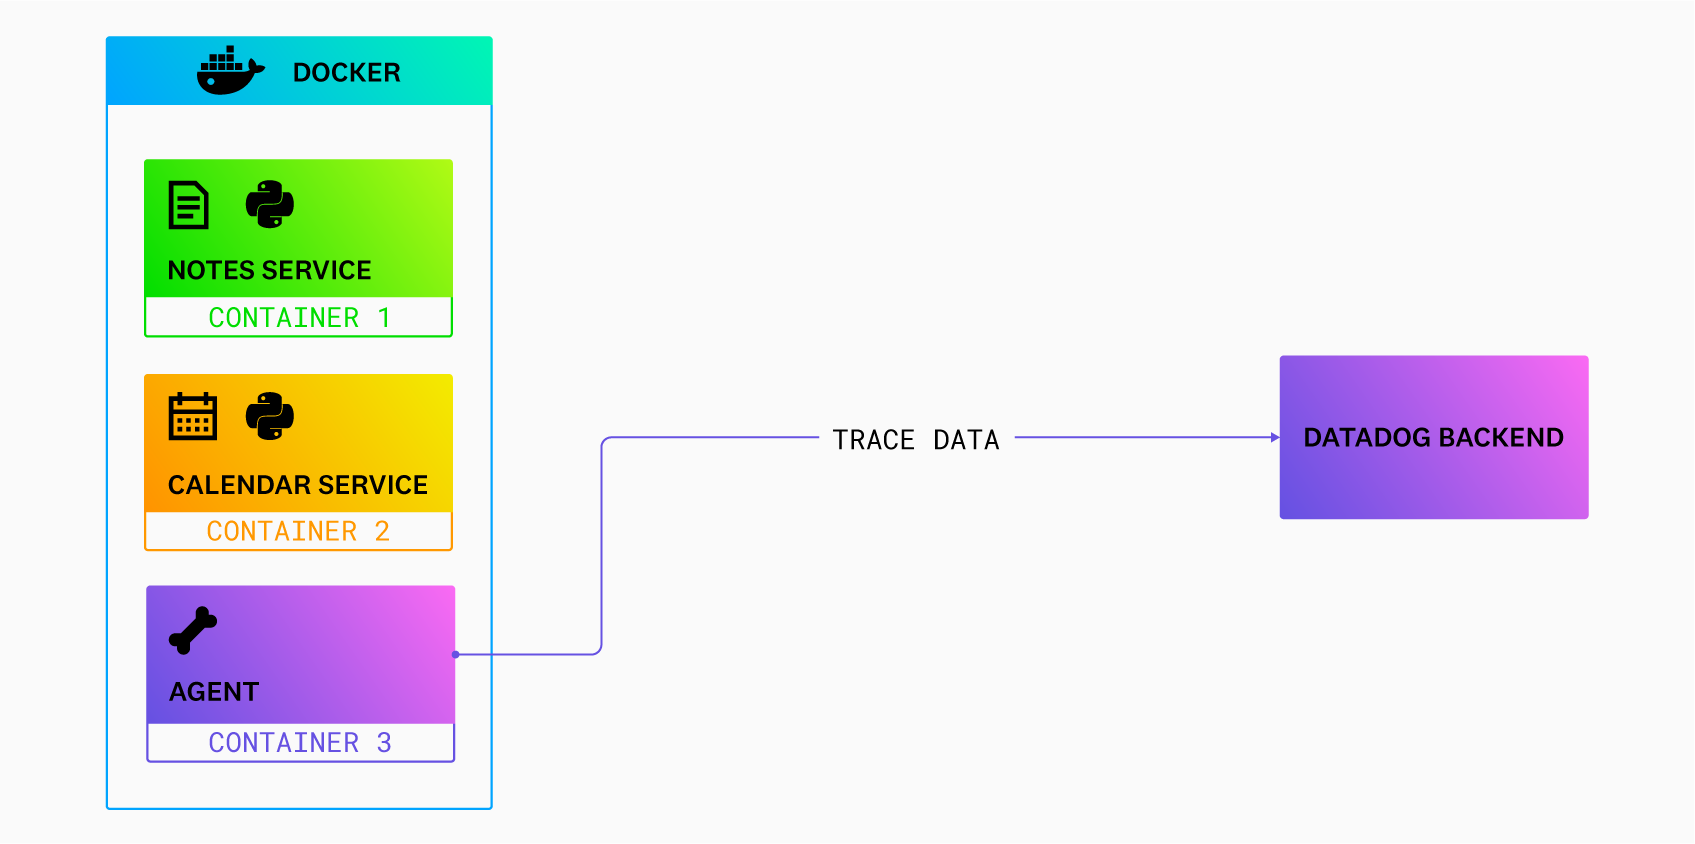
This tutorial walks you through the steps for enabling tracing on a sample Python application installed in a container. In this scenario, the Datadog Agent is also installed in a container.
For other scenarios, including the application and Agent on a host, the application in a container and Agent on a host, and on applications written in other languages, see the other Enabling Tracing tutorials.
See Tracing Python Applications for general comprehensive tracing setup documentation for Python.
Prerequisites
- A Datadog account and organization API key
- Git
- Python that meets the tracing library requirements
Install the sample Dockerized Python application
The code sample for this tutorial is on GitHub, at github.com/Datadog/apm-tutorial-python. To get started, clone the repository:
git clone https://github.com/DataDog/apm-tutorial-python.gitThe repository contains a multi-service Python application pre-configured to be run within Docker containers. The sample app is a basic notes app with a REST API to add and change data.
Starting and exercising the sample application
Build the application’s container by running:
docker-compose -f docker/containers/exercise/docker-compose.yaml build notes_appStart the container:
docker-compose -f docker/containers/exercise/docker-compose.yaml up db notes_appThe application is ready to use when you see the following output in the terminal:
notes          |  * Debug mode: on
notes          | INFO:werkzeug:WARNING: This is a development server. Do not use it in a production deployment. Use a production WSGI server instead.
notes          |  * Running on all addresses (0.0.0.0)
notes          |  * Running on http://127.0.0.1:8080
notes          |  * Running on http://192.168.32.3:8080
notes          | INFO:werkzeug:Press CTRL+C to quit
notes          | INFO:werkzeug: * Restarting with stat
notes          | WARNING:werkzeug: * Debugger is active!
notes          | INFO:werkzeug: * Debugger PIN: 143-375-699
You can also verify that it’s running by viewing the running containers with the
docker pscommand.Open up another terminal and send API requests to exercise the app. The notes application is a REST API that stores data in a Postgres database running in another container. Send it a few commands:
curl -X GET 'localhost:8080/notes'{}curl -X POST 'localhost:8080/notes?desc=hello'(1, hello)curl -X GET 'localhost:8080/notes?id=1'(1, hello)curl -X GET 'localhost:8080/notes'{”1”, "hello"}curl -X PUT 'localhost:8080/notes?id=1&desc=UpdatedNote'(1, UpdatedNote)curl -X DELETE 'localhost:8080/notes?id=1'Deleted
Stop the application
After you’ve seen the application running, stop it so that you can enable tracing on it.
Stop the containers:
docker-compose -f docker/containers/exercise/docker-compose.yaml downRemove the containers:
docker-compose -f docker/containers/exercise/docker-compose.yaml rm
Enable tracing
Now that you have a working Python application, configure it to enable tracing.
Add the Python tracing package to your project. Open the file
apm-tutorial-python/requirements.txt, and addddtraceto the list if it is not already there:flask==2.2.2 psycopg2-binary==2.9.3 requests==2.28.1 ddtraceWithin the notes application Dockerfile,
docker/containers/exercise/Dockerfile.notes, change the CMD line that starts the application to use theddtracepackage:# Run the application with Datadog CMD ["ddtrace-run", "python", "-m", "notes_app.app"]This automatically instruments the application with Datadog services.
Apply Universal Service Tags, which identify traced services across different versions and deployment environments so that they can be correlated within Datadog, and you can use them to search and filter. The three environment variables used for Unified Service Tagging are
DD_SERVICE,DD_ENV, andDD_VERSION. Add the following environment variables in the Dockerfile:ENV DD_SERVICE="notes" ENV DD_ENV="dev" ENV DD_VERSION="0.1.0"Add Docker labels that correspond to the Universal Service Tags. This allows you also to get Docker metrics once your application is running.
LABEL com.datadoghq.tags.service="notes"
LABEL com.datadoghq.tags.env="dev"
LABEL com.datadoghq.tags.version="0.1.0"
To check that you’ve set things up correctly, compare your Dockerfile file with the one provided in the sample repository’s solution file, docker/containers/solution/Dockerfile.notes.
Add the Agent container
Add the Datadog Agent in the services section of the docker/containers/exercise/docker-compose.yaml file:
Add the Agent configuration, and specify your own Datadog API key and site:
  datadog:
    container_name: dd-agent
    image: "gcr.io/datadoghq/agent:latest"
    environment:
       - DD_API_KEY=<DD_API_KEY>
       - DD_SITE=datadoghq.com  # Default. Change to eu.datadoghq.com, us3.datadoghq.com, us5.datadoghq.com as appropriate for your org
       - DD_APM_ENABLED=true    # Enable APM
    volumes:
       - /var/run/docker.sock:/var/run/docker.sock:ro
       - /proc/:/host/proc/:ro
       - /sys/fs/cgroup/:/host/sys/fs/cgroup:ro
Add the environment variable
DD_AGENT_HOSTand specify the hostname of the Agent container to the section for each container with code that you want to monitor, in this case, thenotes_appcontainer:environment: - DD_AGENT_HOST=datadog
To check that you’ve set things up correctly, compare your docker-compose.yaml file with the one provided in the sample repository’s solution file, docker/containers/solution/docker-compose.yaml.
Launch the containers to see automatic tracing
Now that the Tracing Library is installed, restart your application and start receiving traces. Run the following commands:
docker-compose -f docker/containers/exercise/docker-compose.yaml build notes_app
docker-compose -f docker/containers/exercise/docker-compose.yaml up db datadog notes_app
You can tell the Agent is working by observing continuous output in the terminal, or by opening the Events Explorer in Datadog and seeing the start event for the Agent:
With the application running, send some curl requests to it:
curl -X POST 'localhost:8080/notes?desc=hello'(1, hello)curl -X GET 'localhost:8080/notes?id=1'(1, hello)curl -X PUT 'localhost:8080/notes?id=1&desc=UpdatedNote'(1, UpdatedNote)curl -X DELETE 'localhost:8080/notes?id=1'Deleted
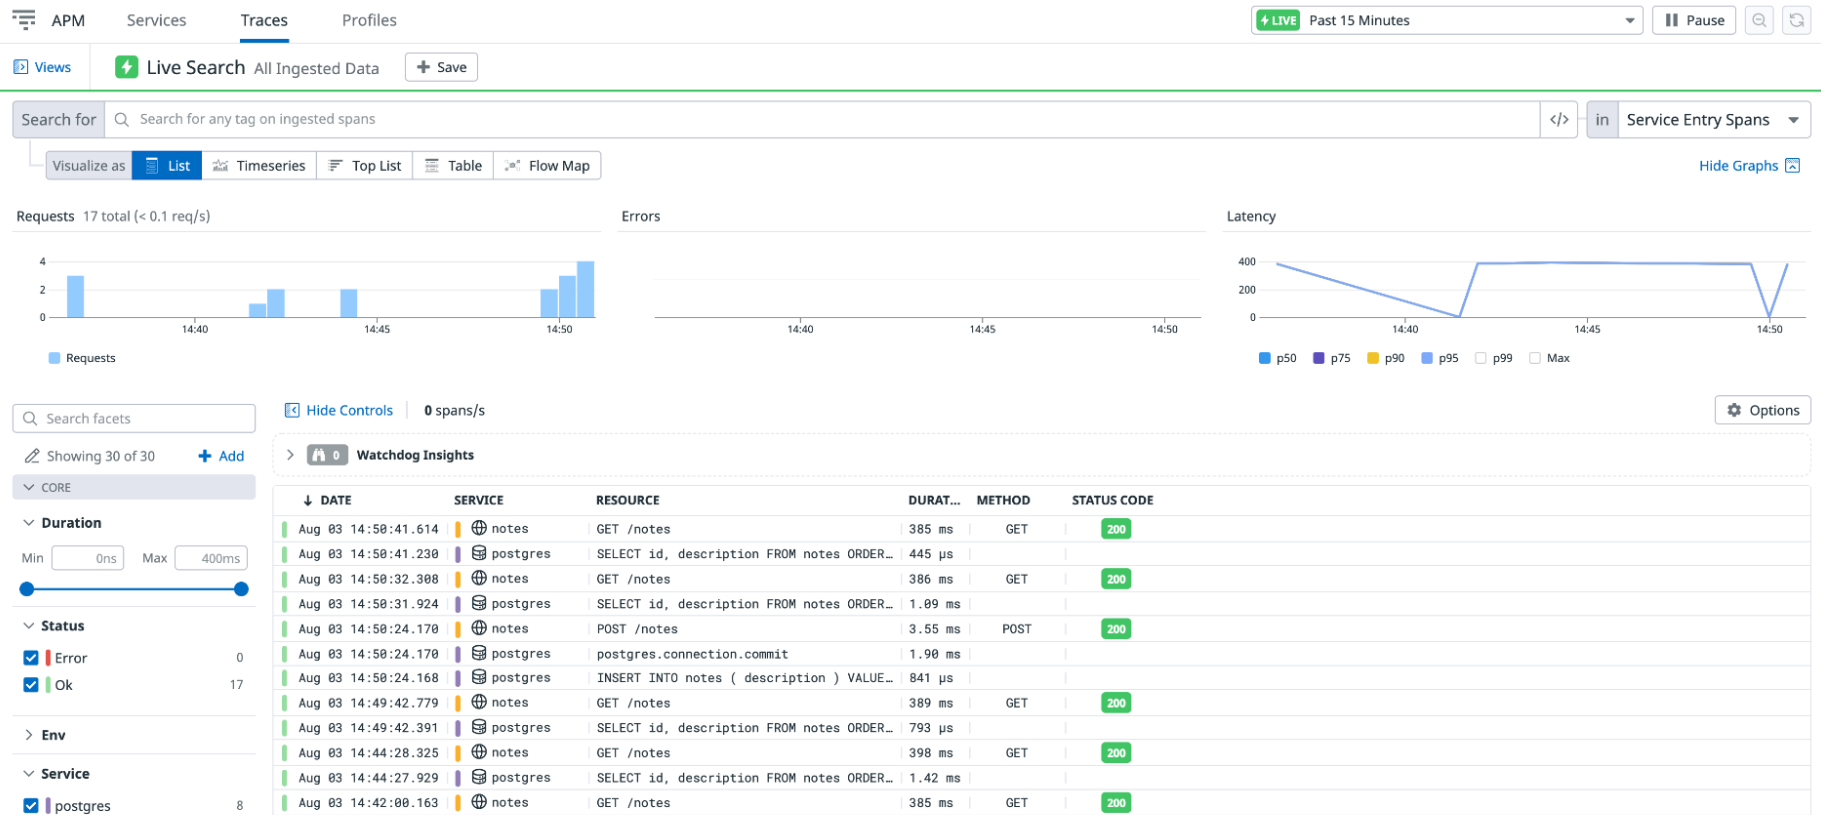
Wait a few moments, and go to APM > Traces in Datadog, where you can see a list of traces corresponding to your API calls:
If you don’t see traces after several minutes, clear any filter in the Traces Search field (sometimes it filters on an environment variable such as ENV that you aren’t using).
Examine a trace
On the Traces page, click on a POST /notes trace to see a flame graph that shows how long each span took and what other spans occurred before a span completed. The bar at the top of the graph is the span you selected on the previous screen (in this case, the initial entry point into the notes application).
The width of a bar indicates how long it took to complete. A bar at a lower depth represents a span that completes during the lifetime of a bar at a higher depth.
The flame graph for a POST trace looks something like this:
A GET /notes trace looks something like this:
Add custom instrumentation to the Python application
Automatic instrumentation is convenient, but sometimes you want more fine-grained spans. Datadog’s Python DD Trace API allows you to specify spans within your code using annotations or code.
The following steps walk you through adding annotations to the code to trace some sample methods.
Open
notes_app/notes_helper.py.Add the following import:
from ddtrace import tracerInside the
NotesHelperclass, add a tracer wrapper callednotes_helperto better see how thenotes_helper.long_running_processmethod works:class NotesHelper: @tracer.wrap(service="notes_helper") def long_running_process(self): time.sleep(.3) logging.info("Hello from the long running process") self.__private_method_1()Now, the tracer automatically labels the resource with the function name it is wrapped around, in this case,
long_running_process.Rebuild the containers by running:
docker-compose -f docker/containers/exercise/docker-compose.yaml build notes_app
docker-compose -f docker/containers/exercise/docker-compose.yaml up db datadog notes_app
Resend some HTTP requests, specifically some
GETrequests.On the Trace Explorer, click on one of the new
GETrequests, and see a flame graph like this:Note the higher level of detail in the stack trace now that the
get_notesfunction has custom tracing.
For more information, read Custom Instrumentation.
Add a second application to see distributed traces
Tracing a single application is a great start, but the real value in tracing is seeing how requests flow through your services. This is called distributed tracing.
The sample project includes a second application called calendar_app that returns a random date whenever it is invoked. The POST endpoint in the Notes application has a second query parameter named add_date. When it is set to y, Notes calls the calendar application to get a date to add to the note.
Configure the calendar app for tracing by adding
dd_traceto the startup command in the Dockerfile, like you previously did for the notes app. Opendocker/containers/exercise/Dockerfile.calendarand update the CMD line like this:CMD ["ddtrace-run", "python", "-m", "calendar_app.app"]Apply Universal Service Tags, just like we did for the notes app. Add the following environment variables in the
Dockerfile.calendarfile:ENV DD_SERVICE="calendar" ENV DD_ENV="dev" ENV DD_VERSION="0.1.0"Again, add Docker labels that correspond to the Universal Service Tags, allowing you to also get Docker metrics once your application runs.
LABEL com.datadoghq.tags.service="calendar"
LABEL com.datadoghq.tags.env="dev"
LABEL com.datadoghq.tags.version="0.1.0"
Add the Agent container hostname,
DD_AGENT_HOST, to the calendar application container to send traces to the correct location. Opendocker/containers/exercise/docker-compose.yamland add the following lines to thecalendar_appsection:environment: - DD_AGENT_HOST=datadogTo check that you’ve set things up correctly, compare your setup with the Dockerfile and
docker-config.yamlfiles provided in the sample repository’sdocker/containers/solutiondirectory.Build the multi-service application by restarting the containers. First, stop all running containers:
docker-compose -f docker/containers/exercise/docker-compose.yaml downThen run the following commands to start them:
docker-compose -f docker/containers/exercise/docker-compose.yaml build
docker-compose -f docker/containers/exercise/docker-compose.yaml up
Send a POST request with the
add_dateparameter:
curl -X POST 'localhost:8080/notes?desc=hello_again&add_date=y'(2, hello_again with date 2022-11-06)
In the Trace Explorer, click this latest trace to see a distributed trace between the two services:
Add more custom instrumentation
You can add custom instrumentation by using code. Suppose you want to further instrument the calendar service to better see the trace:
Open
notes_app/notes_logic.py.Add the following import
from ddtrace import tracerInside the
tryblock, at about line 28, add the followingwithstatement:with tracer.trace(name="notes_helper", service="notes_helper", resource="another_process") as span:Resulting in this:
def create_note(self, desc, add_date=None):
        if (add_date):
            if (add_date.lower() == "y"):
                try:
                    with tracer.trace(name="notes_helper", service="notes_helper", resource="another_process") as span:
                        self.nh.another_process()
                    note_date = requests.get(f"http://localhost:9090/calendar")
                    note_date = note_date.text
                    desc = desc + " with date " + note_date
                    print(desc)
                except Exception as e:
                    print(e)
                    raise IOError("Cannot reach calendar service.")
        note = Note(description=desc, id=None)
        note.id = self.db.create_note(note)
Rebuild the containers:
docker-compose -f docker/containers/exercise/docker-compose.yaml build notes_app
docker-compose -f docker/containers/exercise/docker-compose.yaml up
Send some more HTTP requests, specifically
POSTrequests, with theadd_dateargument.In the Trace Explorer, click into one of these new
Note the new span labeledPOSTtraces to see a custom trace across multiple services:notes_helper.another_process.
If you’re not receiving traces as expected, set up debug mode in the ddtrace Python package. Read Enable debug mode to find out more.
Further reading
Additional helpful documentation, links, and articles:


