- Essentials
- Getting Started
- Datadog
- Datadog Site
- DevSecOps
- Serverless for AWS Lambda
- Agent
- Integrations
- Containers
- Dashboards
- Monitors
- Logs
- APM Tracing
- Profiler
- Tags
- API
- Service Catalog
- Session Replay
- Continuous Testing
- Synthetic Monitoring
- Incident Management
- Database Monitoring
- Cloud Security Management
- Cloud SIEM
- Application Security Management
- Workflow Automation
- CI Visibility
- Test Visibility
- Test Impact Analysis
- Code Analysis
- Learning Center
- Support
- Glossary
- Standard Attributes
- Guides
- Agent
- Integrations
- OpenTelemetry
- Developers
- Authorization
- DogStatsD
- Custom Checks
- Integrations
- Create an Agent-based Integration
- Create an API Integration
- Create a Log Pipeline
- Integration Assets Reference
- Build a Marketplace Offering
- Create a Tile
- Create an Integration Dashboard
- Create a Recommended Monitor
- Create a Cloud SIEM Detection Rule
- OAuth for Integrations
- Install Agent Integration Developer Tool
- Service Checks
- IDE Plugins
- Community
- Guides
- Administrator's Guide
- API
- Datadog Mobile App
- CoScreen
- Cloudcraft
- In The App
- Dashboards
- Notebooks
- DDSQL Editor
- Sheets
- Monitors and Alerting
- Infrastructure
- Metrics
- Watchdog
- Bits AI
- Service Catalog
- API Catalog
- Error Tracking
- Service Management
- Infrastructure
- Application Performance
- APM
- Continuous Profiler
- Database Monitoring
- Data Streams Monitoring
- Data Jobs Monitoring
- Digital Experience
- Real User Monitoring
- Product Analytics
- Synthetic Testing and Monitoring
- Continuous Testing
- Software Delivery
- CI Visibility
- CD Visibility
- Test Optimization
- Code Analysis
- Quality Gates
- DORA Metrics
- Security
- Security Overview
- Cloud SIEM
- Cloud Security Management
- Application Security Management
- AI Observability
- Log Management
- Observability Pipelines
- Log Management
- Administration
Monitoring APIs
Overview
After you have registered your endpoints and assigned team ownership, you can start managing and improving them. Use API Catalog to start activities such as:
- Detecting and investigating APIs that are underperforming.
- Creating alerts based on key performance metrics such as latency and error rate.
- Keeping track of an API’s reliability in terms of triggered alerts, test results, and security signals.
- Standardizing API testing and improving test coverage with Synthetic Monitoring.
After you have registered endpoints, Datadog starts collecting a new endpoint metric for better monitoring capabilities. It might take some time for the metric to display, depending on the traffic of the registered endpoints.
Alerting on endpoints that deviate from expected performance
You can set up monitors to alert you if something causes your endpoints to perform unexpectedly (like occasionally slow performance), to report outlier data (like extremely slow performance or rare errors), or to achieve metrics beyond a desired threshold (high error rates).
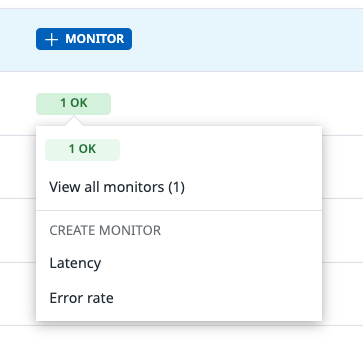
The latest monitor status is displayed in the Explorer where you can see more information about why a monitor is alerting and how to address it. You can also determine if you should launch an investigation by clicking through to view the monitors.
You can also create a monitor on Latency or Error rate directly from API Catalog by clicking + Monitor in the MONITORS column. Read Alerting for additional information about setting up and managing monitor alerts.
Tracking and improving API test coverage
Using synthetic API tests, you can set up automated scheduled tests of your endpoints that alert you if the tests fail so you can diagnose and fix the problem.
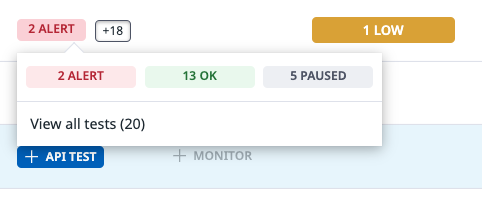
The API TESTS column on the Explorer page shows you which of your endpoints have tests and if any of them are failing. If tests are failing, the test status to investigate further.
Click + API Test in the API TESTS column to create another synthetic API test for this endpoint. Read the documentation about Synthetic HTTP API Tests for more information about setting up tests.
Finding and closing security gaps
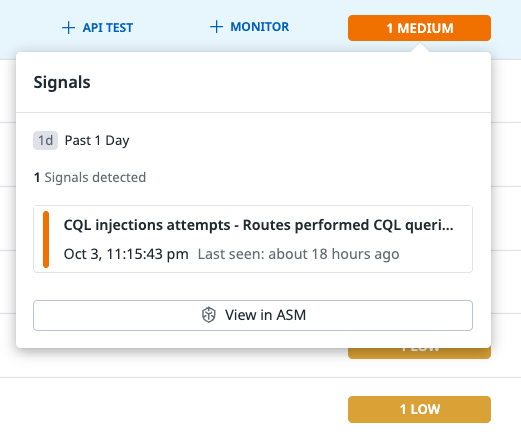
Powered by Datadog Application Security Management (ASM), the SECURITY SIGNALS column in the Explorer shows you if ASM has detected threats to the services associated with your endpoints. Sort the table by this column to see which of your endpoints are most affected. Click View in ASM to investigate and address the threats and vulnerabilities in your code or your upstream dependencies.
Further reading
Additional helpful documentation, links, and articles:


