- Esenciales
- Empezando
- Datadog
- Sitio web de Datadog
- DevSecOps
- Serverless para Lambda AWS
- Agent
- Integraciones
- Contenedores
- Dashboards
- Monitores
- Logs
- Rastreo de APM
- Generador de perfiles
- Etiquetas (tags)
- API
- Catálogo de servicios
- Session Replay
- Continuous Testing
- Monitorización Synthetic
- Gestión de incidencias
- Monitorización de bases de datos
- Cloud Security Management
- Cloud SIEM
- Application Security Management
- Workflow Automation
- CI Visibility
- Test Visibility
- Intelligent Test Runner
- Análisis de código
- Centro de aprendizaje
- Compatibilidad
- Glosario
- Atributos estándar
- Guías
- Agent
- Uso básico del Agent
- Arquitectura
- IoT
- Plataformas compatibles
- Recopilación de logs
- Configuración
- Configuración remota
- Automatización de flotas
- Actualizar el Agent
- Solucionar problemas
- Detección de nombres de host en contenedores
- Modo de depuración
- Flare del Agent
- Estado del check del Agent
- Problemas de NTP
- Problemas de permisos
- Problemas de integraciones
- Problemas del sitio
- Problemas de Autodiscovery
- Problemas de contenedores de Windows
- Configuración del tiempo de ejecución del Agent
- Consumo elevado de memoria o CPU
- Guías
- Seguridad de datos
- Integraciones
- OpenTelemetry
- Desarrolladores
- Autorización
- DogStatsD
- Checks personalizados
- Integraciones
- Crear una integración basada en el Agent
- Crear una integración API
- Crear un pipeline de logs
- Referencia de activos de integración
- Crear una oferta de mercado
- Crear un cuadro
- Crear un dashboard de integración
- Crear un monitor recomendado
- Crear una regla de detección Cloud SIEM
- OAuth para integraciones
- Instalar la herramienta de desarrollo de integraciones del Agente
- Checks de servicio
- Complementos de IDE
- Comunidad
- Guías
- API
- Aplicación móvil de Datadog
- CoScreen
- Cloudcraft
- En la aplicación
- Dashboards
- Notebooks
- Editor DDSQL
- Hojas
- Monitores y alertas
- Infraestructura
- Métricas
- Watchdog
- Bits AI
- Catálogo de servicios
- Catálogo de APIs
- Error Tracking
- Gestión de servicios
- Objetivos de nivel de servicio (SLOs)
- Gestión de incidentes
- De guardia
- Gestión de eventos
- Gestión de casos
- Workflow Automation
- App Builder
- Infraestructura
- Universal Service Monitoring
- Contenedores
- Serverless
- Monitorización de red
- Coste de la nube
- Rendimiento de las aplicaciones
- APM
- Términos y conceptos de APM
- Instrumentación de aplicación
- Recopilación de métricas de APM
- Configuración de pipelines de trazas
- Correlacionar trazas (traces) y otros datos de telemetría
- Trace Explorer
- Observabilidad del servicio
- Instrumentación dinámica
- Error Tracking
- Seguridad de los datos
- Guías
- Solucionar problemas
- Continuous Profiler
- Database Monitoring
- Gastos generales de integración del Agent
- Arquitecturas de configuración
- Configuración de Postgres
- Configuración de MySQL
- Configuración de SQL Server
- Configuración de Oracle
- Configuración de MongoDB
- Conexión de DBM y trazas
- Datos recopilados
- Explorar hosts de bases de datos
- Explorar métricas de consultas
- Explorar ejemplos de consulta
- Solucionar problemas
- Guías
- Data Streams Monitoring
- Data Jobs Monitoring
- Experiencia digital
- Real User Monitoring
- Monitorización del navegador
- Configuración
- Configuración avanzada
- Datos recopilados
- Monitorización del rendimiento de páginas
- Monitorización de signos vitales de rendimiento
- Monitorización del rendimiento de recursos
- Recopilación de errores del navegador
- Rastrear las acciones de los usuarios
- Señales de frustración
- Error Tracking
- Solucionar problemas
- Monitorización de móviles y TV
- Plataforma
- Session Replay
- Exploración de datos de RUM
- Feature Flag Tracking
- Error Tracking
- Guías
- Seguridad de los datos
- Monitorización del navegador
- Análisis de productos
- Pruebas y monitorización de Synthetics
- Continuous Testing
- Entrega de software
- CI Visibility
- CD Visibility
- Test Visibility
- Configuración
- Tests en contenedores
- Búsqueda y gestión
- Explorador
- Monitores
- Flujos de trabajo de desarrolladores
- Cobertura de código
- Instrumentar tests de navegador con RUM
- Instrumentar tests de Swift con RUM
- Detección temprana de defectos
- Reintentos automáticos de tests
- Correlacionar logs y tests
- Guías
- Solucionar problemas
- Intelligent Test Runner
- Code Analysis
- Quality Gates
- Métricas de DORA
- Seguridad
- Información general de seguridad
- Cloud SIEM
- Cloud Security Management
- Application Security Management
- Observabilidad de la IA
- Log Management
- Observability Pipelines
- Gestión de logs
- Administración
- Gestión de cuentas
- Seguridad de los datos
- Sensitive Data Scanner
- Ayuda
Overview Page
This page is not yet available in Spanish. We are working on its translation.
If you have any questions or feedback about our current translation project, feel free to reach out to us!
If you have any questions or feedback about our current translation project, feel free to reach out to us!
Overview
The NPM overview page provides a high-level overview of your network, from costly network traffic to DNS health to service top talkers. Use the Overview page to filter network traffic by environment or team with tags, and adjust the time frame for your network data.
External network traffic
Use the External Network Traffic section to get an overview of costly network traffic. Egress traffic that leaves your network is a common cost source, so determining which external endpoints have the most traffic reaching them is helpful to ensure that traffic volume remains within an expected range. For example, Top AWS gateway users shows top endpoints communicating to an AWS Internet Gateway or AWS NAT Gateway. AWS PrivateLink eligible traffic shows traffic that could leverage AWS PrivateLink to reduce the overall cost of traffic.
To dig deeper into any of these areas, click the View in Analytics button at the bottom right of each section of the overview page. The Analytics page opens with the query pre-populated so you can continue your investigation.
Application and dependency top talkers
Application and Dependency Top Talkers allow you to select a specific endpoint in your network and look at top traffic sources upstream and downstream of the endpoint. Select See all Dependencies to see the highest traffic dependencies both upstream and downstream of the endpoint, and toggle between the graph (timeseries) view and top list view for the selected time frame.
DNS health
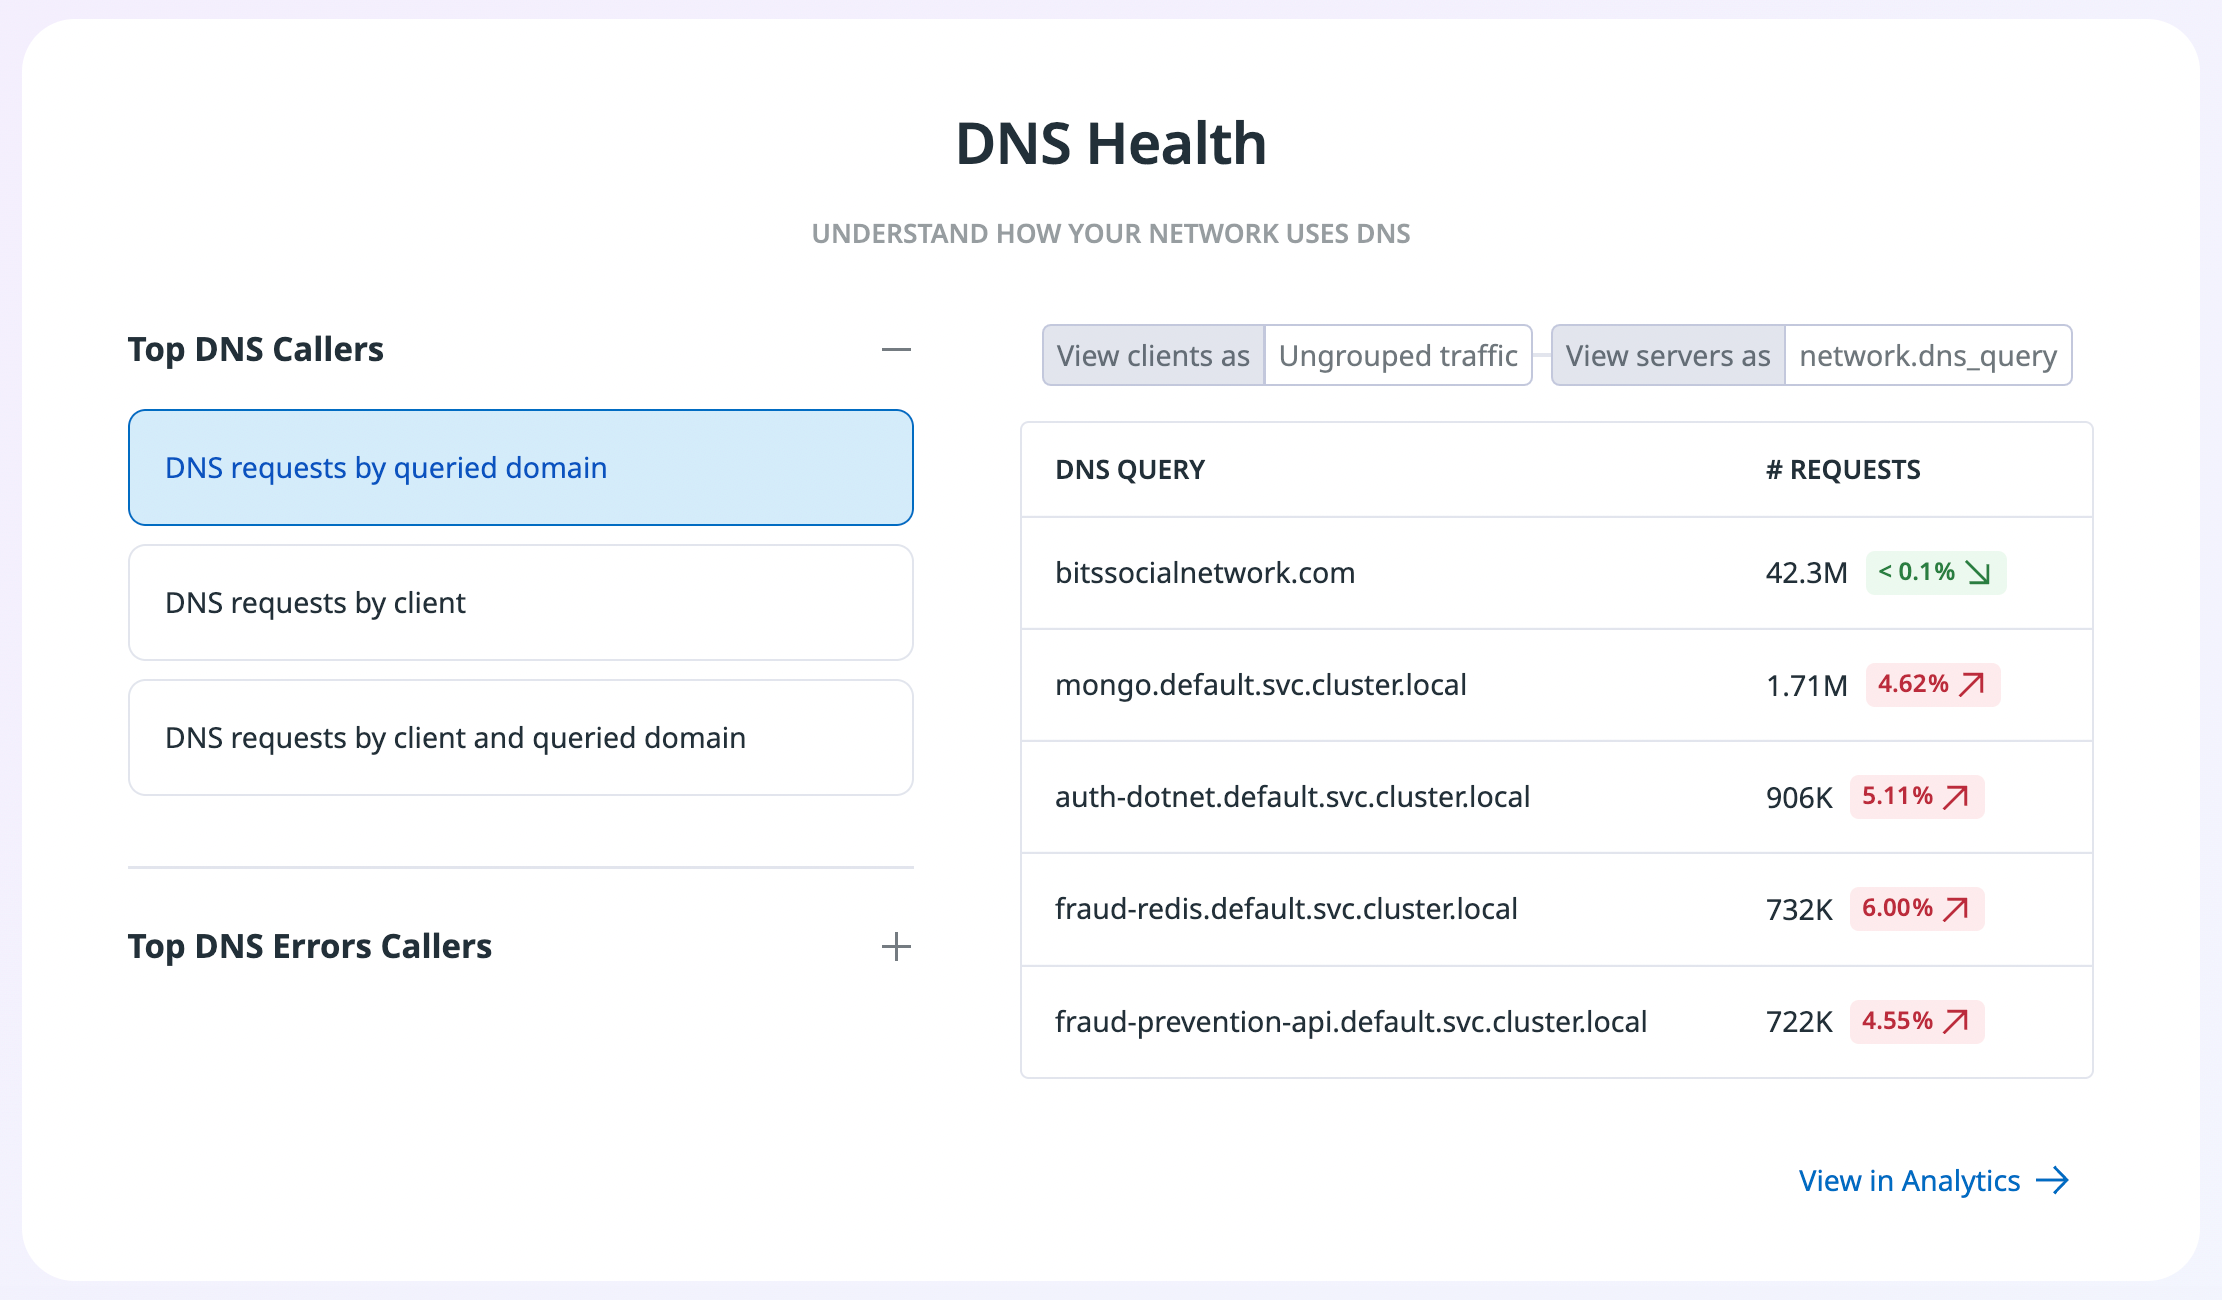
The DNS Health section provides a high-level overview of the top DNS callers by queried domain, client, or both. See the most queried domains, the top clients making DNS queries, or a combination of the two, and check the change icons to see if there have been any unexpected changes in the selected time frame.
You can also view the top callers for common DNS errors, such as NXDOMAIN, timeouts, and SERVFAIL. Find the top client-to-DNS query combinations resulting in any given error type, and see how that error rate has changed over the selected time frame. This helps to identify unusual DNS errors that may need investigation, especially while troubleshooting an incident.
Identify top traffic sources
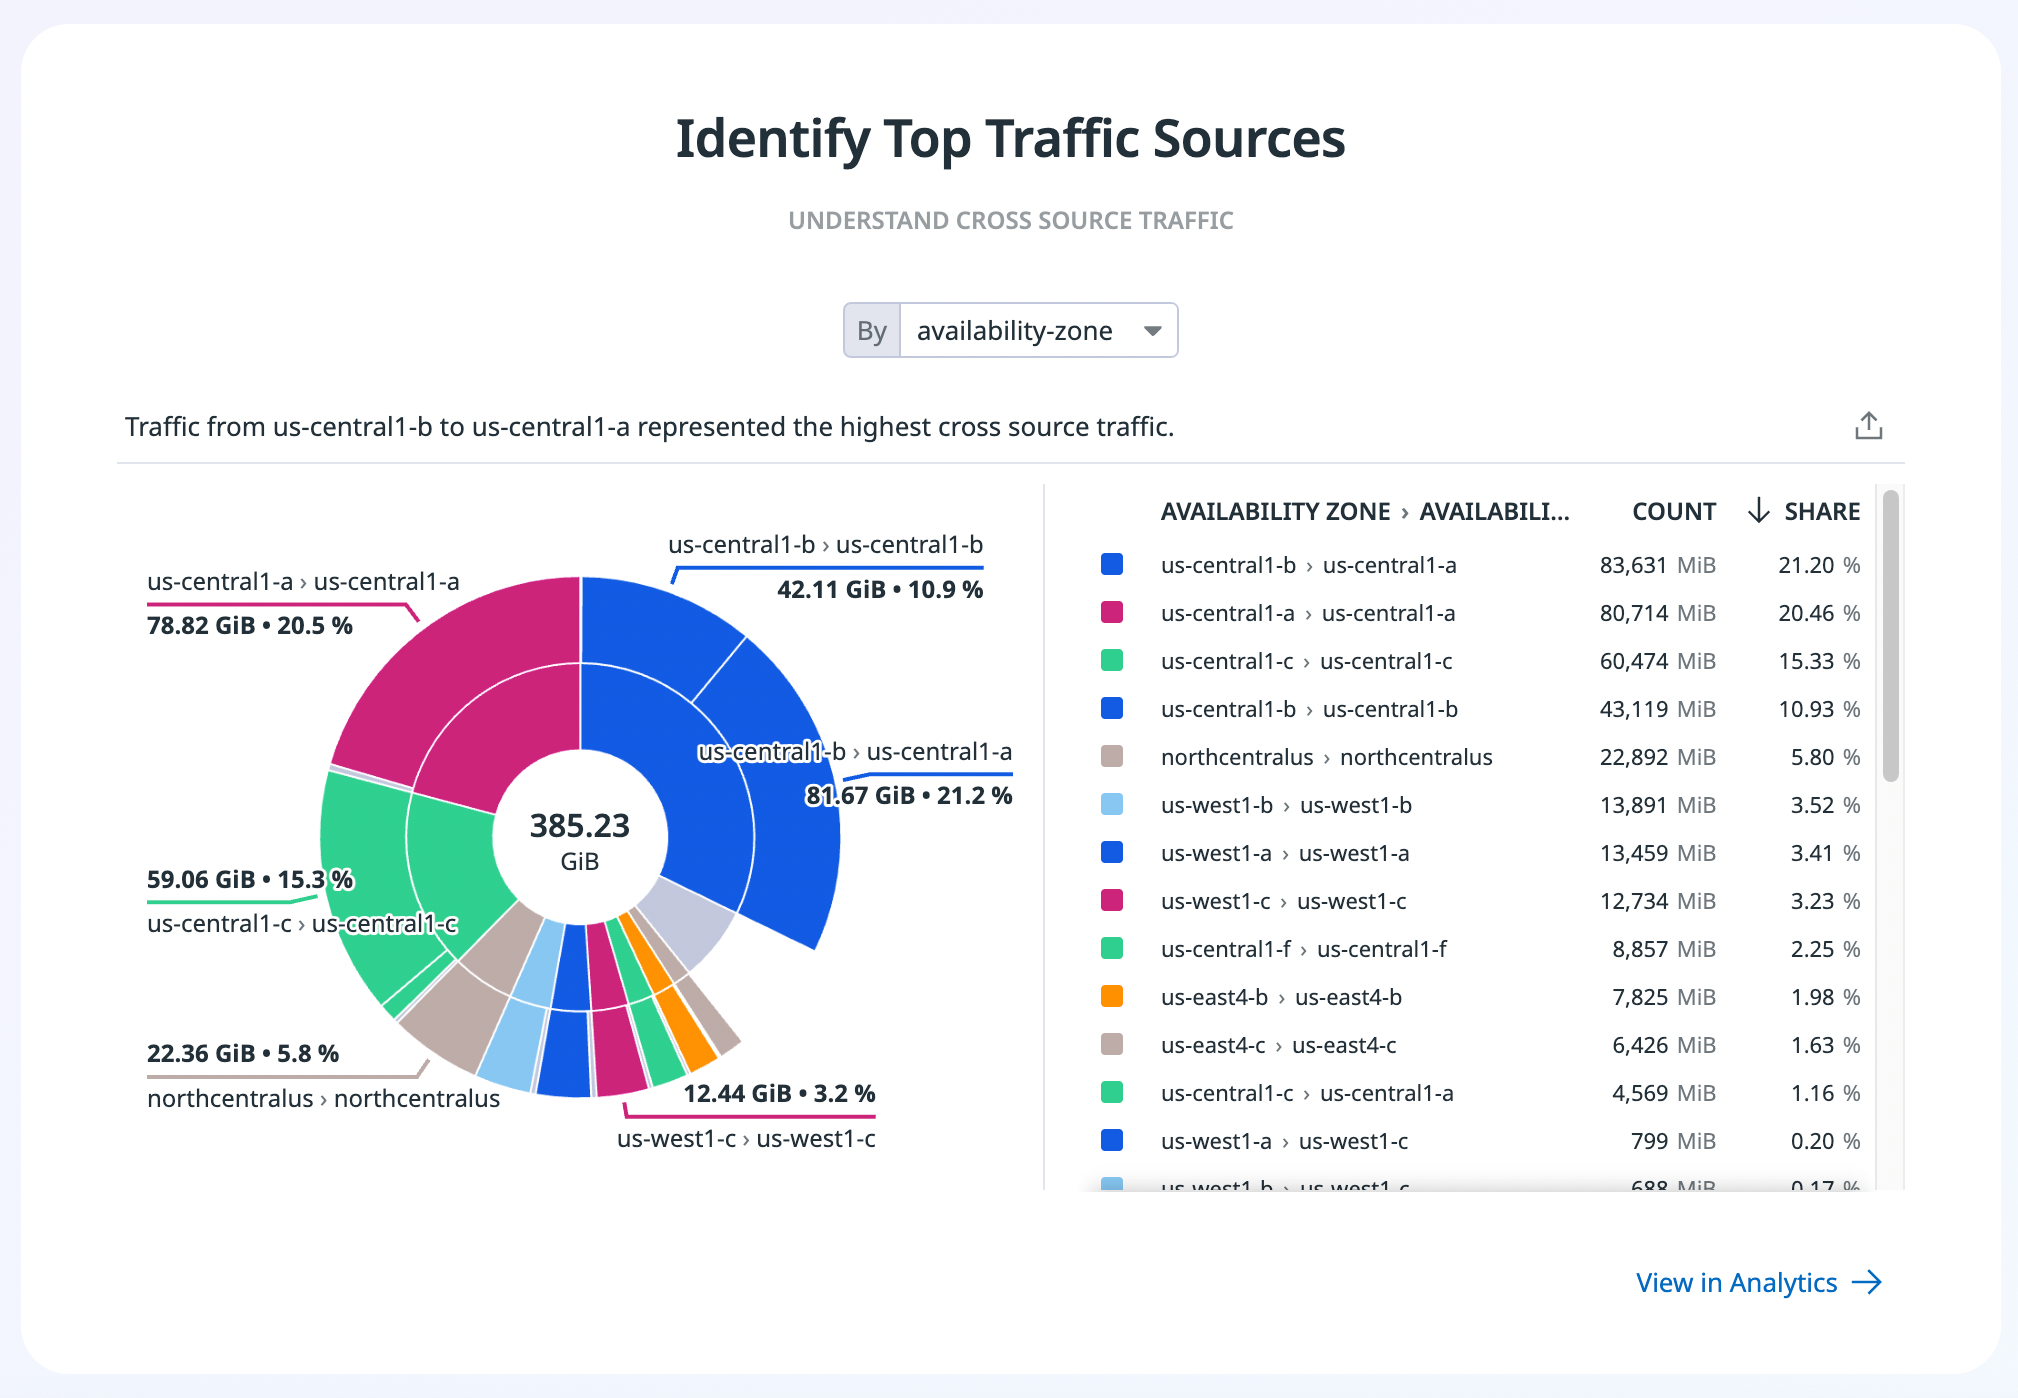
The Identify Top Traffic Sources section shows traffic across different sources such as availability zone, team, cloud provider, or region, depending on how you tag your data. Seeing the top availability zone (AZ) traffic, for example, can help start an investigation into cloud cost reduction, as cross-AZ traffic is a common expense. Continue investigating by clicking the View in Analytics button to discover which services make up most of the cross-AZ traffic. You can use this section for similar exploration of top cross-team, cross-cloud provider, or cross-region traffic.
Further Reading
Más enlaces, artículos y documentación útiles:


