- Essentials
- Getting Started
- Datadog
- Datadog Site
- DevSecOps
- Serverless for AWS Lambda
- Agent
- Integrations
- Containers
- Dashboards
- Monitors
- Logs
- APM Tracing
- Profiler
- Tags
- API
- Service Catalog
- Session Replay
- Continuous Testing
- Synthetic Monitoring
- Incident Management
- Database Monitoring
- Cloud Security Management
- Cloud SIEM
- Application Security Management
- Workflow Automation
- CI Visibility
- Test Visibility
- Test Impact Analysis
- Code Analysis
- Learning Center
- Support
- Glossary
- Standard Attributes
- Guides
- Agent
- Integrations
- OpenTelemetry
- Developers
- Authorization
- DogStatsD
- Custom Checks
- Integrations
- Create an Agent-based Integration
- Create an API Integration
- Create a Log Pipeline
- Integration Assets Reference
- Build a Marketplace Offering
- Create a Tile
- Create an Integration Dashboard
- Create a Recommended Monitor
- Create a Cloud SIEM Detection Rule
- OAuth for Integrations
- Install Agent Integration Developer Tool
- Service Checks
- IDE Plugins
- Community
- Guides
- Administrator's Guide
- API
- Datadog Mobile App
- CoScreen
- Cloudcraft
- In The App
- Dashboards
- Notebooks
- DDSQL Editor
- Sheets
- Monitors and Alerting
- Infrastructure
- Metrics
- Watchdog
- Bits AI
- Service Catalog
- API Catalog
- Error Tracking
- Service Management
- Infrastructure
- Application Performance
- APM
- Continuous Profiler
- Database Monitoring
- Data Streams Monitoring
- Data Jobs Monitoring
- Digital Experience
- Real User Monitoring
- Product Analytics
- Synthetic Testing and Monitoring
- Continuous Testing
- Software Delivery
- CI Visibility
- CD Visibility
- Test Optimization
- Code Analysis
- Quality Gates
- DORA Metrics
- Security
- Security Overview
- Cloud SIEM
- Cloud Security Management
- Application Security Management
- AI Observability
- Log Management
- Observability Pipelines
- Log Management
- Administration
Getting Started with AWS Lambda Serverless Monitoring
Overview
Serverless is a model where developers build and run applications and services using a cloud provider, rather than managing infrastructure themselves. Datadog Serverless Monitoring collects metrics, logs, and traces from your serverless infrastructure, enabling you to monitor your application’s health and performance.
This guide makes use of a serverless sample app that you can launch with one click. This app has Serverless Monitoring preconfigured. Follow this guide to see how you might troubleshoot a problem in your sample app, and what kinds of visibility Serverless Monitoring can provide.
Install the sample app
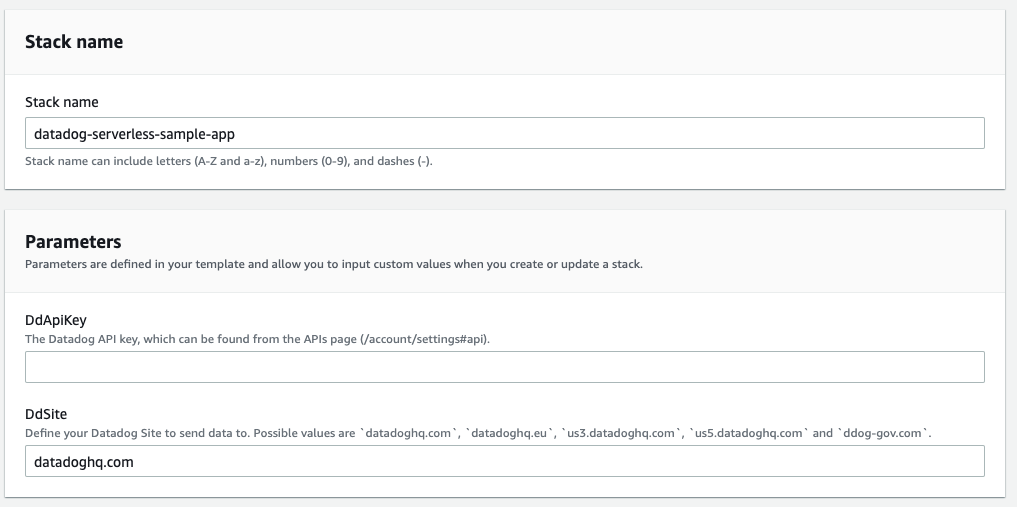
- Launch the CloudFormation Stack. This link brings you to a Create stack page in CloudFormation.
- Enter your Datadog API key and Datadog site (
).
Then, acknowledge IAM capabilities and click Create Stack.
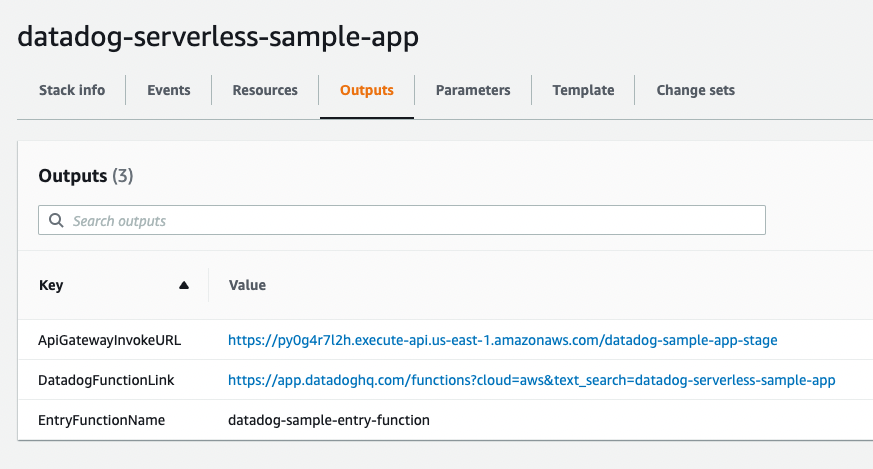
- After the stack has been created, open the Outputs tab.
Invoke your sample app a few times by visiting the ApiGatewayInvokeURL. This returns a “Sent message to SNS” success message.
Each invocation executes the following:
import boto3, os

def handler(event, context):
    sns = boto3.client('sns')

    sns.publish(
        TopicArn=os.environ.get("SNS_TOPIC_ARN"),
        Message='Message sent to SNS'
        )

    return {
        "body": "Sent message to SNS",
        "statusCode": 200
    }
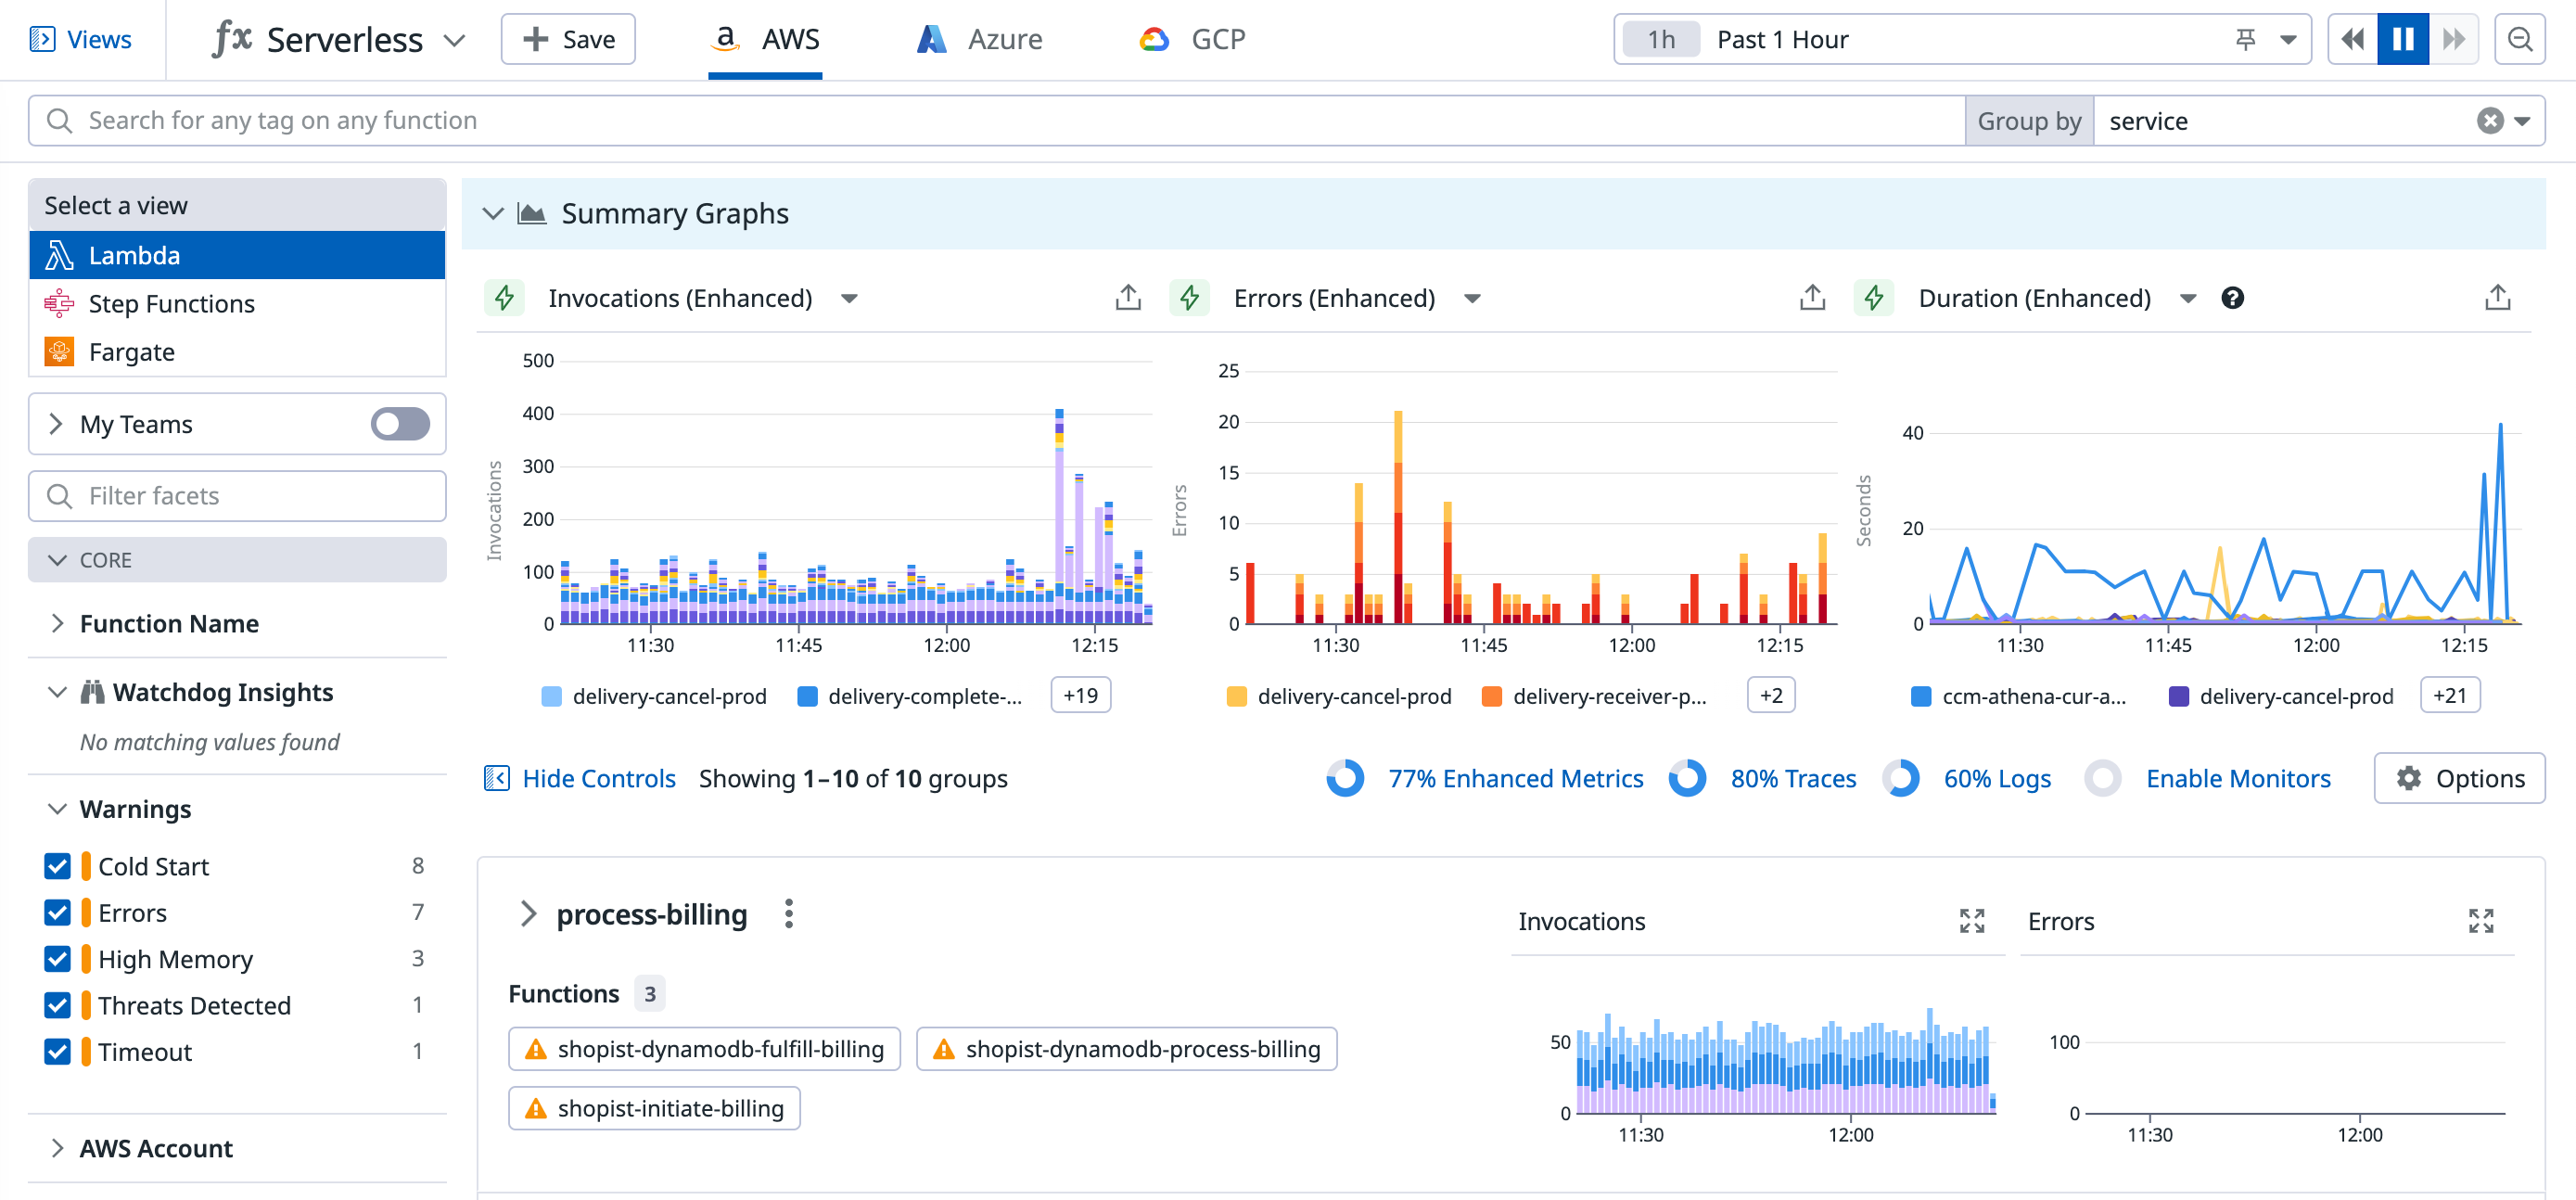
You can see your sample app functions in Serverless View.
Serverless View
The Serverless View displays telemetry from all serverless resources in your AWS environment. You can use this page as a starting point for monitoring, debugging, and optimizing your applications.
If you have invoked your sample app at least once, you will see datadog-sample-entry-function and datadog-sample-sqs-consumer-function:
Serverless Insights
In Serverless View, the rightmost column is titled Insights. Datadog automatically highlights potential issues in your serverless applications, such as high errors and high duration; these issues appear in the Insights column.
For your serverless sample application, Datadog has likely detected a cold start. Cold starts occur when your serverless application receives a sudden increase in traffic. This can happen if the function was previously receiving a relatively constant number of requests and abruptly started receiving more—or, as in this case, when the function was previously inactive and has been invoked for the first time.
Create an error to investigate
You can intentionally cause an error by editing the datadog-sample-entry-function in the sample app stack.
  # Entry Lambda Function Code
  def handler(event, context):

    raise Exception('Throw an error.')
Deploy this change and invoke your sample app again to see how you can investigate this error in Datadog.
Notice that datadog-sample-entry-function has five errors.
Function details
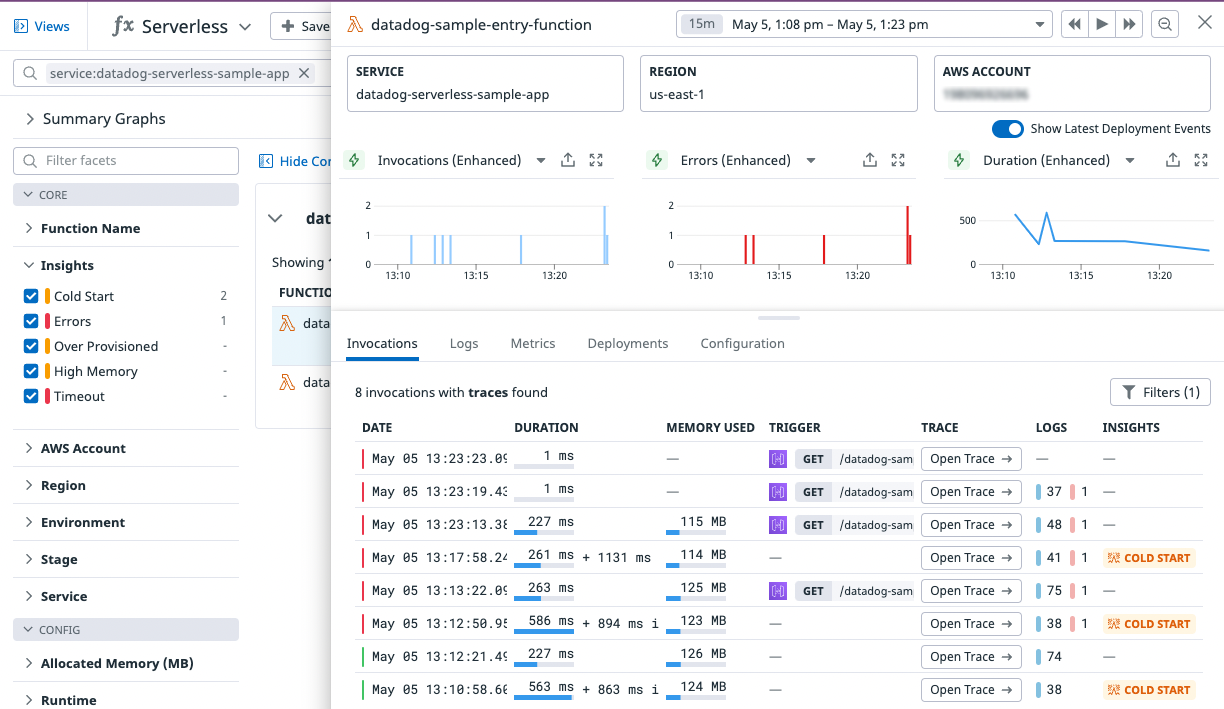
Click on your function to see more details regarding invocations and recent deployments.
The detailed view, as shown above, contains three graphs. You can set these to display any available metric; by default, they show three enhanced Lambda metrics: invocations, errors, and duration.
Datadog generates enhanced Lambda metrics out-of-the-box with low latency, several second granularity, and detailed metadata for cold starts and custom tags. You can also view the default enhanced Lambda metrics dashboard.
Invocations
The Invocations tab displays your function’s latest invocations.
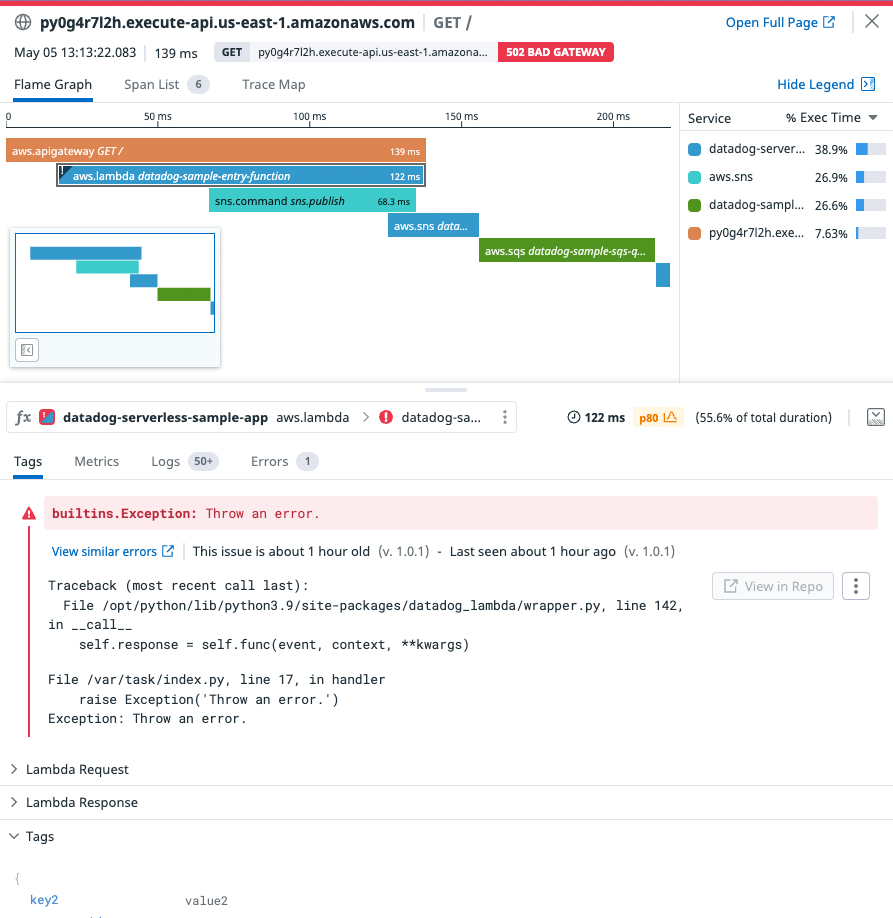
Each invocation is associated with a trace. Click on Open Trace to see the trace for each invocation:
The Flame Graph tab shows exactly what happened during the duration of this invocation, including which services had the highest percentage of the total execution time. The flame graph displays the request as it travels from APIGateway, through your datadog-sample-entry-function, through SNS, SQS, and finally your datadog-sample-sqs-function.
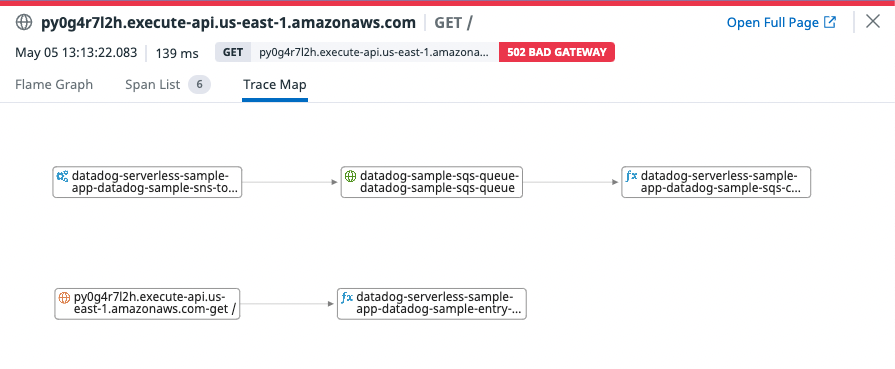
The Trace Map tab visualizes the flow of your services and how they connect to each other.
The lower half of the detailed trace view displays a stack trace, which reveals the line of code responsible for throwing the error:
Traceback (most recent call last):
  File /opt/python/lib/python3.9/site-packages/datadog_lambda/wrapper.py, line 142, in __call__
    self.response = self.func(event, context, **kwargs)
File /var/task/index.py, line 17, in handler
    raise Exception('Throw an error.')
Exception: Throw an error.
Underneath, you can also examine your Lambda request and response payloads. Datadog collects event payloads for every Lambda invocation.
Logs
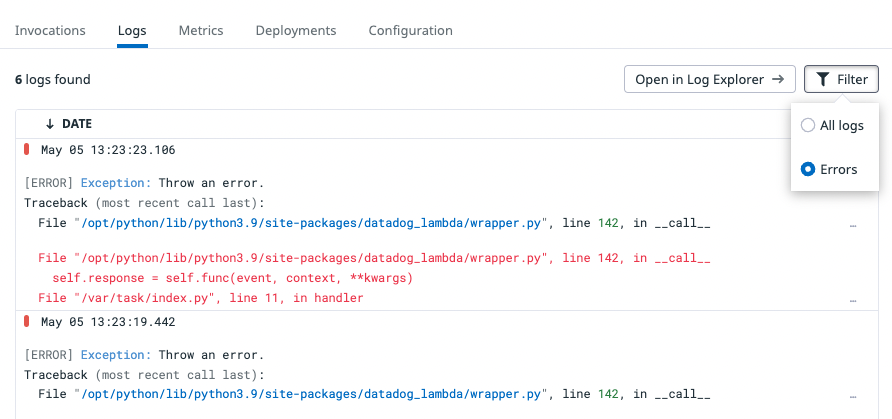
The serverless sample app has logs enabled by default. You can see each function’s logs under its Logs tab.
You can filter these logs to only see errors, or view them in the Log Explorer.
