- Essentials
- Getting Started
- Datadog
- Datadog Site
- DevSecOps
- Serverless for AWS Lambda
- Agent
- Integrations
- Containers
- Dashboards
- Monitors
- Logs
- APM Tracing
- Profiler
- Tags
- API
- Service Catalog
- Session Replay
- Continuous Testing
- Synthetic Monitoring
- Incident Management
- Database Monitoring
- Cloud Security Management
- Cloud SIEM
- Application Security Management
- Workflow Automation
- CI Visibility
- Test Visibility
- Test Impact Analysis
- Code Analysis
- Learning Center
- Support
- Glossary
- Standard Attributes
- Guides
- Agent
- Integrations
- OpenTelemetry
- Developers
- Authorization
- DogStatsD
- Custom Checks
- Integrations
- Create an Agent-based Integration
- Create an API Integration
- Create a Log Pipeline
- Integration Assets Reference
- Build a Marketplace Offering
- Create a Tile
- Create an Integration Dashboard
- Create a Recommended Monitor
- Create a Cloud SIEM Detection Rule
- OAuth for Integrations
- Install Agent Integration Developer Tool
- Service Checks
- IDE Plugins
- Community
- Guides
- Administrator's Guide
- API
- Datadog Mobile App
- CoScreen
- Cloudcraft
- In The App
- Dashboards
- Notebooks
- DDSQL Editor
- Sheets
- Monitors and Alerting
- Infrastructure
- Metrics
- Watchdog
- Bits AI
- Service Catalog
- API Catalog
- Error Tracking
- Service Management
- Infrastructure
- Application Performance
- APM
- Continuous Profiler
- Database Monitoring
- Data Streams Monitoring
- Data Jobs Monitoring
- Digital Experience
- Real User Monitoring
- Product Analytics
- Synthetic Testing and Monitoring
- Continuous Testing
- Software Delivery
- CI Visibility
- CD Visibility
- Test Optimization
- Code Analysis
- Quality Gates
- DORA Metrics
- Security
- Security Overview
- Cloud SIEM
- Cloud Security Management
- Application Security Management
- AI Observability
- Log Management
- Observability Pipelines
- Log Management
- Administration
Open Policy Agent
Supported OS
Integration version0.0.1
Overview
This check collects metrics from Open Policy Agent.
Setup
Follow the instructions below to install and configure this check for an Agent running on a Kubernetes cluster. See also the Autodiscovery Integration Templates for guidance on applying these instructions.
Installation
To install the open_policy_agent check on your Kubernetes cluster:
Install the developer toolkit.
Clone the
integrations-extrasrepository:git clone https://github.com/DataDog/integrations-extras.git.Update your
ddevconfig with theintegrations-extras/path:ddev config set extras ./integrations-extrasTo build the
open_policy_agentpackage, run:ddev -e release build open_policy_agentDownload the Agent manifest to install the Datadog Agent as a DaemonSet.
Create two
PersistentVolumeClaims, one for the checks code, and one for the configuration.Add them as volumes to your Agent pod template and use them for your checks and configuration:
     env:
       - name: DD_CONFD_PATH
         value: "/confd"
       - name: DD_ADDITIONAL_CHECKSD
         value: "/checksd"
   [...]
     volumeMounts:
       - name: agent-code-storage
         mountPath: /checksd
       - name: agent-conf-storage
         mountPath: /confd
   [...]
   volumes:
     - name: agent-code-storage
       persistentVolumeClaim:
         claimName: agent-code-claim
     - name: agent-conf-storage
       persistentVolumeClaim:
         claimName: agent-conf-claim
Deploy the Datadog Agent in your Kubernetes cluster:
kubectl apply -f agent.yamlCopy the integration artifact .whl file to your Kubernetes nodes or upload it to a public URL.
Run the following command to install the integrations wheel with the Agent:
kubectl exec ds/datadog -- agent integration install -w <PATH_OF_OPEN_POLICY_AGENT_ARTIFACT_>/<OPEN_POLICY_AGENT_ARTIFACT_NAME>.whlRun the following commands to copy the checks and configuration to the corresponding PVCs:
kubectl exec ds/datadog -- sh
# cp -R /opt/datadog-agent/embedded/lib/python2.7/site-packages/datadog_checks/* /checksd
# cp -R /etc/datadog-agent/conf.d/* /confd
Restart the Datadog Agent pods.
Logs-generated metrics
The default dashboard includes some graphs related to a metric around OPA decisions, called open_policy_agent.decisions. This metric is created based on the OPA “Decision Logs”. To generate this metric and populate this part of the dashboard, create a new log-generated metric in Datadog.
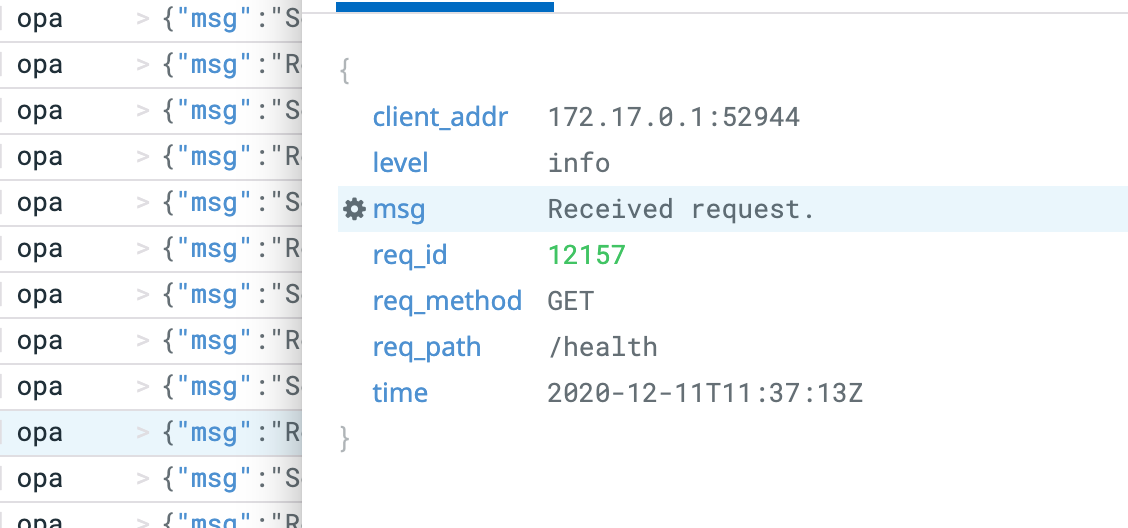
First, create a facet for the msg field of the OPA logs, as it only generates metrics for the “Decision Logs” type of log entry. For that, select any of the log entries coming from OPA, click on the engine log near the msg field and select “Create facet for @msg”:

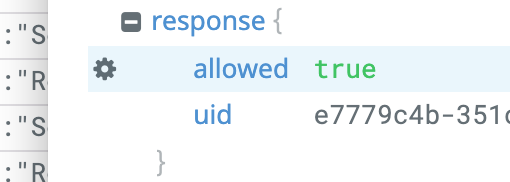
Create two facets, one for the input.request.kind.kind field and one for the result.response.allowed field, both available in any of the log entries type “Decision Log”.


Once you have created the facets, generate the needed metric for the Dashboard to be complete. Click on the menu “Logs -> Generate Metrics”. Click on “Add a new metric” and fill in the form with the following data:

Configuration
Edit the
open_policy_agent/conf.yamlfile, in the/confdfolder that you added to the Agent pod to start collecting your OPA performance data. See the sample open_policy_agent/conf.yaml for all available configuration options.
Validation
Run the Agent’s status subcommand and look for open_policy_agent under the Checks section.
Data Collected
Metrics
| open_policy_agent.request.duration.count (count) | The count of the HTTP request latencies in seconds for the OPA service Shown as second |
| open_policy_agent.request.duration.sum (count) | The sum of the HTTP request latencies in seconds for the OPA service Shown as second |
| open_policy_agent.policies (gauge) | The number of policies enabled in the OPA server |
Events
open_policy_agent does not include any events.
Service Checks
open_policy_agent.prometheus.health
Returns CRITICAL if the agent fails to connect to the Prometheus endpoint, otherwise OK.
Statuses: ok, critical
open_policy_agent.health
Returns CRITICAL if the agent fails to connect to the OPA health endpoint, OK if it returns 200, WARNING otherwise.
Statuses: ok, warning, critical
open_policy_agent.bundles_health
Returns CRITICAL if the agent fails to connect to the OPA bundles health endpoint, OK if it returns 200, WARNING otherwise.
Statuses: ok, warning, critical
open_policy_agent.plugins_health
Returns CRITICAL if the agent fails to connect to the OPA plugins health point, OK if it returns 200, WARNING otherwise.
Statuses: ok, warning, critical
Troubleshooting
Need help? Contact Datadog support.
