- Essentials
- Getting Started
- Datadog
- Datadog Site
- DevSecOps
- Serverless for AWS Lambda
- Agent
- Integrations
- Containers
- Dashboards
- Monitors
- Logs
- APM Tracing
- Profiler
- Tags
- API
- Service Catalog
- Session Replay
- Continuous Testing
- Synthetic Monitoring
- Incident Management
- Database Monitoring
- Cloud Security Management
- Cloud SIEM
- Application Security Management
- Workflow Automation
- CI Visibility
- Test Visibility
- Test Impact Analysis
- Code Analysis
- Learning Center
- Support
- Glossary
- Standard Attributes
- Guides
- Agent
- Integrations
- OpenTelemetry
- Developers
- Authorization
- DogStatsD
- Custom Checks
- Integrations
- Create an Agent-based Integration
- Create an API Integration
- Create a Log Pipeline
- Integration Assets Reference
- Build a Marketplace Offering
- Create a Tile
- Create an Integration Dashboard
- Create a Recommended Monitor
- Create a Cloud SIEM Detection Rule
- OAuth for Integrations
- Install Agent Integration Developer Tool
- Service Checks
- IDE Plugins
- Community
- Guides
- Administrator's Guide
- API
- Datadog Mobile App
- CoScreen
- Cloudcraft
- In The App
- Dashboards
- Notebooks
- DDSQL Editor
- Sheets
- Monitors and Alerting
- Infrastructure
- Metrics
- Watchdog
- Bits AI
- Service Catalog
- API Catalog
- Error Tracking
- Service Management
- Infrastructure
- Application Performance
- APM
- Continuous Profiler
- Database Monitoring
- Data Streams Monitoring
- Data Jobs Monitoring
- Digital Experience
- Real User Monitoring
- Product Analytics
- Synthetic Testing and Monitoring
- Continuous Testing
- Software Delivery
- CI Visibility
- CD Visibility
- Test Optimization
- Code Analysis
- Quality Gates
- DORA Metrics
- Security
- Security Overview
- Cloud SIEM
- Cloud Security Management
- Application Security Management
- AI Observability
- Log Management
- Observability Pipelines
- Log Management
- Administration
Generate Metrics from Ingested Logs
Overview
Datadog’s Logging without Limits* lets you dynamically decide what to include or exclude from your indexes for storage and query, at the same time many types of logs are meant to be used for telemetry to track trends, such as KPIs, over long periods of time. Log-based metrics are a cost-efficient way to summarize log data from the entire ingest stream. This means that even if you use exclusion filters to limit what you store for exploration, you can still visualize trends and anomalies over all of your log data at 10s granularity for 15 months.
With log-based metrics, you can generate a count metric of logs that match a query or a distribution metric of a numeric value contained in the logs, such as request duration.
Billing Note: Metrics created from ingested logs are billed as Custom Metrics.
Generate a log-based metric
To generate a new log-based metric:
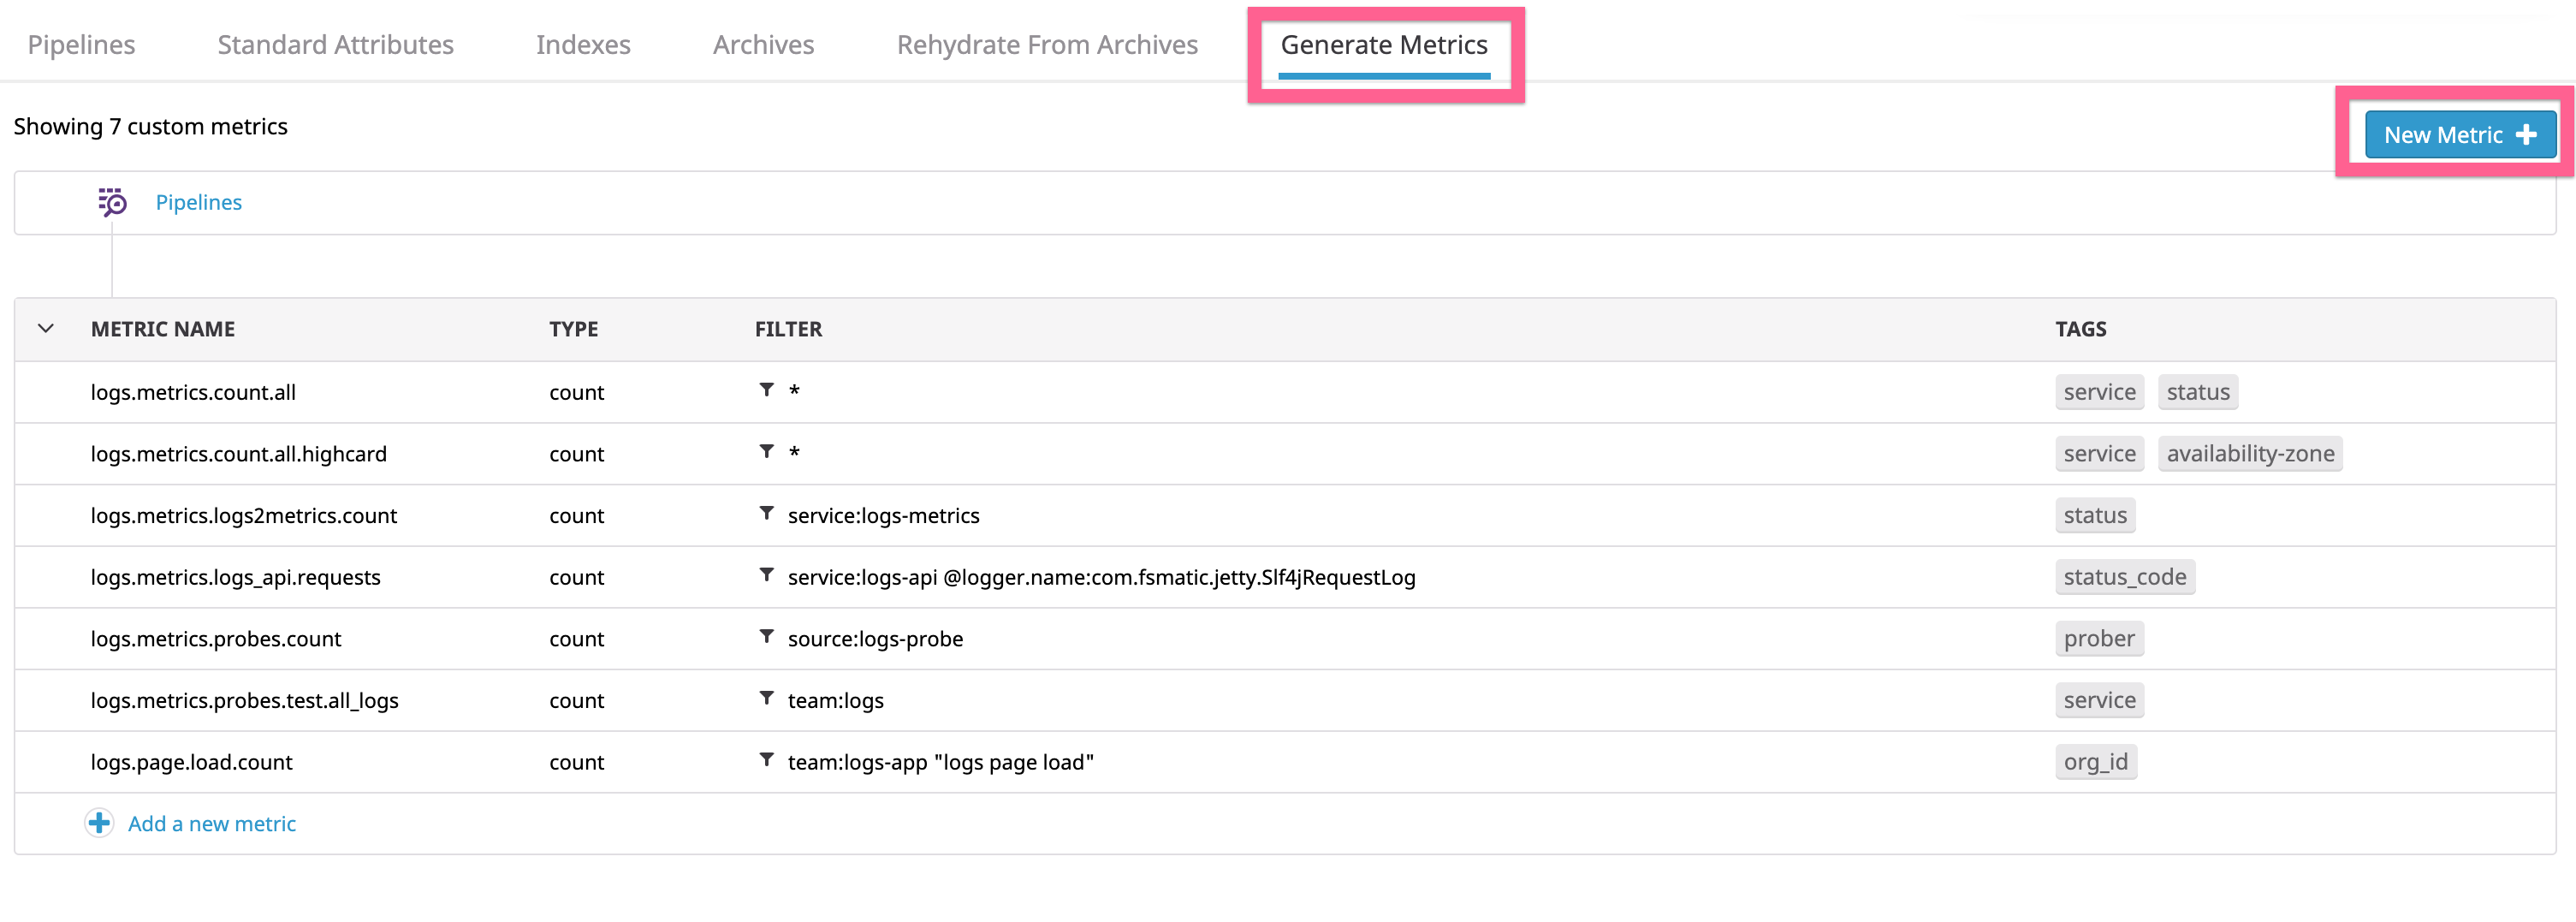
- Navigate to the Generate Metrics page.
- Select the Generate Metrics tab.
- Click +New Metric.
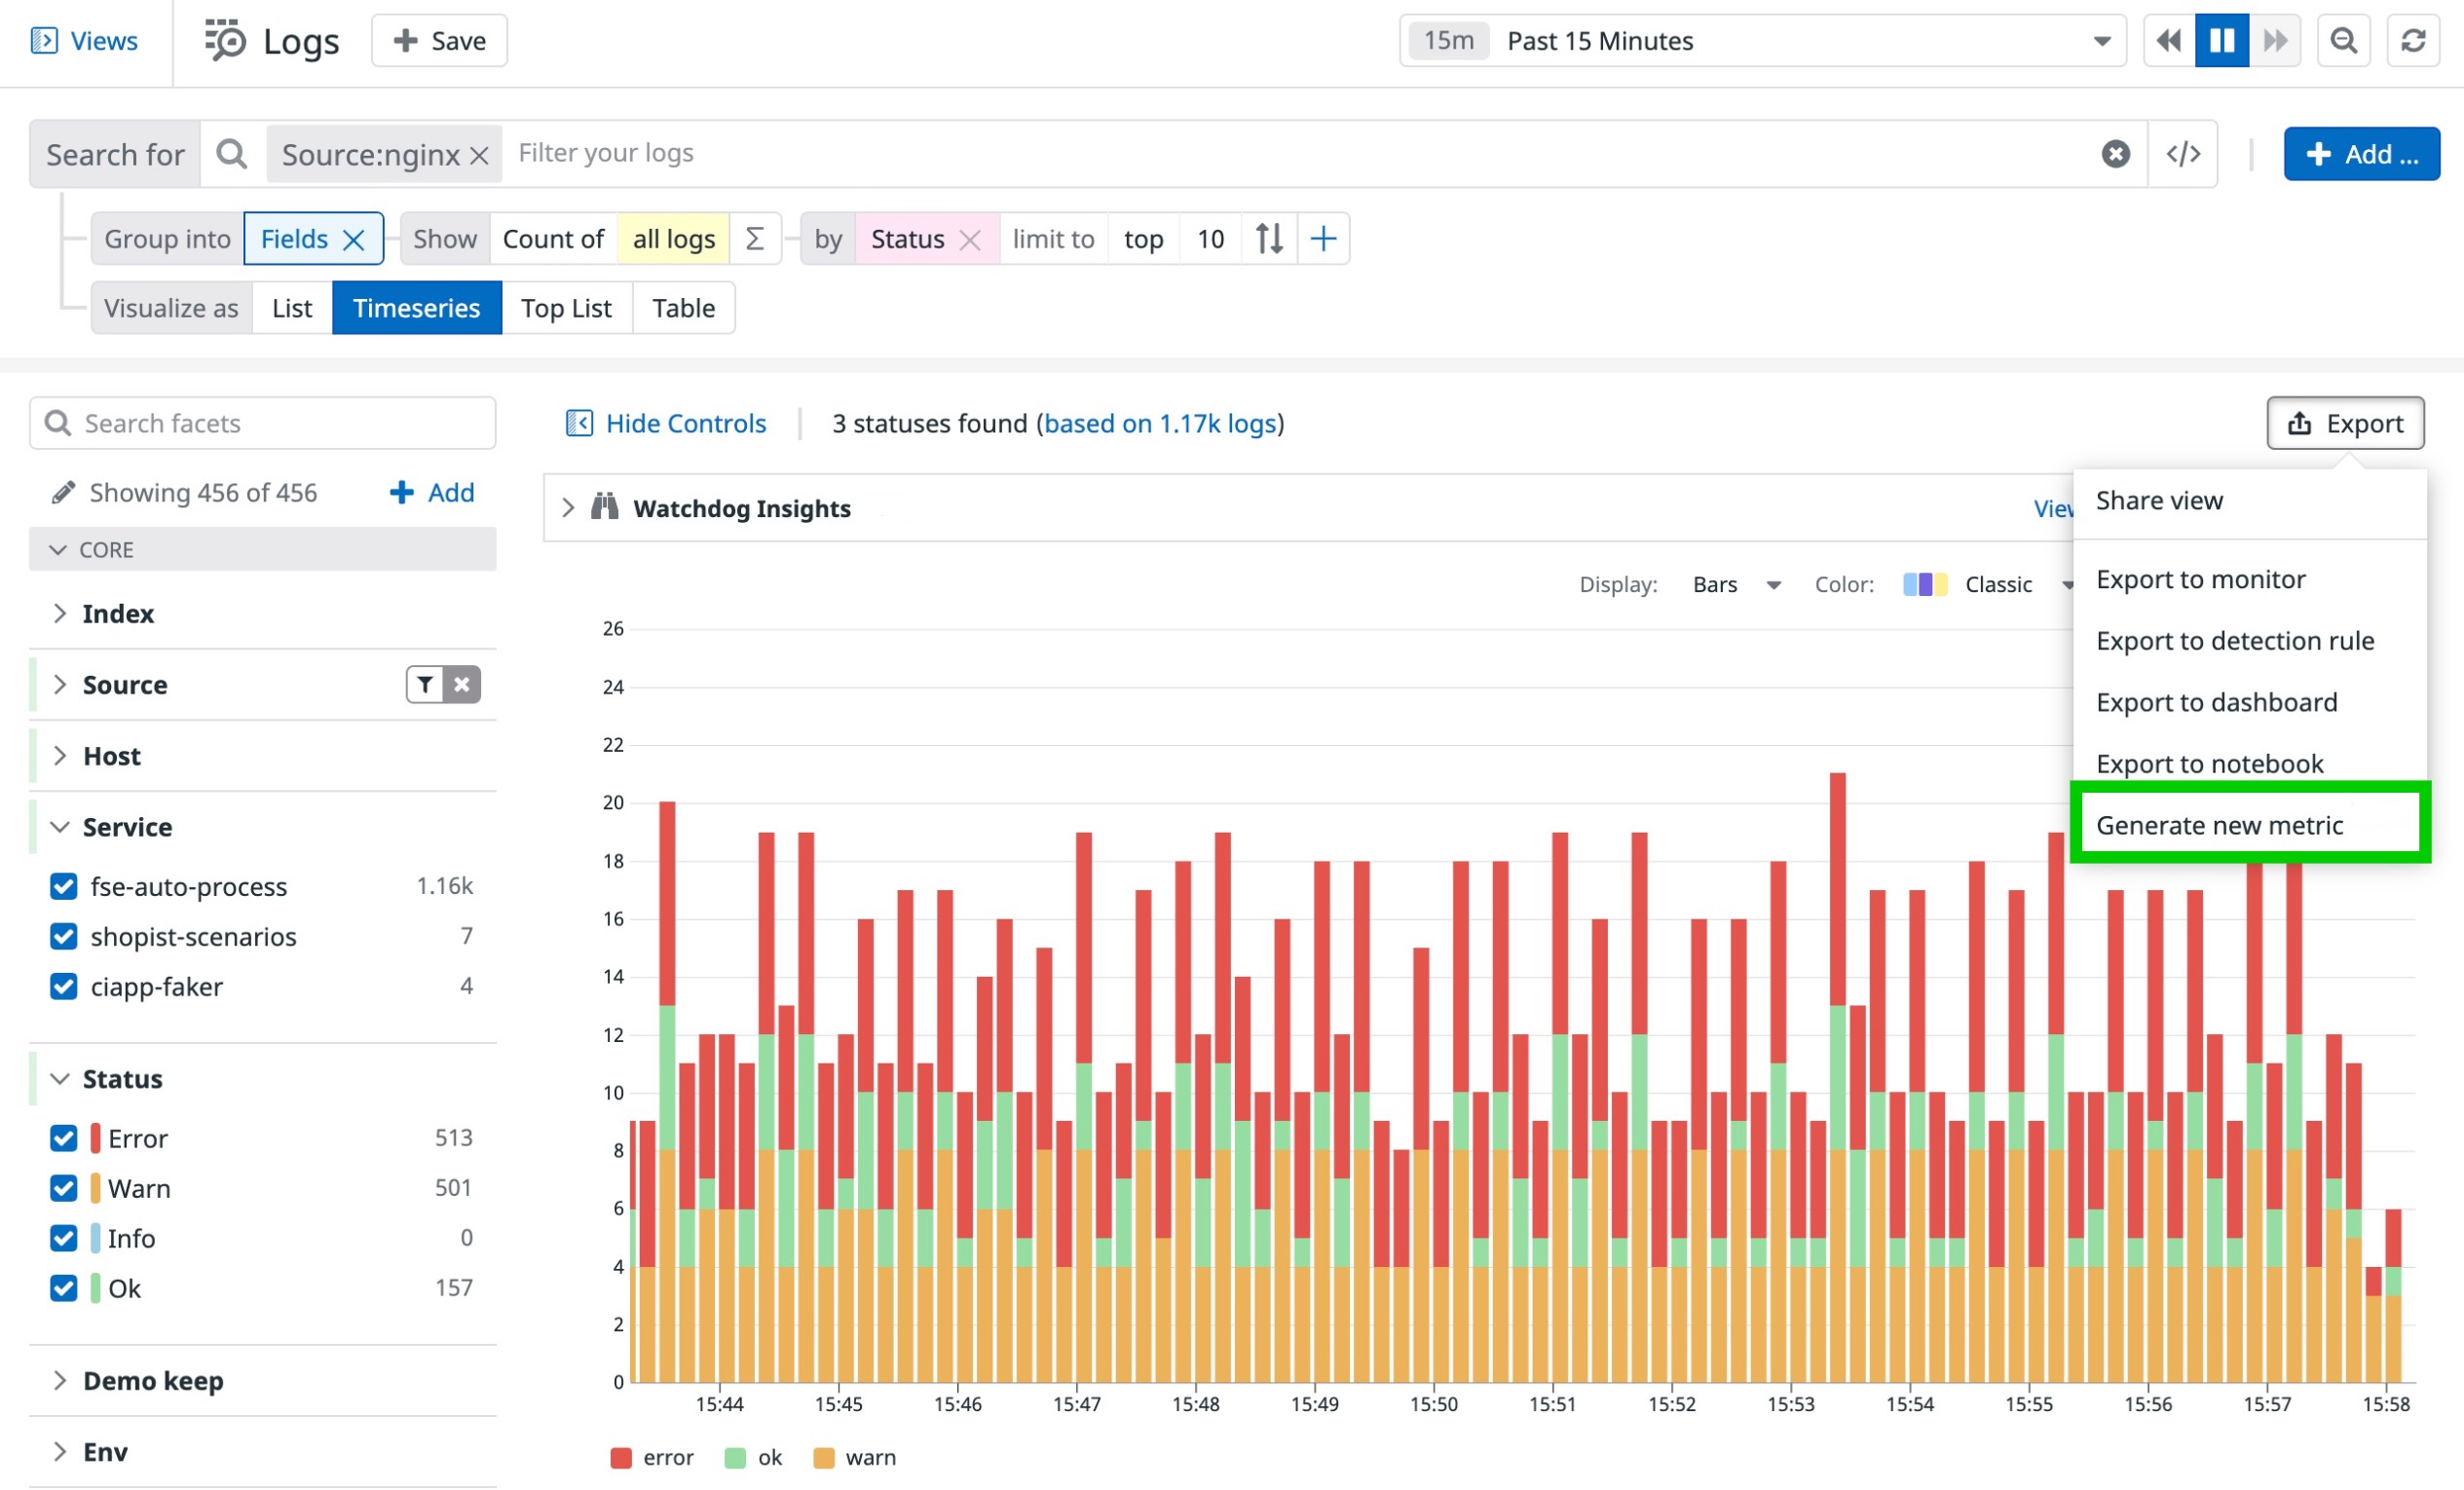
You can also create metrics from an Analytics search by selecting the “Generate new metric” option from the Export menu.
Add a new log-based metric
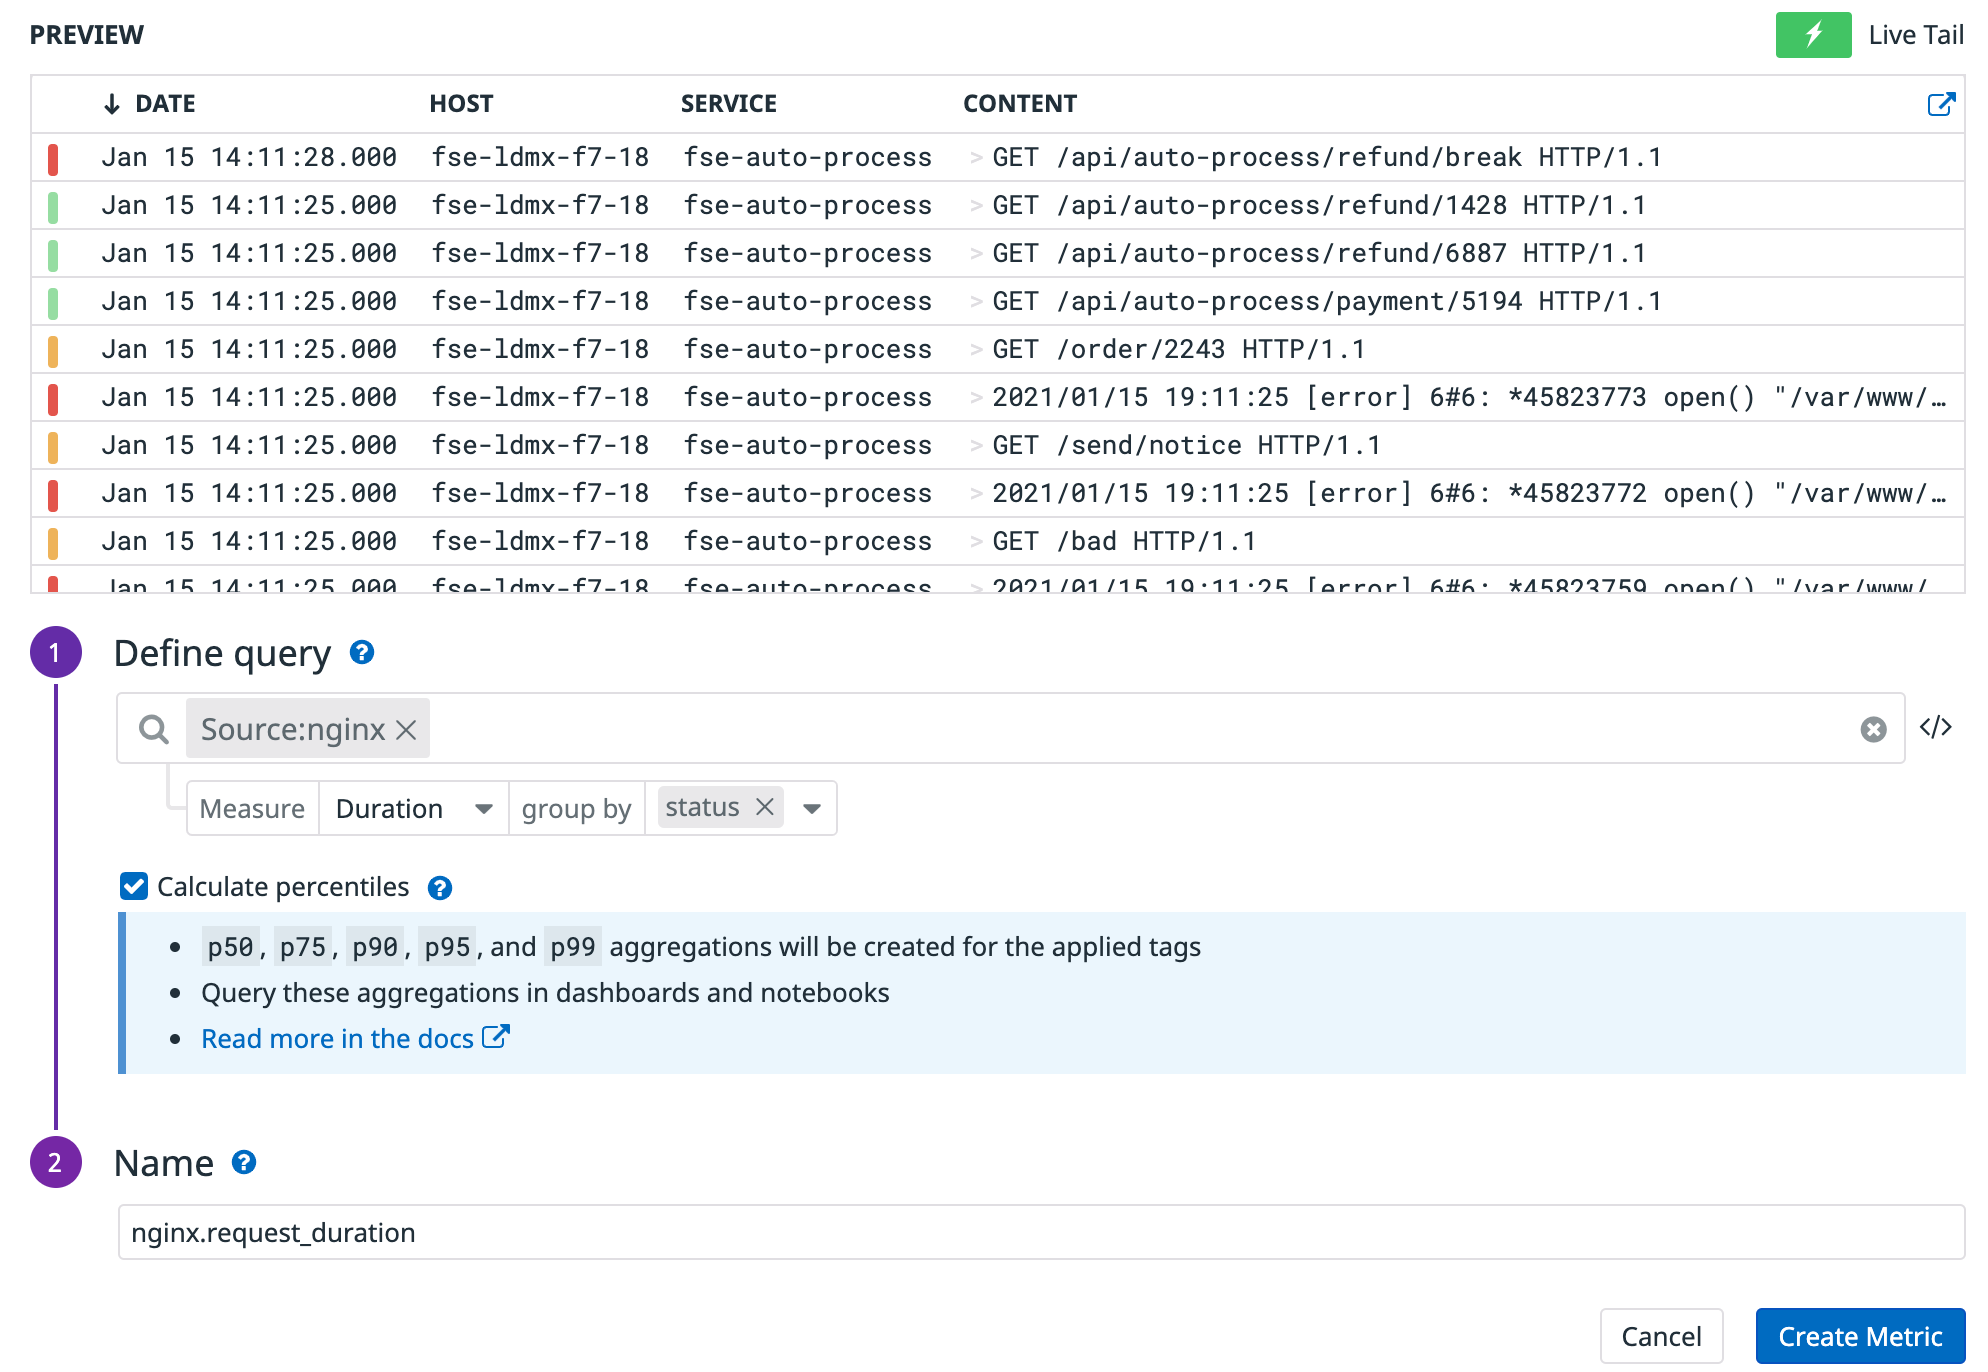
- Input a query to filter the log stream: The query syntax is the same as for the Log Explorer Search. Only logs ingested with a timestamp within the past 20 minutes are considered for aggregation.
- Select the field you would like to track: Select
*to generate a count of all logs matching your query or enter a log attribute (for example,@network.bytes_written) to aggregate a numeric value and create its correspondingcount,min,max,sum, andavgaggregated metrics. If the log attribute facet is a measure, the value of the metric is the value of the log attribute. - Add dimensions to
group by: By default, metrics generated from logs do not have any tags unless explicitly added. Any attribute or tag dimension that exists in your logs (for example,@network.bytes_written,env) can be used to create metric tags. Metric tags names are equal to the originating attribute or tag name, without the @. - Add percentile aggregations: For distribution metrics, you can optionally generate p50, p75, p90, p95, and p99 percentiles. Percentile metrics are also considered custom metrics, and billed accordingly.
- Name your metric: Log-based metric names must follow the custom metric naming convention.
Note: Data points for log-based metrics are generated at 10-second intervals. When you create a dashboard graph for log-based metrics, the count unique parameter is based on the values within the 10-second interval.
Log-based metrics are considered custom metrics and billed accordingly. Avoid grouping by unbounded or extremely high cardinality attributes like timestamps, user IDs, request IDs, or session IDs to avoid impacting your billing.
Update a log-based metric
After a metric is created, the following fields can be updated:
- Stream filter query: To change the set of matching logs to be aggregated into metrics
- Aggregation groups: To update the tags or manage the cardinality of the generated metrics
- Percentile selection: Check or uncheck the Calculate percentiles box to remove or generate percentile metrics
To change the metric type or name, a new metric must be created.
Logs usage metrics
Usage metrics are estimates of your current Datadog usage in near real-time. They enable you to:
- Graph your estimated usage.
- Create monitors around your estimated usage.
- Get instant alerts about spikes or drops in your usage.
- Assess the potential impact of code changes on your usage in near real-time.
Log Management usage metrics come with three tags that can be used for more granular monitoring:
| Tag | Description |
|---|---|
datadog_index | Indicates the routing query that matches a log to an intended index. |
datadog_is_excluded | Indicates whether or not a log matches an exclusion query. |
service | The service attribute of the log event. |
An extra status tag is available on the datadog.estimated_usage.logs.ingested_events metric to reflect the log status (info, warning, etc.).
Further Reading
Additional helpful documentation, links, and articles:
*Logging without Limits is a trademark of Datadog, Inc.


