Overview
Rigor provides synthetic monitoring and optimization insights throughout your development lifecycle.
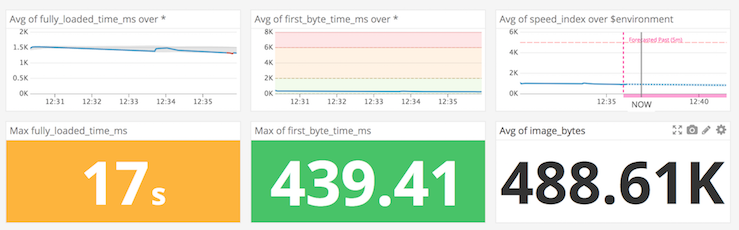
With Rigor, you can collect synthetic, front-end performance metrics and push those metrics into Datadog. You can also push alerts into Datadog as events.
Setup
Rigor has two different integrations with Datadog, a metrics integration and an events integration.
Configuration
Metrics collection
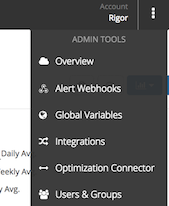
As an administrator, click the “Admin Tools” menu in the upper right hand of your screen and select “Integrations”.
Add a new integration, by clicking the “New” button to enable configuration of the integration.
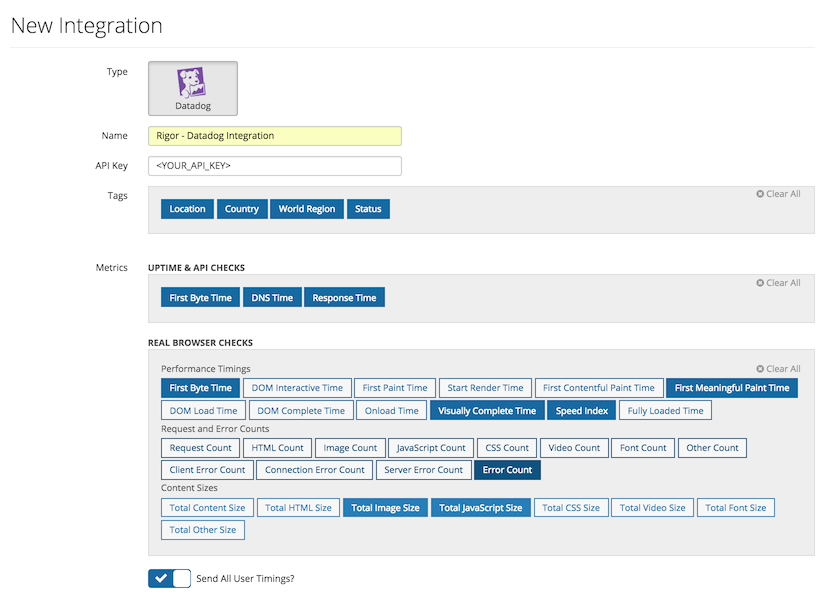
Add a unique name for this integration and your API key from Datadog. Then choose which tags and metrics you want to send. Some things to remember:
- A normalized version of the check name is included as a default tag.
- For multi-step checks (Real Browser and API Checks), the position of the request that the metrics came from is included.
- Uptime checks include HTTP, Port, and API checks
- Port checks only report the “Response Time” metric
- Not all browsers support all metrics
If you would like Real Browser Checks to report timings from the User Timings API, make sure “Send All User Timings?” is selected. Any marks are reported under the rigor.real_browser.marks namespace and measures are reported under the rigor.real_browser.measures namespace. Note: Selecting this option could send a lot of new series into Datadog, especially if the marks and measures on the site you are testing are dynamically generated.
Once you have configured the integration. You can add to any Real Browser, HTTP, Port, or API check. Just edit the check and go to the “Notifications” tab. Here you can add the integration that you just created.

Events collection
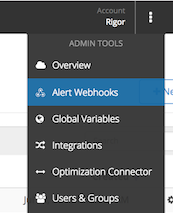
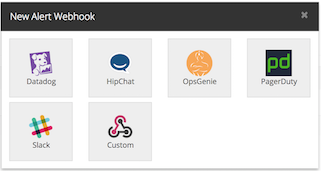
As an administrator, click the “Admin Tools” menu in the upper right hand of your screen and select “Alert Webhooks”.
Add a new integration, by clicking the “New” button and clicking the Datadog tile.
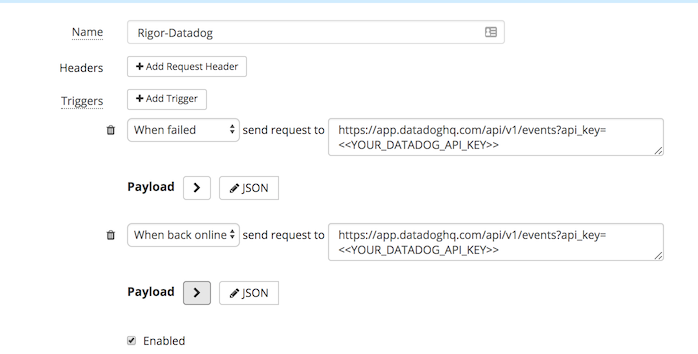
Add a unique name for this webhook and make sure to update the triggers with your Datadog API key.
Once you have configured the integration. You can add to any Real Browser, HTTP, Port, or API check. Just edit the check and go to the “Notifications” tab. Here you can add the webhook that you just created.

Data Collected
Metrics
| |
|---|
rigor.http.dns_time
(gauge) | Time from the start of the request until the DNS has been fully resolved.
Shown as millisecond |
rigor.http.first_byte_time
(gauge) | Time from the start of the request until the first byte of the response has been received.
Shown as millisecond |
rigor.http.response_time
(gauge) | Time from the start of the request until all of the bytes of the response have been received.
Shown as millisecond |
rigor.port.response_time
(gauge) | Time from the start of the request until all of the bytes of the response have been received.
Shown as millisecond |
rigor.api.dns_time
(gauge) | Time from the start of the request until the DNS has been fully resolved.
Shown as millisecond |
rigor.api.first_byte_time
(gauge) | Time from the start of the request until the first byte of the response has been received.
Shown as millisecond |
rigor.api.response_time
(gauge) | Time from the start of the request until all of the bytes of the response have been received.
Shown as millisecond |
rigor.real_browser.first_byte_time_ms
(gauge) | Time from the start of the first request until receiving the first byte of the first non-redirect request. 3xx redirects will increase this time.
Shown as millisecond |
rigor.real_browser.dom_interactive_time_ms
(gauge) | Time until the DOM is fully loaded and processed.
Shown as millisecond |
rigor.real_browser.first_paint_time_ms
(gauge) | Time until the browser renders anything other than the default background.
Shown as millisecond |
rigor.real_browser.start_render_ms
(gauge) | Time until the first pixel of content is drawn.
Shown as millisecond |
rigor.real_browser.first_contentful_paint_time_ms
(gauge) | Time until the browser first renders any content.
Shown as millisecond |
rigor.real_browser.first_meaningful_paint_time_ms
(gauge) | Time until the biggest above-the-fold layout change has happened
Shown as millisecond |
rigor.real_browser.dom_load_time_ms
(gauge) | Time until the document has loaded
Shown as millisecond |
rigor.real_browser.dom_complete_time_ms
(gauge) | Time until the page and all of its subresources are ready.
Shown as millisecond |
rigor.real_browser.onload_time_ms
(gauge) | Time until the page has loaded. This corresponds to the browser load event.
Shown as millisecond |
rigor.real_browser.visually_complete_ms
(gauge) | Time until all above-the-fold content has finished rendering.
Shown as millisecond |
rigor.real_browser.speed_index
(gauge) | A calculated metric that represents how quickly the page renders above-the-fold content.
Shown as millisecond |
rigor.real_browser.fully_loaded_time_ms
(gauge) | Time until there is 1.5 seconds of network inactivity after onload
Shown as millisecond |
rigor.real_browser.requests
(gauge) | Number of requests made.
Shown as item |
rigor.real_browser.content_bytes
(gauge) | Total size (bytes) of all content loaded.
Shown as byte |
rigor.real_browser.html_files
(gauge) | Number of requests for HTML documents.
Shown as item |
rigor.real_browser.html_bytes
(gauge) | Total size (bytes) of all HTML content loaded.
Shown as byte |
rigor.real_browser.image_files
(gauge) | Number of requests for images.
Shown as item |
rigor.real_browser.image_bytes
(gauge) | Total size (bytes) of all images loaded.
Shown as byte |
rigor.real_browser.javascript_files
(gauge) | Number of requests for JavaScript files.
Shown as item |
rigor.real_browser.javascript_bytes
(gauge) | Total size (bytes) of all JavaScript files loaded.
Shown as byte |
rigor.real_browser.css_files
(gauge) | Number of requests for CSS files.
Shown as item |
rigor.real_browser.css_bytes
(gauge) | Total size (bytes) of all CSS files loaded.
Shown as byte |
rigor.real_browser.video_files
(gauge) | Number of requests for videos.
Shown as item |
rigor.real_browser.video_bytes
(gauge) | Total size (bytes) of all videos loaded.
Shown as byte |
rigor.real_browser.font_files
(gauge) | Number of requests for fonts.
Shown as item |
rigor.real_browser.font_bytes
(gauge) | Total size (bytes) of all fonts loaded.
Shown as byte |
rigor.real_browser.other_files
(gauge) | Number of requests for all other resources that are not HTML
Shown as item |
rigor.real_browser.other_bytes
(gauge) | Total size (bytes) of all other resources loaded.
Shown as byte |
rigor.real_browser.client_errors
(gauge) | Number of responses with a status code between 400 and 499.
Shown as item |
rigor.real_browser.connection_errors
(gauge) | Number of responses where the status code is 504 or 0 (a browser-aborted request).
Shown as item |
rigor.real_browser.server_errors
(gauge) | Number of responses where the status code is 500 or higher (excluding 504).
Shown as item |
rigor.real_browser.errors
(gauge) | Total count of responses with status codes greater than or equal to 400.
Shown as item |
HTTP checks
rigor.http.dns_timerigor.http.first_byte_timerigor.http.response_time
Port checks
API checks
rigor.api.dns_timerigor.api.first_byte_timerigor.api.response_time
Real browser checks
rigor.real_browser.first_byte_time_msrigor.real_browser.dom_interactive_time_msrigor.real_browser.first_paint_time_msrigor.real_browser.start_render_msrigor.real_browser.first_contentful_paint_time_msrigor.real_browser.first_meaningful_paint_time_msrigor.real_browser.dom_load_time_msrigor.real_browser.dom_complete_time_msrigor.real_browser.onload_time_msrigor.real_browser.visually_complete_msrigor.real_browser.speed_indexrigor.real_browser.fully_loaded_time_msrigor.real_browser.requestsrigor.real_browser.content_bytesrigor.real_browser.html_filesrigor.real_browser.html_bytesrigor.real_browser.image_filesrigor.real_browser.image_bytesrigor.real_browser.javascript_filesrigor.real_browser.javascript_bytesrigor.real_browser.css_filesrigor.real_browser.css_bytesrigor.real_browser.video_filesrigor.real_browser.video_bytesrigor.real_browser.font_filesrigor.real_browser.font_bytesrigor.real_browser.other_filesrigor.real_browser.other_bytesrigor.real_browser.client_errorsrigor.real_browser.connection_errorsrigor.real_browser.server_errorsrigor.real_browser.errors
Additionally, if the integration is configured, browser User Timings are sent under the rigor.real_browser.marks and rigor.real_browser.measures namespaces.
See metadata.csv for a list of metrics provided by this integration.
Events
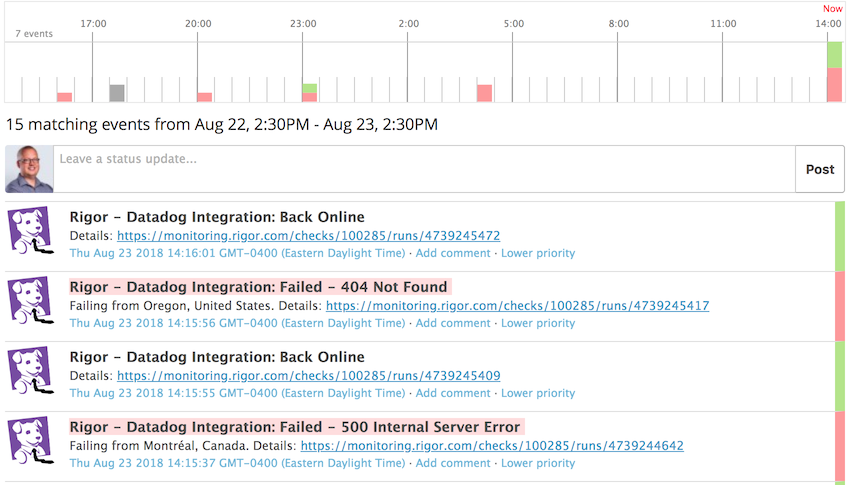
When a check is configured to alert through a Datadog event, two events types are pushed into Datadog:
- Failed - whenever the check fails enough to pass the threshold so that it sends an alert
- Back online - whenever the check successfully runs while in an alerting state
Service Checks
The Rigor integration does not include any service checks.
Troubleshooting
Need help? Contact Rigor support.