- 重要な情報
- はじめに
- Datadog
- Datadog サイト
- DevSecOps
- AWS Lambda のサーバーレス
- エージェント
- インテグレーション
- コンテナ
- ダッシュボード
- アラート設定
- ログ管理
- トレーシング
- プロファイラー
- タグ
- API
- Service Catalog
- Session Replay
- Continuous Testing
- Synthetic モニタリング
- Incident Management
- Database Monitoring
- Cloud Security Management
- Cloud SIEM
- Application Security Management
- Workflow Automation
- CI Visibility
- Test Visibility
- Intelligent Test Runner
- Code Analysis
- Learning Center
- Support
- 用語集
- Standard Attributes
- ガイド
- インテグレーション
- エージェント
- OpenTelemetry
- 開発者
- 認可
- DogStatsD
- カスタムチェック
- インテグレーション
- Create an Agent-based Integration
- Create an API Integration
- Create a Log Pipeline
- Integration Assets Reference
- Build a Marketplace Offering
- Create a Tile
- Create an Integration Dashboard
- Create a Recommended Monitor
- Create a Cloud SIEM Detection Rule
- OAuth for Integrations
- Install Agent Integration Developer Tool
- サービスのチェック
- IDE インテグレーション
- コミュニティ
- ガイド
- API
- モバイルアプリケーション
- CoScreen
- Cloudcraft
- アプリ内
- Service Management
- インフラストラクチャー
- アプリケーションパフォーマンス
- APM
- Continuous Profiler
- データベース モニタリング
- Data Streams Monitoring
- Data Jobs Monitoring
- Digital Experience
- Software Delivery
- CI Visibility (CI/CDの可視化)
- CD Visibility
- Test Visibility
- Intelligent Test Runner
- Code Analysis
- Quality Gates
- DORA Metrics
- セキュリティ
- セキュリティの概要
- Cloud SIEM
- クラウド セキュリティ マネジメント
- Application Security Management
- AI Observability
- ログ管理
- Observability Pipelines(観測データの制御)
- ログ管理
- 管理
モニター、SLO、ダッシュボードでの USM メトリクスの活用
概要
ユニバーサルサービスモニタリングは、一般的なコンテナタグ (app、short_image、kube_deployment など) を使用してサービスを検出し、それらのサービスのサービスカタログにエントリーを生成します。
You can access request, error, and duration metrics in Datadog for both inbound and outbound traffic on all services discovered with Universal Service Monitoring. These service health metrics are useful for creating alerts, tracking deployments, and getting started with service level objectives (SLOs) so you can get broad visibility into all services running on your infrastructure.
このガイドでは、universal.http.* などの USM メトリクスを検索して、モニター、SLO、ダッシュボードで使用する方法について説明します。
USM メトリクスと APM メトリクスの比較
| メトリクス名 | 単位 | タイプ | 説明 |
|---|---|---|---|
| universal.http.client | 秒 | Distribution | アウトバウンドリクエストのレイテンシー、カウント、エラー、およびレート。 |
| universal.http.client.hits | Hits | カウント | アウトバウンドリクエストとエラーの合計数。 |
| universal.http.client.apdex | スコア | Gauge | このサービスのアウトバウンドリクエストの Apdex スコア。 |
| universal.http.server | 秒 | Distribution | インバウンドリクエストのレイテンシー、カウント、エラー、およびレート。 |
| universal.http.server.hits | Hits | カウント | インバウンドリクエストとエラーの合計数。 |
| universal.http.server.apdex | スコア | Gauge | この Web サービスの Apdex スコア。 |
APM メトリクスとは異なり、エラーは別のメトリクスとしてではなく、error:true タグの下で利用可能です。
Note: The .hits metrics have all of your infrastructure tags and are the recommended way to query request and error counts. You can also add second primary tags to all USM metrics.
メトリクス構文
The USM metric query syntax differs from the APM metric query syntax, which uses trace.*. USM Metrics fall under a single distribution metric name.
例:
| APM | USM |
|---|---|
| trace.universal.http.client.hits{*} | count:universal.http.client{*} |
| trace.universal.http.client.errors | count:universal.http.client{error:true} |
| trace.universal.http.client.hits.by_http_status | count:universal.http.client{*} by http_status_family |
| pXX:trace.universal.http.client{*} | pXX:universal.http.client{*} |
| trace.universal.http.client.apdex{*} | universal.http.client.apdex{*} |
The same translations apply for the universal.http.server operation that captures inbound traffic. For more information about distribution metrics, see DDSketch-based Metrics in APM.
使用方法
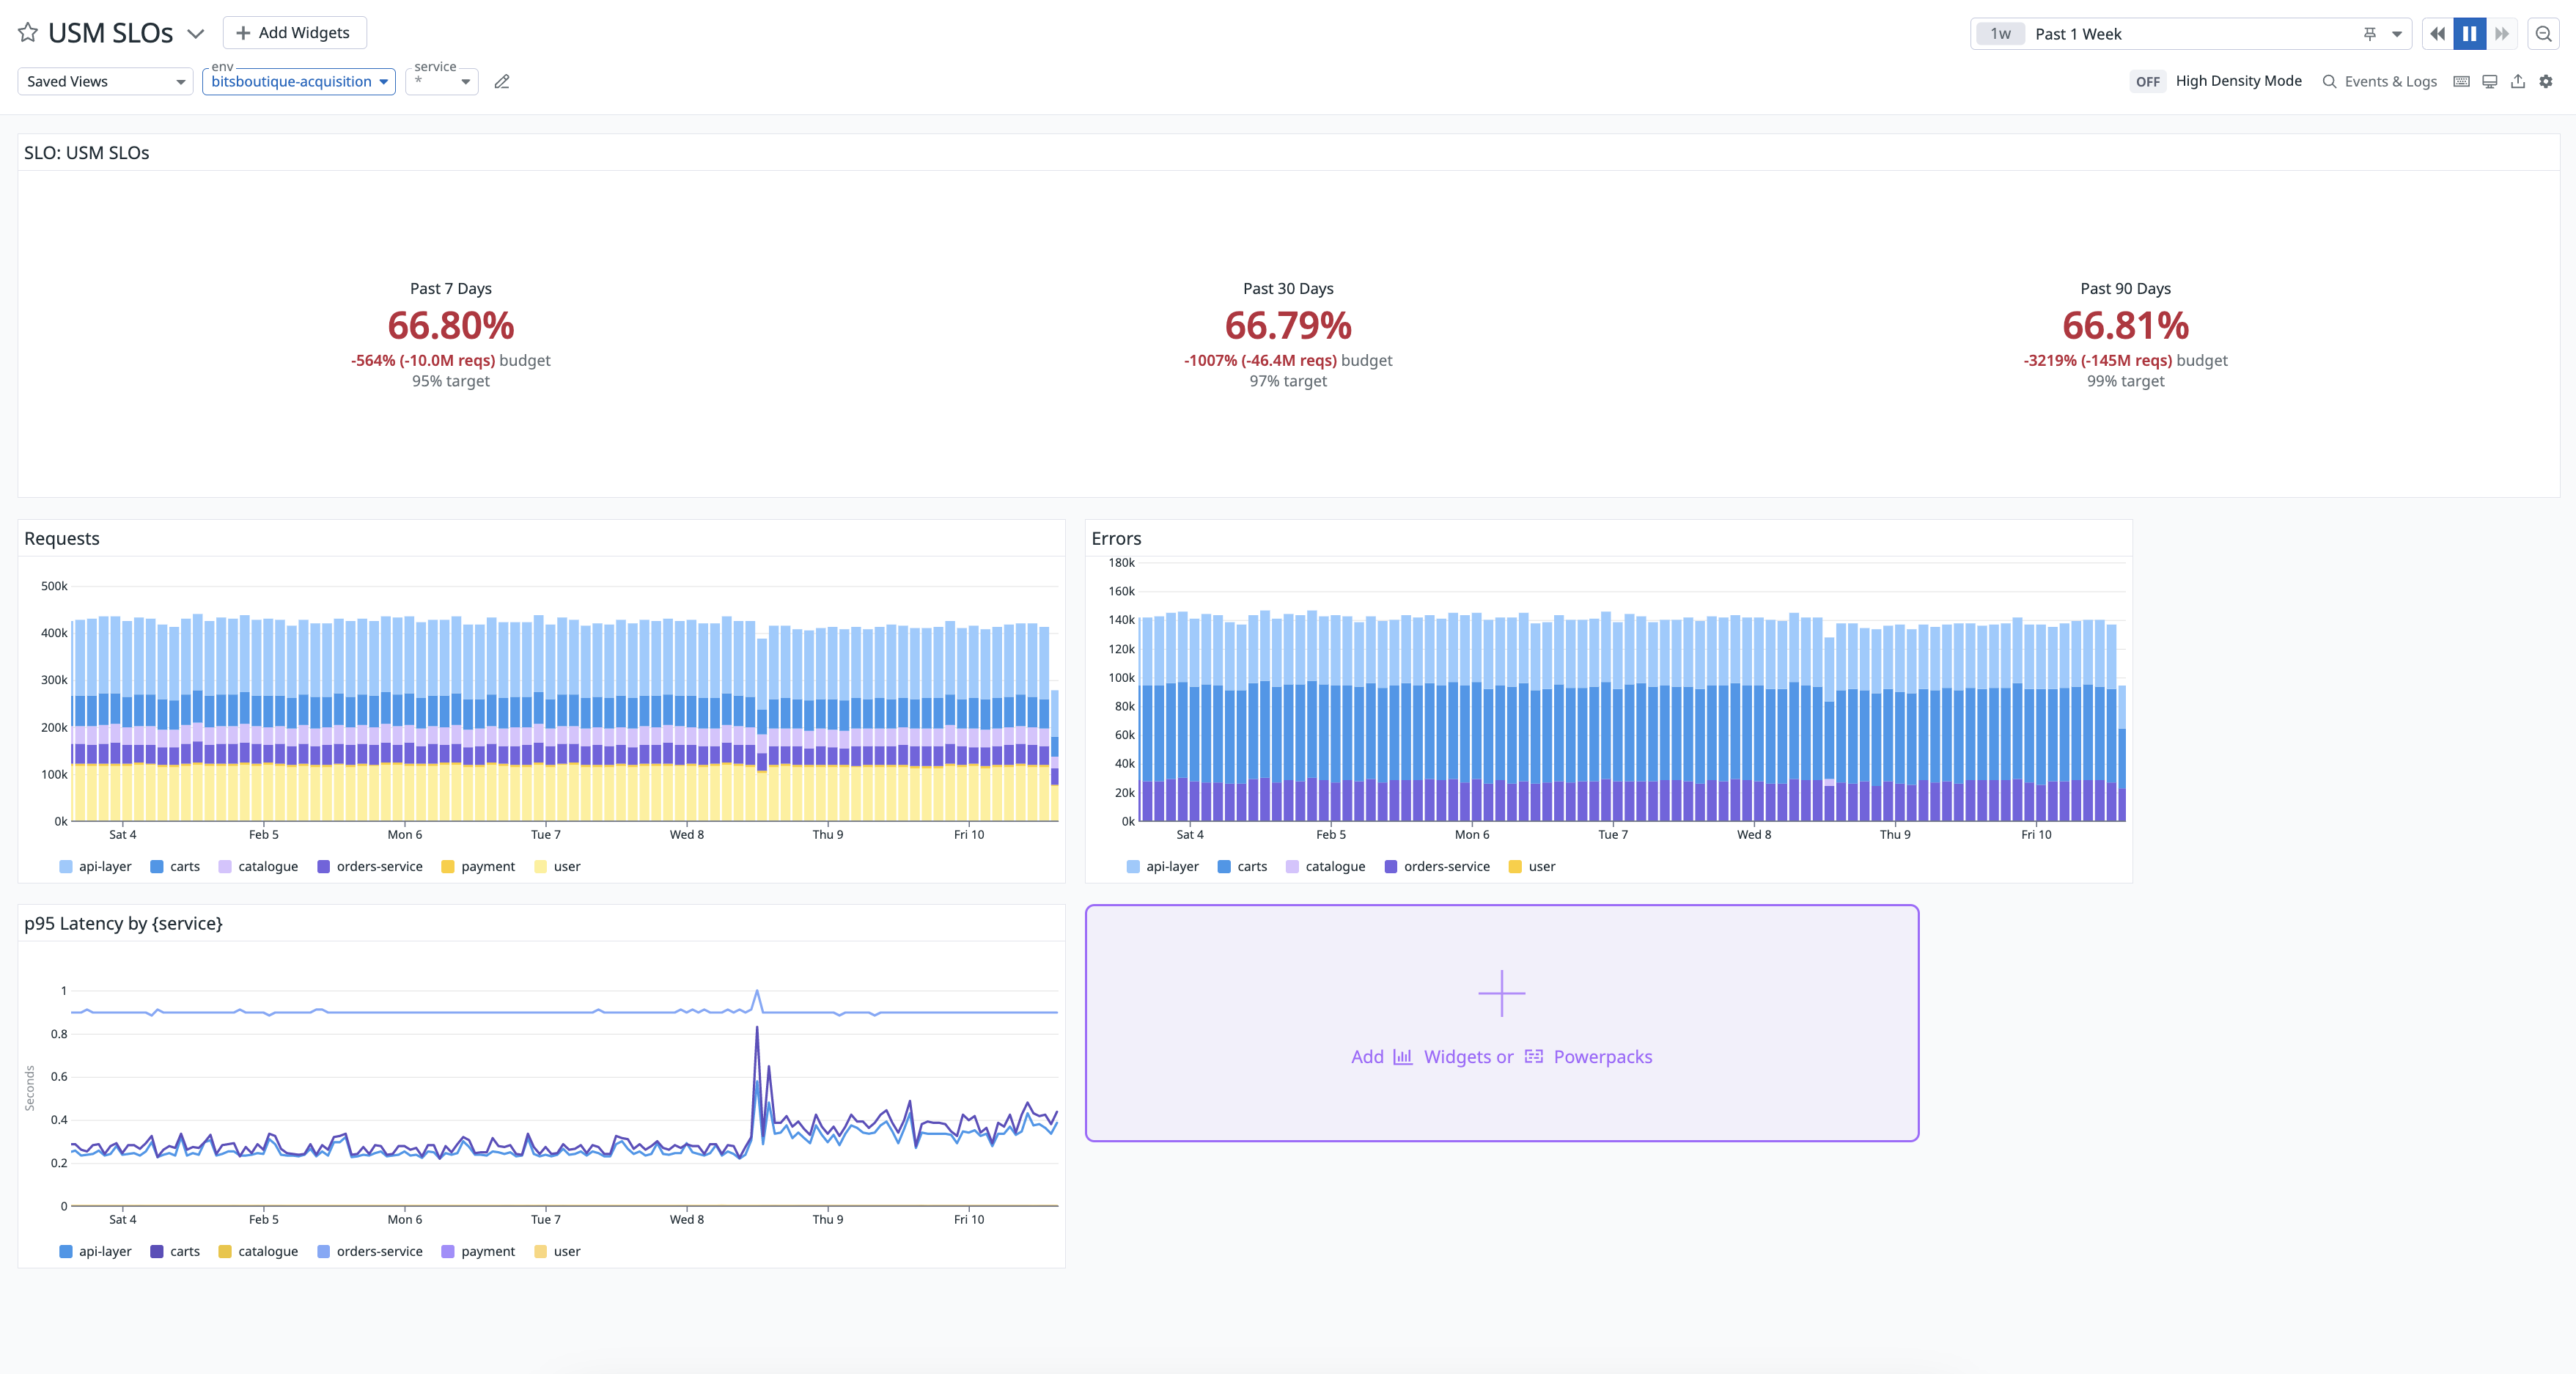
Navigate to Infrastructure > Universal Service Monitoring, filter by Universal Service Monitoring telemetry type, and click on a service. The Performance tab displays service-level graphs on hits, latency, requests, errors, and more. You can also access these metrics when creating a monitor or an SLO, or by looking at a dashboard in the Service Catalog.
モニターを作成
You can create an APM Monitor to trigger an alert when a USM metric such as universal.http.client either crosses a threshold or deviates from an expected pattern.
- Navigate to Monitors > New Monitor and click APM.
- Select APM Metrics and define a service or resource’s
envand any other primary tags. Select a service or resource to monitor and define time interval for the monitor to evaluate the query over. - Threshold Alert を選択し、トリガーするモニターのために
Requests per Secondのような USM メトリクスを選択します。次に、アラートと警告のしきい値を上または下にするかどうかを定義します。アラートしきい値、およびオプションで警告しきい値に値を入力します。 - 通知セクションには、このモニター用にあらかじめ入力されたメッセージが含まれています。アラート名とメッセージをカスタマイズし、このモニターの権限を定義します。
- Create をクリックします。
For more information, see the APM Monitor documentation.
SLO を作成する
You can create an SLO on a per-service basis to ensure you are meeting objectives set by USM metrics and improving availability over time. Datadog recommends creating an SLO programmatically to cover a lot of services.
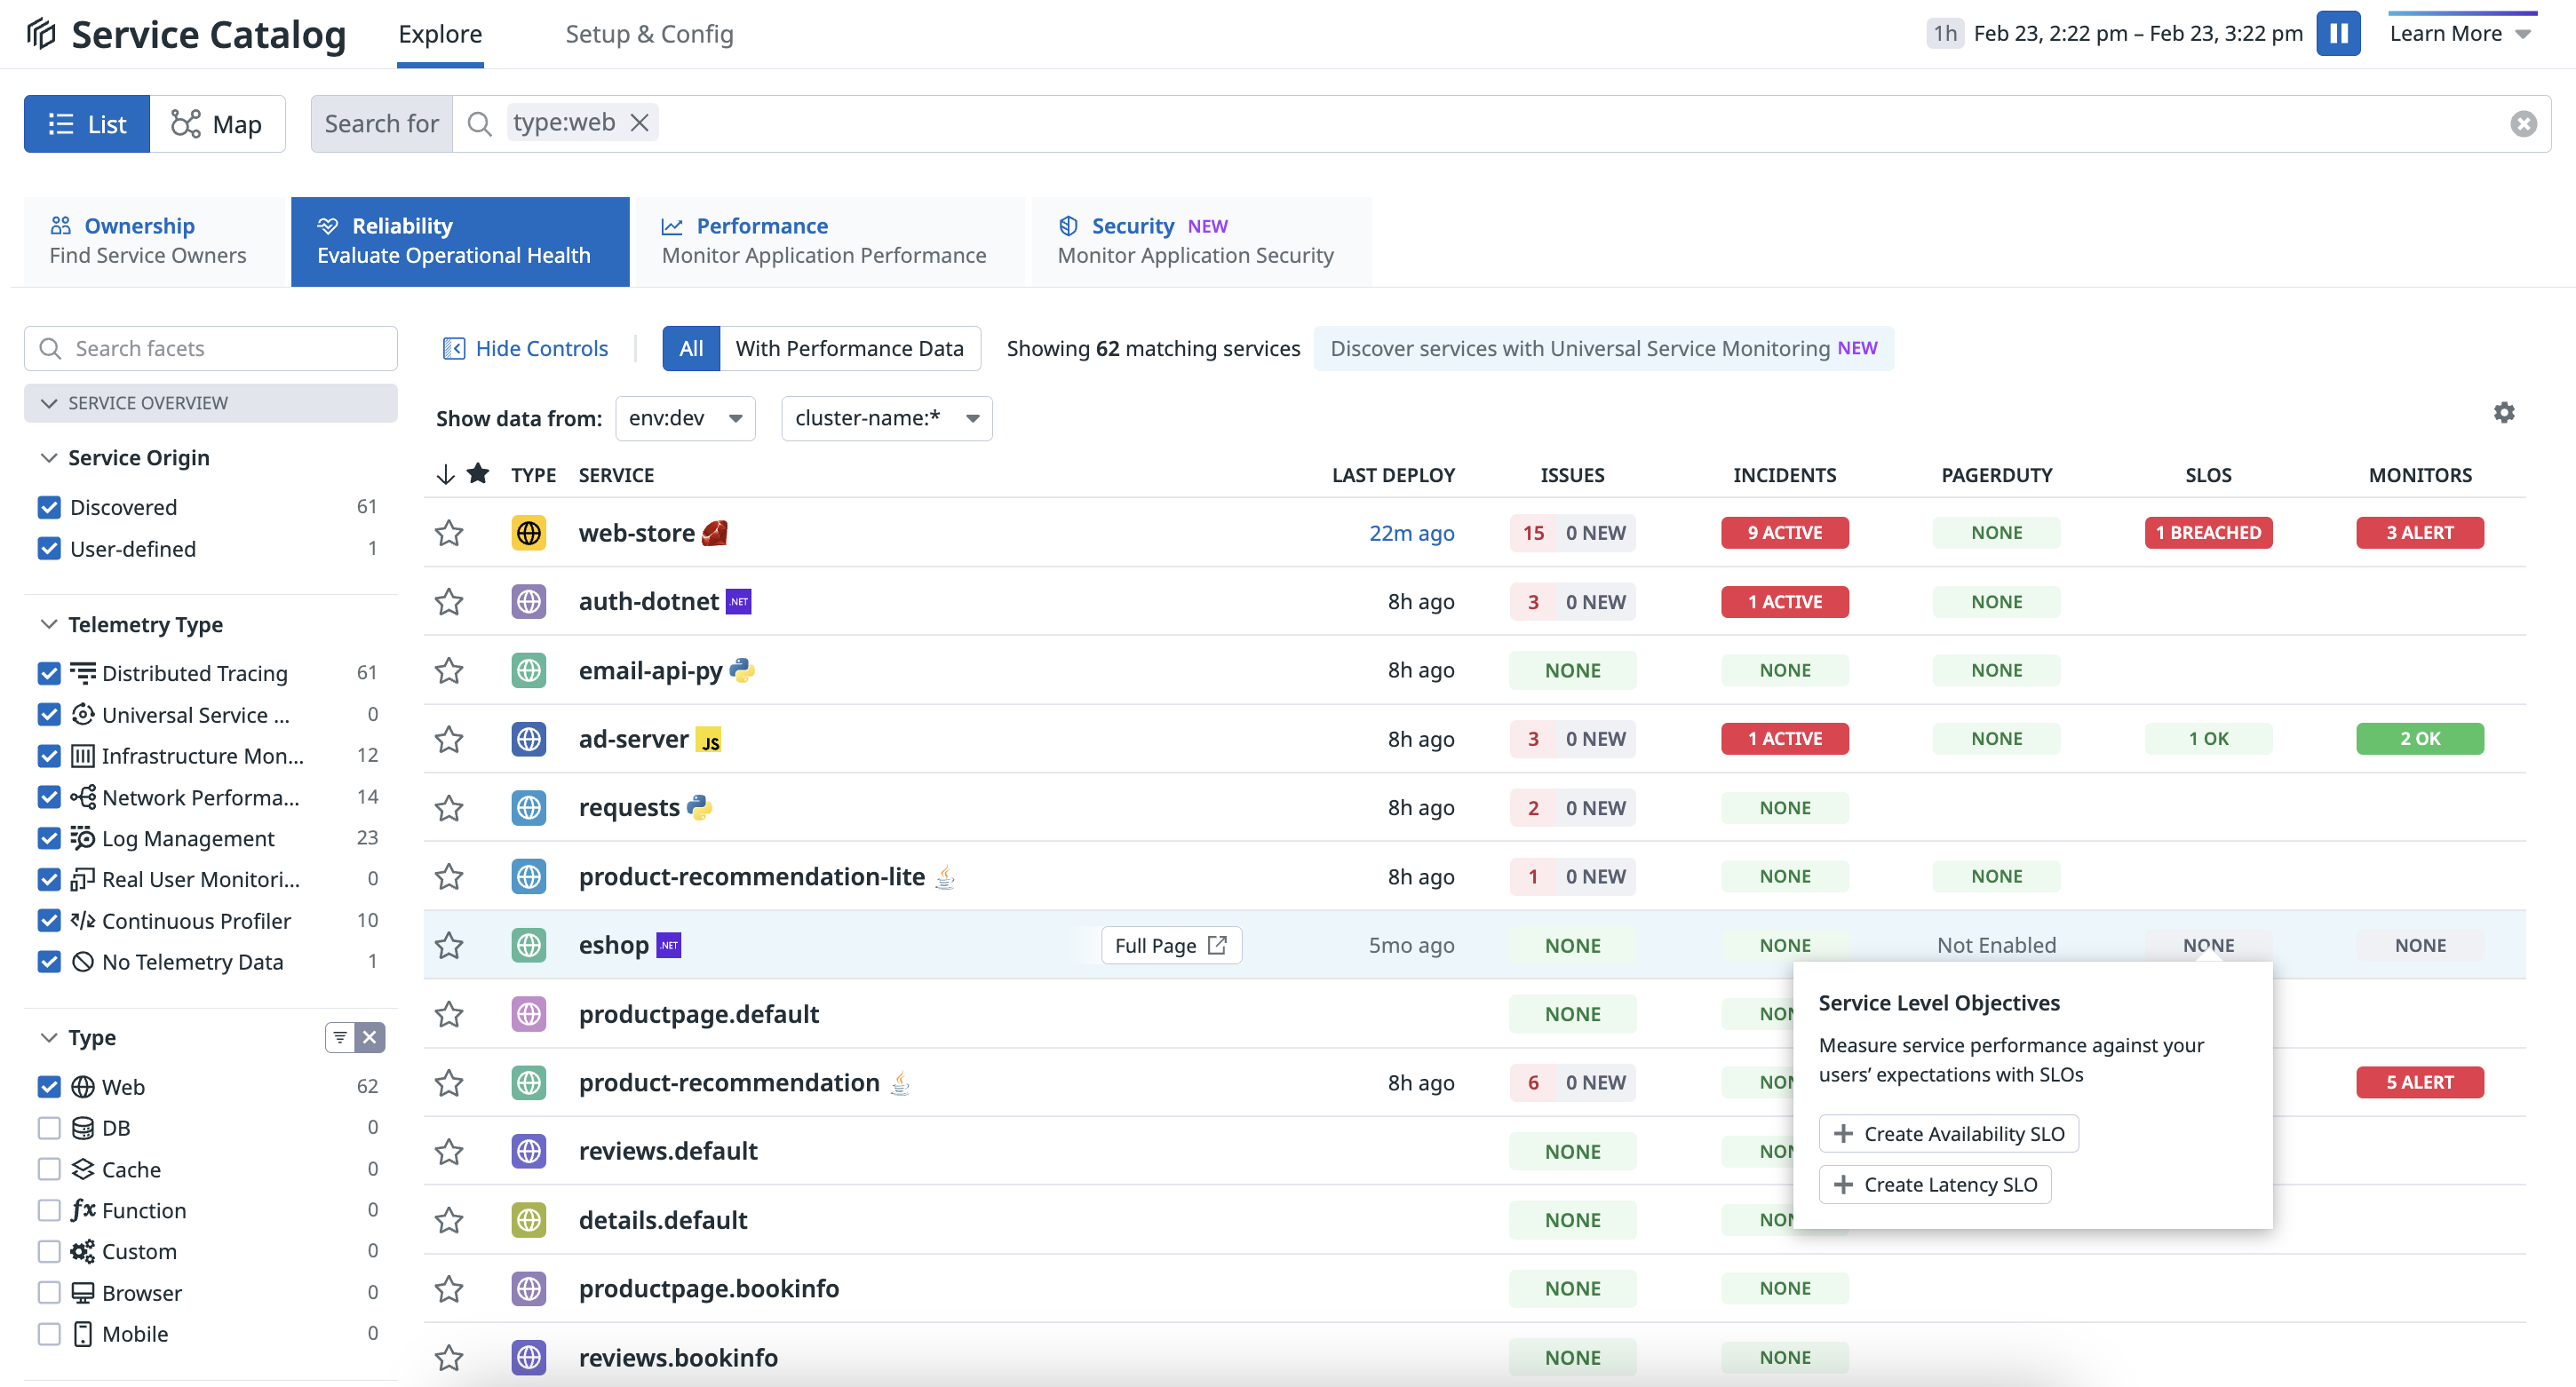
サービスカタログから SLO を作成するには
- Navigate to the Reliability tab of the Service Catalog.
- SLOs 列で、サービスにカーソルを合わせ、+ Create Availability SLO または + Create Latency SLO をクリックします。
オプションで、USM メトリクスを使用して SLO を手動で作成するには
Navigate to Service Management > SLOs and click New SLO.
Metric Based を選択し、Good events (numerator) セクションで 2 つのクエリを作成します。
- クエリ A:
universal.http.serverのような USM メトリクスを入力し、fromフィールドにプライマリserviceとenvタグを追加して特定のサービスにフィルターし、asフィールドでcountを選択します。 - クエリ B:
universal.http.serverのような USM メトリクスを入力し、fromフィールドにerror:trueタグに加えて、プライマリserviceとenvタグを追加して特定のサービスにフィルターし、asフィールドでcountを選択します。
- クエリ A:
+ Add Formula をクリックし、
a-bと入力します。Total events (denominator) セクションでは、
universal.http.serverのような USM メトリクスを入力し、fromフィールドにプライマリserviceとenvタグを追加して特定のサービスにフィルターし、asフィールドでcountを選択します。+ New Target をクリックすると、以下の設定でターゲットしきい値が作成されます。
- タイムウィンドウは
7 Days、ターゲットしきい値は95%、警告しきい値は99.5%です。Datadog では、すべてのタイムウィンドウで同じターゲットしきい値を設定することを推奨しています。
- タイムウィンドウは
この SLO の名前と説明を入力します。
teamタグに加えて、プライマリenvとserviceタグを設定します。Save and Set Alert をクリックします。
For more information, see the Service Level Objectives documentation.
定義されたダッシュボードにアクセスする
サービスカタログでは、サービス定義ファイルに定義されたダッシュボードを識別し、Dashboards タブに一覧表示します。Manage Dashboards をクリックすると、GitHub で直接サービス定義にアクセスし編集することができます。
For more information, see the Dashboards documentation.


