- Essentials
- Getting Started
- Datadog
- Datadog Site
- DevSecOps
- Serverless for AWS Lambda
- Agent
- Integrations
- Containers
- Dashboards
- Monitors
- Logs
- APM Tracing
- Profiler
- Tags
- API
- Service Catalog
- Session Replay
- Continuous Testing
- Synthetic Monitoring
- Incident Management
- Database Monitoring
- Cloud Security Management
- Cloud SIEM
- Application Security Management
- Workflow Automation
- CI Visibility
- Test Visibility
- Intelligent Test Runner
- Code Analysis
- Learning Center
- Support
- Glossary
- Standard Attributes
- Guides
- Agent
- Integrations
- OpenTelemetry
- Developers
- Authorization
- DogStatsD
- Custom Checks
- Integrations
- Create an Agent-based Integration
- Create an API Integration
- Create a Log Pipeline
- Integration Assets Reference
- Build a Marketplace Offering
- Create a Tile
- Create an Integration Dashboard
- Create a Recommended Monitor
- Create a Cloud SIEM Detection Rule
- OAuth for Integrations
- Install Agent Integration Developer Tool
- Service Checks
- IDE Plugins
- Community
- Guides
- API
- Datadog Mobile App
- CoScreen
- Cloudcraft
- In The App
- Dashboards
- Notebooks
- DDSQL Editor
- Sheets
- Monitors and Alerting
- Infrastructure
- Metrics
- Watchdog
- Bits AI
- Service Catalog
- API Catalog
- Error Tracking
- Service Management
- Infrastructure
- Application Performance
- APM
- Continuous Profiler
- Database Monitoring
- Data Streams Monitoring
- Data Jobs Monitoring
- Digital Experience
- Real User Monitoring
- Product Analytics
- Synthetic Testing and Monitoring
- Continuous Testing
- Software Delivery
- CI Visibility
- CD Visibility
- Test Visibility
- Intelligent Test Runner
- Code Analysis
- Quality Gates
- DORA Metrics
- Security
- Security Overview
- Cloud SIEM
- Cloud Security Management
- Application Security Management
- AI Observability
- Log Management
- Observability Pipelines
- Log Management
- Administration
Using USM Metrics in Monitors, SLOs, and Dashboards
Overview
Universal Service Monitoring discovers services using popular container tags (such as app, short_image, and kube_deployment) and generates entries in the Service Catalog for those services.
You can access request, error, and duration metrics in Datadog for both inbound and outbound traffic on all services discovered with Universal Service Monitoring. These service health metrics are useful for creating alerts, tracking deployments, and getting started with service level objectives (SLOs) so you can get broad visibility into all services running on your infrastructure.
This guide describes how to search for USM metrics such as universal.http.* and use them in your monitors, SLOs, and dashboards.
USM metrics vs APM metrics
| Metric Name | Units | Type | Description |
|---|---|---|---|
| universal.http.client | Seconds | Distribution | Outbound request latency, counts, errors, and rates. |
| universal.http.client.hits | Hits | Count | Total number of outbound requests and errors. |
| universal.http.client.apdex | Score | Gauge | The Apdex score of outbound requests for this service. |
| universal.http.server | Seconds | Distribution | Inbound request latency, counts, errors, and rates. |
| universal.http.server.hits | Hits | Count | Total number of inbound requests and errors. |
| universal.http.server.apdex | Score | Gauge | The Apdex score for this web service. |
Unlike APM metrics, errors are available under the error:true tag instead of as a separate metric.
Note: The .hits metrics have all of your infrastructure tags and are the recommended way to query request and error counts. You can also add second primary tags to all USM metrics.
Metric syntax
The USM metric query syntax differs from the APM metric query syntax, which uses trace.*. USM Metrics fall under a single distribution metric name.
For example:
| APM | USM |
|---|---|
| trace.universal.http.client.hits{*} | count:universal.http.client{*} |
| trace.universal.http.client.errors | count:universal.http.client{error:true} |
| trace.universal.http.client.hits.by_http_status | count:universal.http.client{*} by http_status_family |
| pXX:trace.universal.http.client{*} | pXX:universal.http.client{*} |
| trace.universal.http.client.apdex{*} | universal.http.client.apdex{*} |
The same translations apply for the universal.http.server operation that captures inbound traffic. For more information about distribution metrics, see DDSketch-based Metrics in APM.
Usage
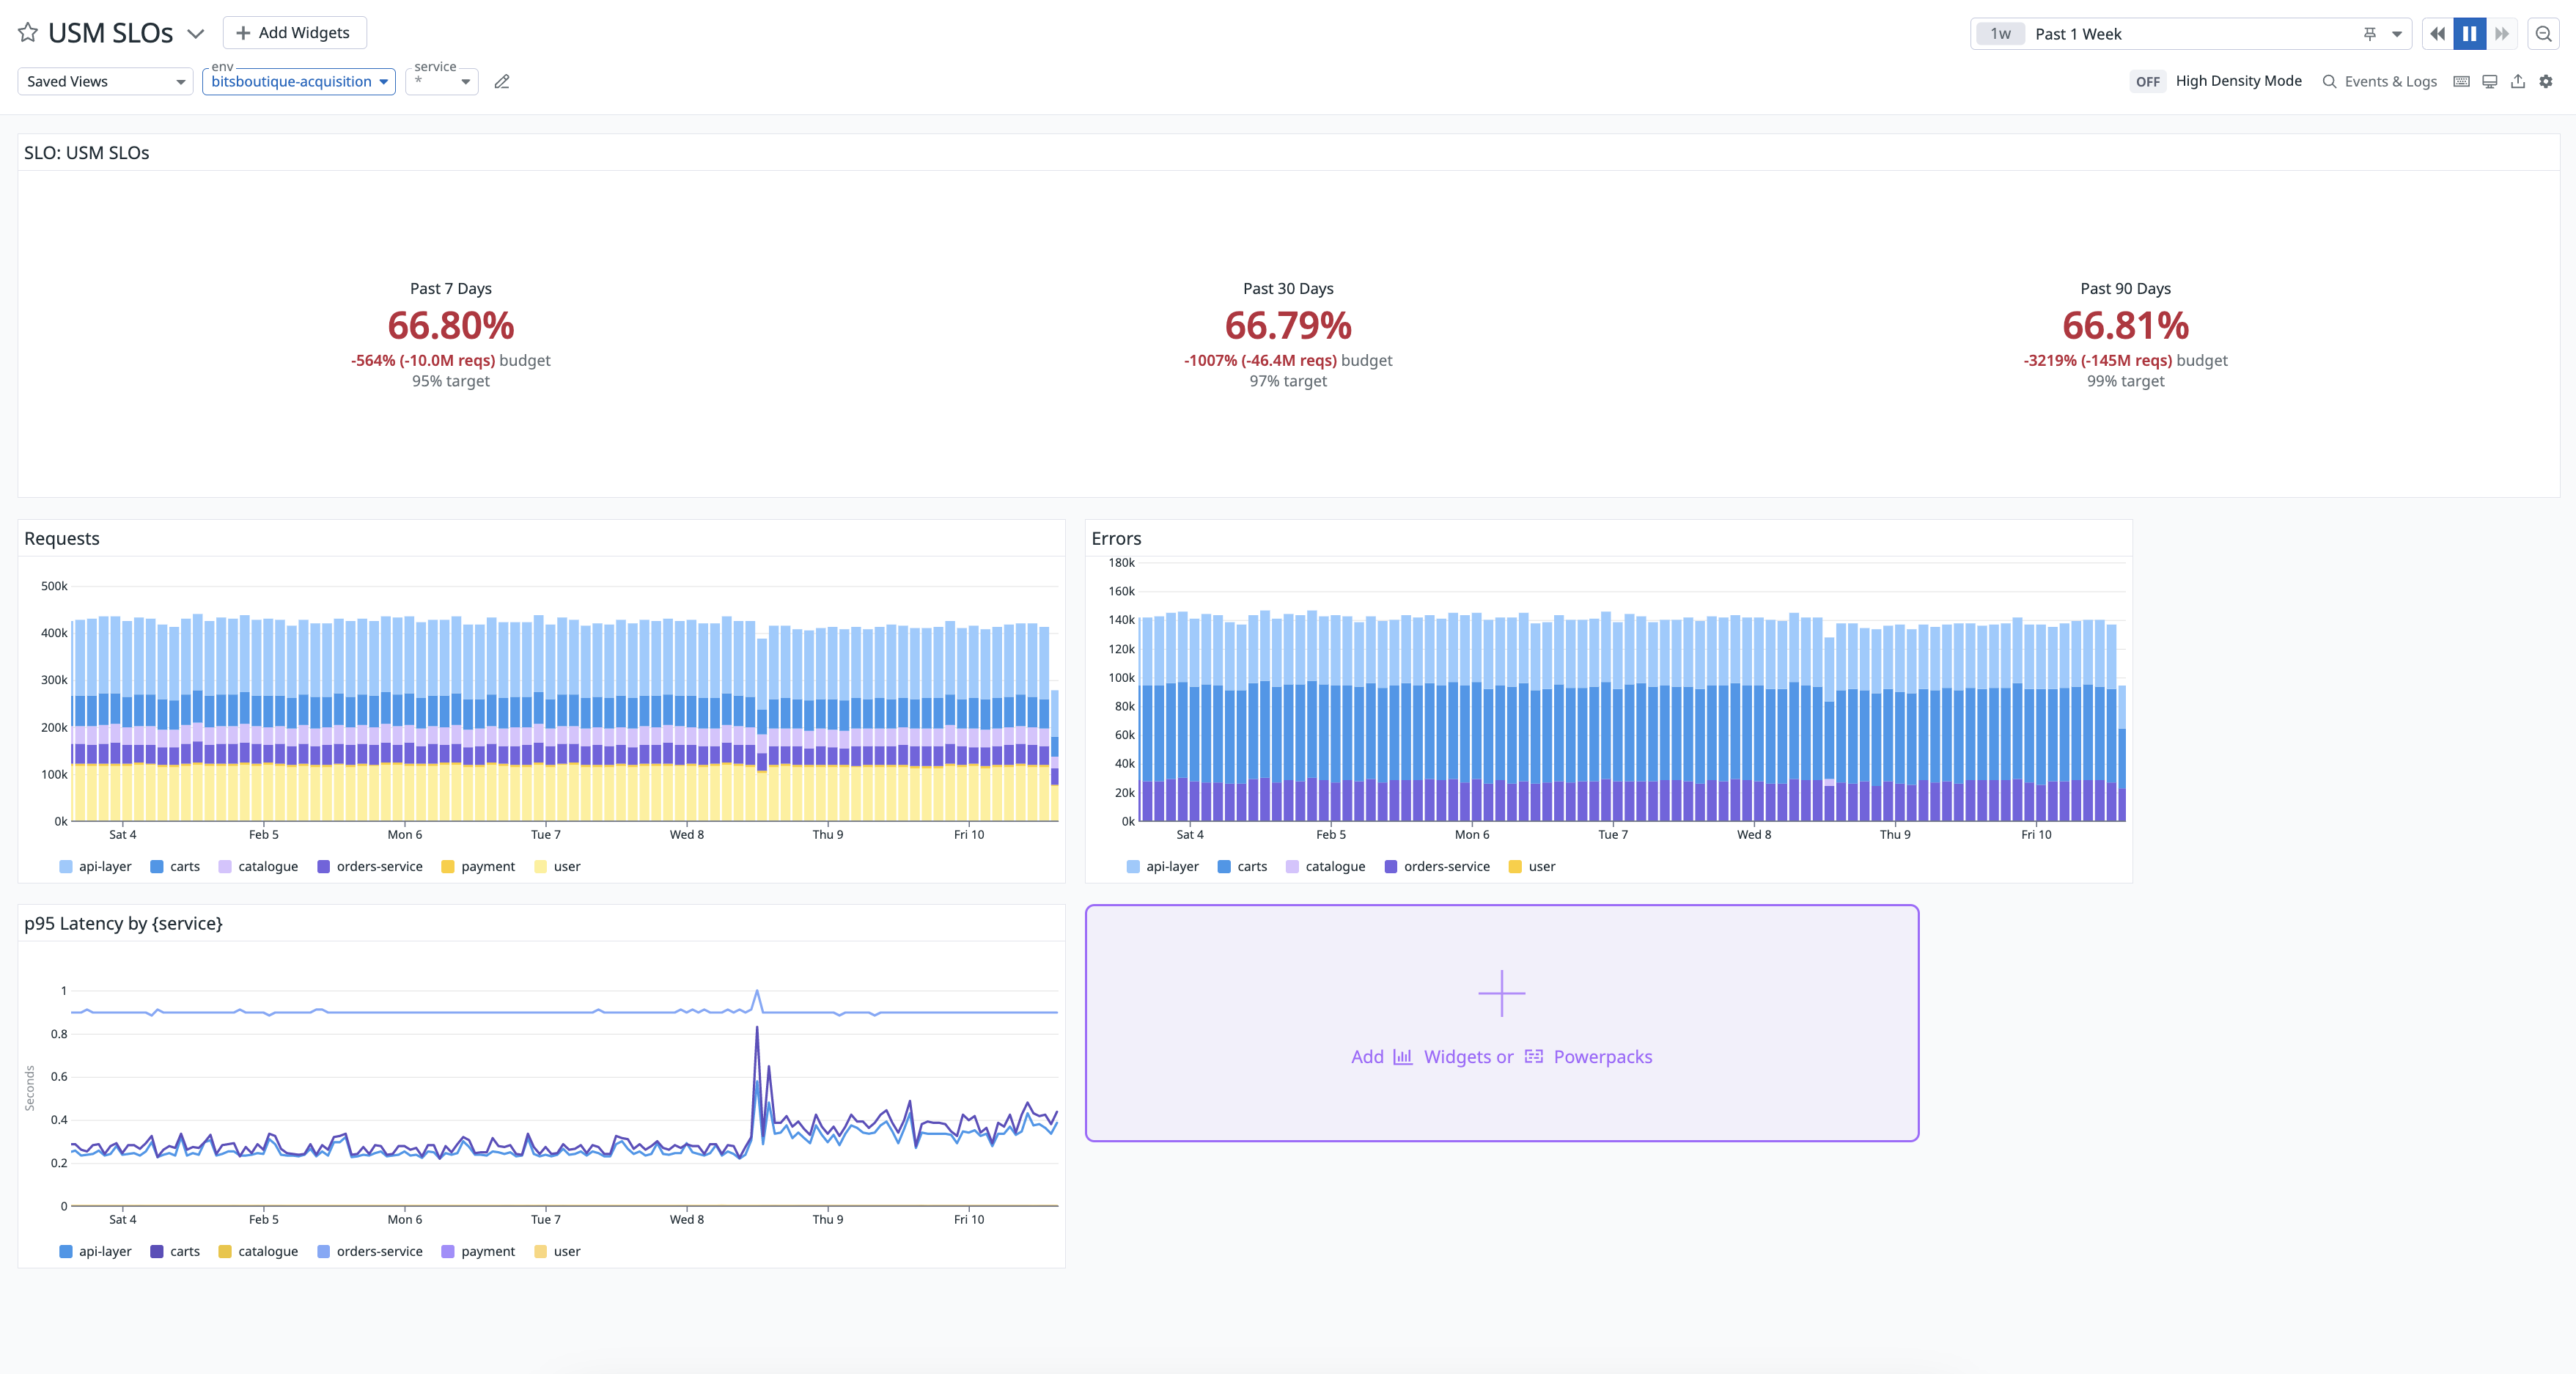
Navigate to Infrastructure > Universal Service Monitoring, filter by Universal Service Monitoring telemetry type, and click on a service. The Performance tab displays service-level graphs on hits, latency, requests, errors, and more. You can also access these metrics when creating a monitor or an SLO, or by looking at a dashboard in the Service Catalog.
Create a monitor
You can create an APM Monitor to trigger an alert when a USM metric such as universal.http.client either crosses a threshold or deviates from an expected pattern.
- Navigate to Monitors > New Monitor and click APM.
- Select APM Metrics and define a service or resource’s
envand any other primary tags. Select a service or resource to monitor and define time interval for the monitor to evaluate the query over. - Select Threshold Alert and select a USM metric such as
Requests per Secondfor the monitor to trigger on. Then, define if the value should be above or below the alert and warning thresholds. Enter a value for the alert threshold, and optionally, for the warning threshold. - The notification section contains a prepopulated message for the monitor. Customize the alert name and message and define the permissions for this monitor.
- Click Create.
For more information, see the APM Monitor documentation.
Create an SLO
You can create an SLO on a per-service basis to ensure you are meeting objectives set by USM metrics and improving availability over time. Datadog recommends creating an SLO programmatically to cover a lot of services.
To create an SLO from the Service Catalog:
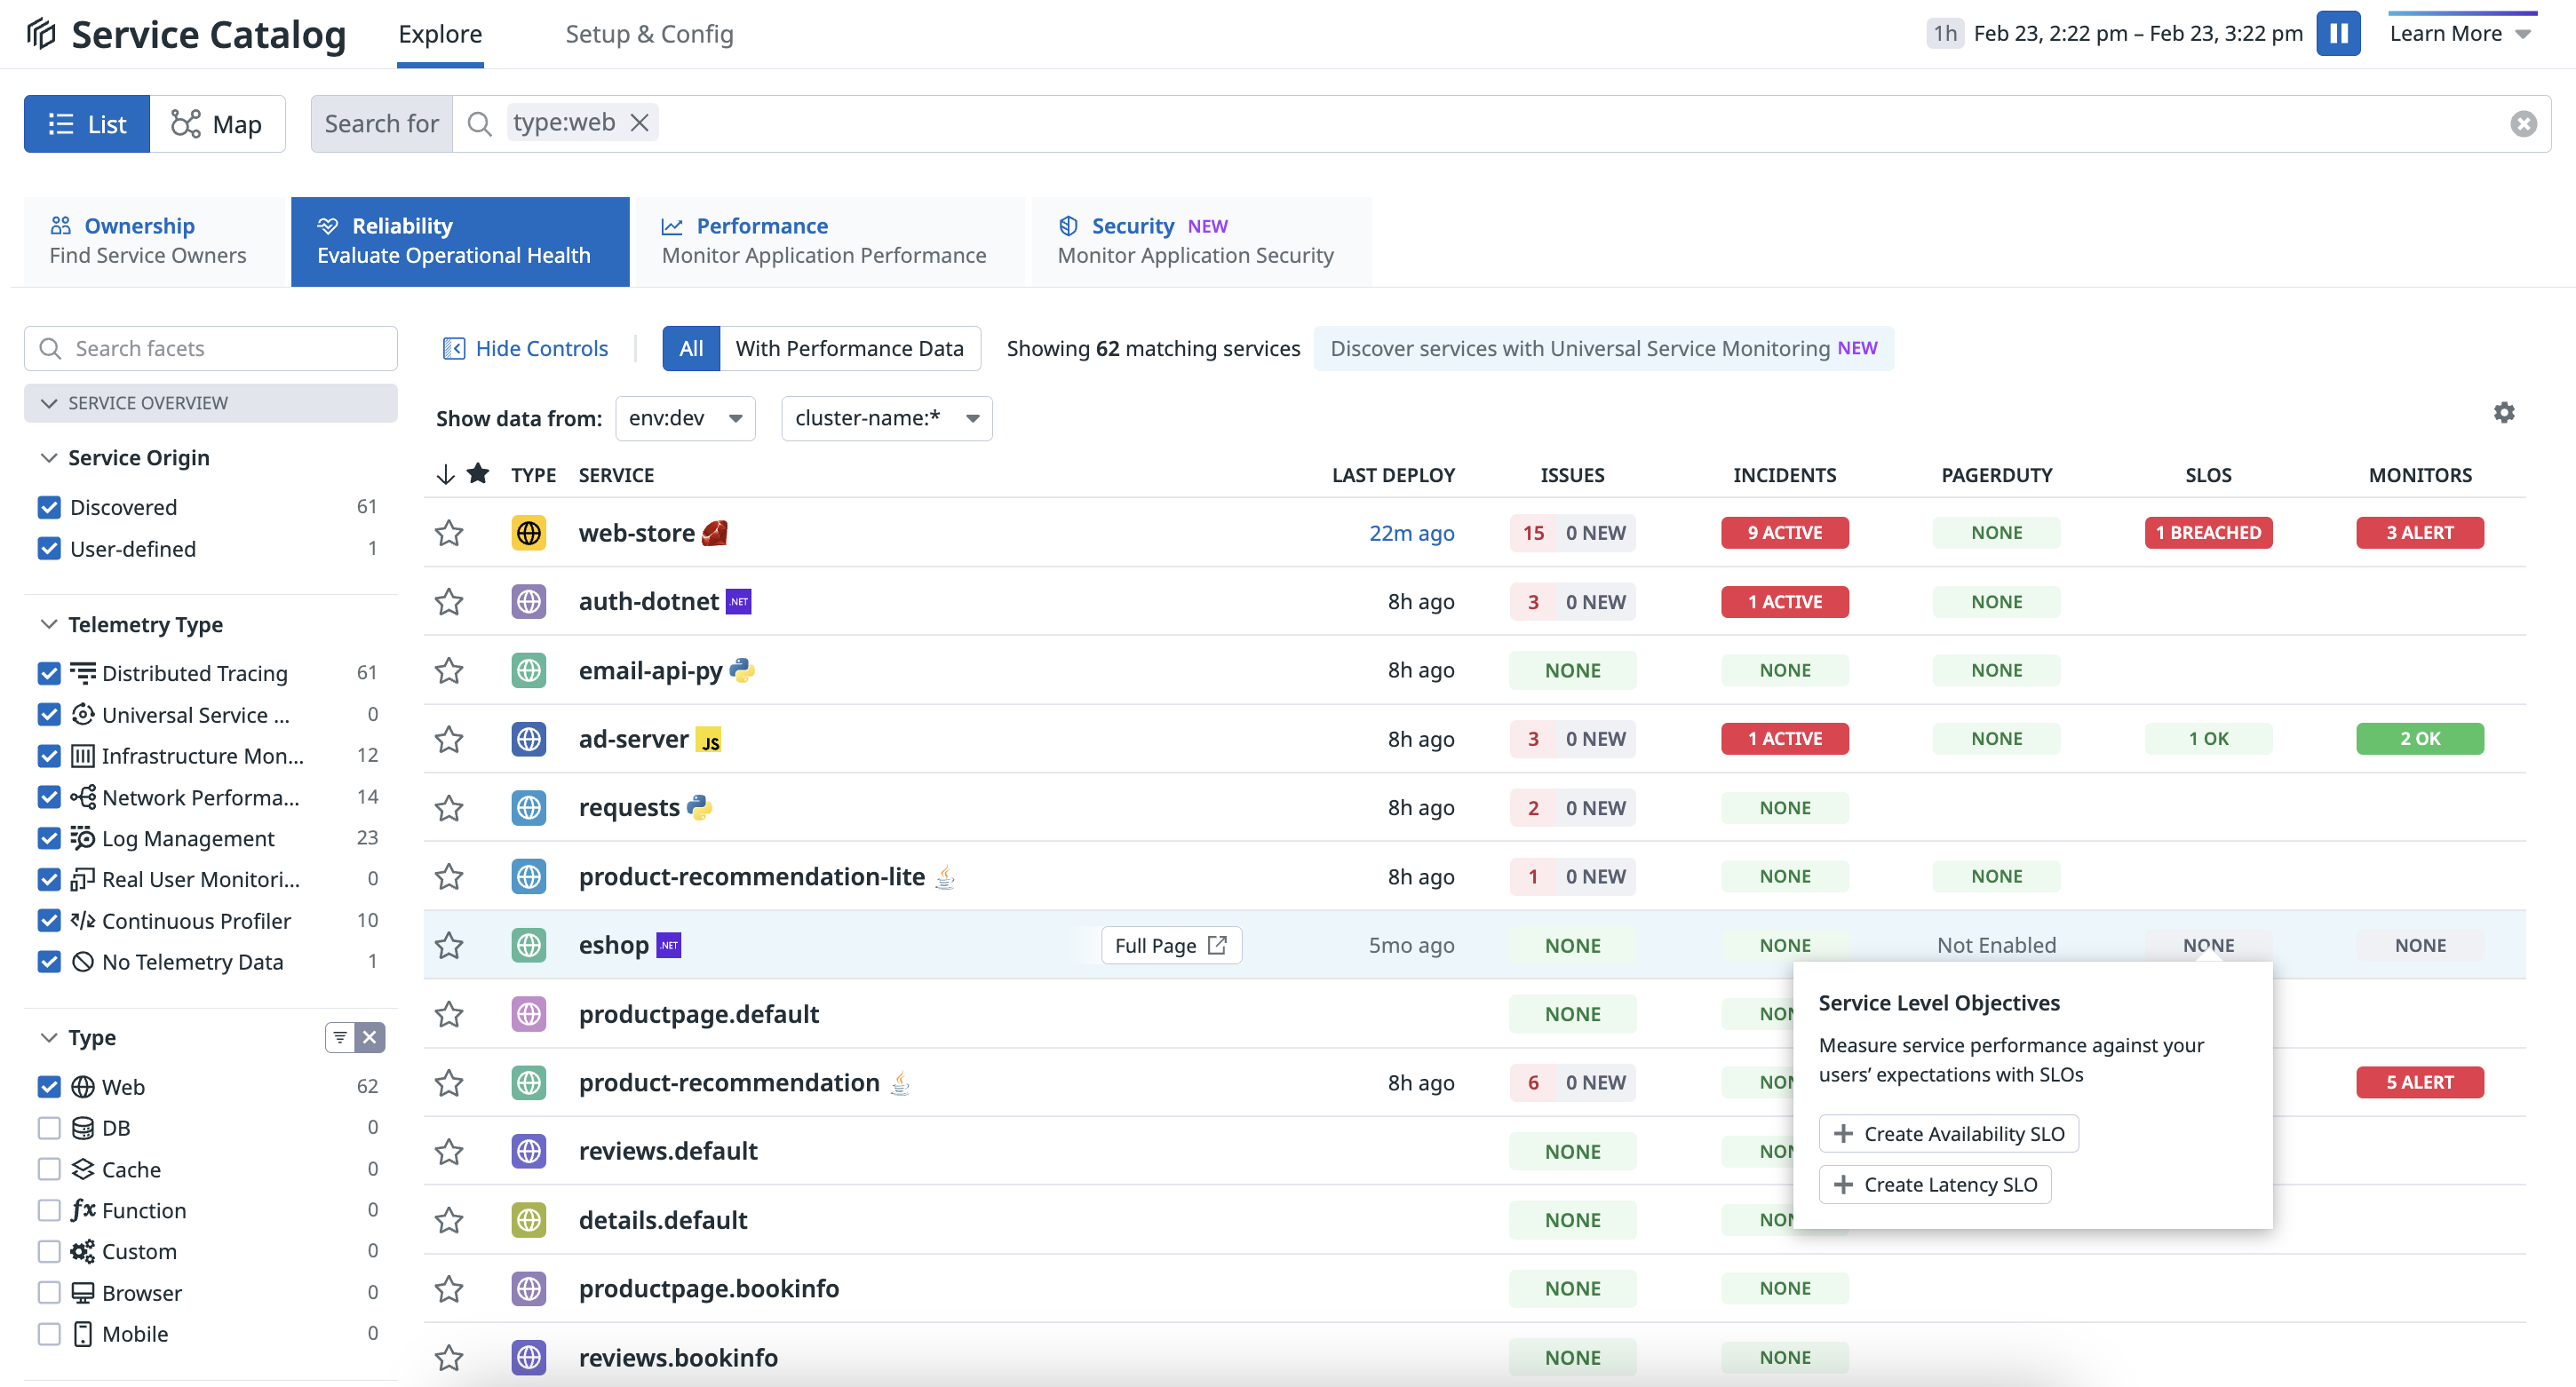
- Navigate to the Reliability tab of the Service Catalog.
- Under the SLOs column, hover over a service and click + Create Availability SLO or + Create Latency SLO.
Optionally, to create an SLO manually using USM metrics:
Navigate to Service Management > SLOs and click New SLO.
Select Metric Based and create two queries in the Good events (numerator) section:
- Query A: Enter a USM metric such as
universal.http.server, filter to a specific service by adding primaryserviceandenvtags in thefromfield, and selectcountin theasfield. - Query B: Enter a USM metric such as
universal.http.server, filter to a specific service by adding primaryserviceandenvtags, in addition to anerror:truetag in thefromfield, and selectcountin theasfield.
- Query A: Enter a USM metric such as
Click + Add Formula and enter
a-b.In the Total events (denominator) section, enter a USM metric such as
universal.http.server, filter to a specific service by adding primaryserviceandenvtags in thefromfield, and selectcountin theasfield.Click + New Target to create a target threshold with the following settings:
- The time window is
7 Days, the target threshold is95%, and the warning threshold is99.5%. Datadog recommends setting the same target threshold across all time windows.
- The time window is
Enter a name and description for this SLO. Set primary
envandservicetags, in addition to theteamtag.Click Save and Set Alert.
For more information, see the Service Level Objectives documentation.
Access a defined dashboard
The Service Catalog identifies dashboards defined in your service definition file and lists them on the Dashboards tab. Click Manage Dashboards to access and edit the service definition directly in GitHub.
For more information, see the Dashboards documentation.
Further Reading
Additional helpful documentation, links, and articles:


