- Essentials
- Getting Started
- Datadog
- Datadog Site
- DevSecOps
- Serverless for AWS Lambda
- Agent
- Integrations
- Containers
- Dashboards
- Monitors
- Logs
- APM Tracing
- Profiler
- Tags
- API
- Service Catalog
- Session Replay
- Continuous Testing
- Synthetic Monitoring
- Incident Management
- Database Monitoring
- Cloud Security Management
- Cloud SIEM
- Application Security Management
- Workflow Automation
- CI Visibility
- Test Visibility
- Test Impact Analysis
- Code Analysis
- Learning Center
- Support
- Glossary
- Standard Attributes
- Guides
- Agent
- Integrations
- OpenTelemetry
- Developers
- Authorization
- DogStatsD
- Custom Checks
- Integrations
- Create an Agent-based Integration
- Create an API Integration
- Create a Log Pipeline
- Integration Assets Reference
- Build a Marketplace Offering
- Create a Tile
- Create an Integration Dashboard
- Create a Recommended Monitor
- Create a Cloud SIEM Detection Rule
- OAuth for Integrations
- Install Agent Integration Developer Tool
- Service Checks
- IDE Plugins
- Community
- Guides
- API
- Datadog Mobile App
- CoScreen
- Cloudcraft
- In The App
- Dashboards
- Notebooks
- DDSQL Editor
- Sheets
- Monitors and Alerting
- Infrastructure
- Metrics
- Watchdog
- Bits AI
- Service Catalog
- API Catalog
- Error Tracking
- Service Management
- Infrastructure
- Application Performance
- APM
- Continuous Profiler
- Database Monitoring
- Data Streams Monitoring
- Data Jobs Monitoring
- Digital Experience
- Real User Monitoring
- Product Analytics
- Synthetic Testing and Monitoring
- Continuous Testing
- Software Delivery
- CI Visibility
- CD Visibility
- Test Optimization
- Code Analysis
- Quality Gates
- DORA Metrics
- Security
- Security Overview
- Cloud SIEM
- Cloud Security Management
- Application Security Management
- AI Observability
- Log Management
- Observability Pipelines
- Log Management
- Administration
Monitor Summary Widget
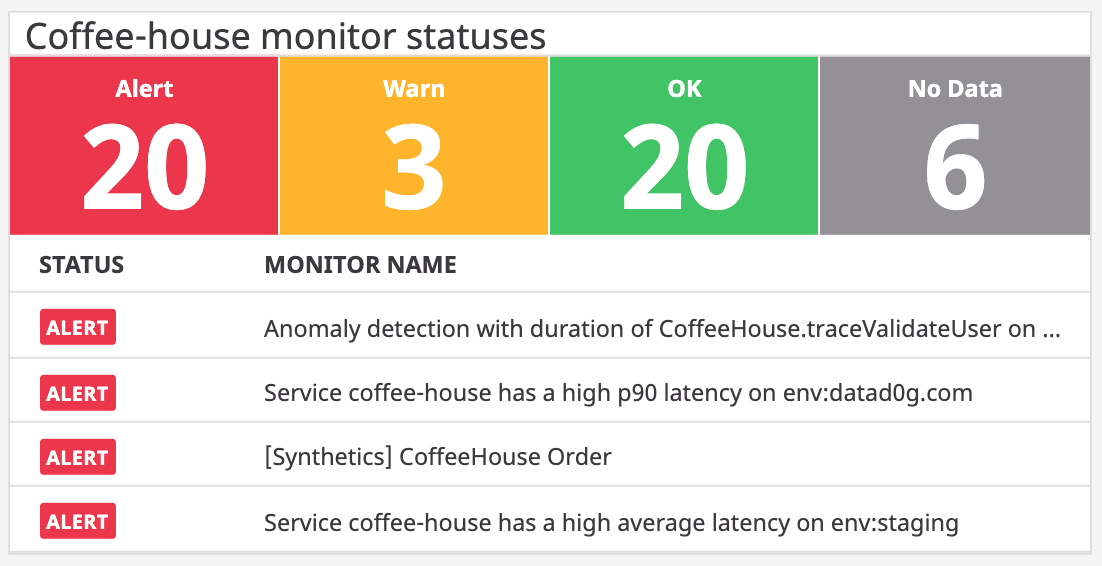
The monitor summary widget displays a summary view of all your Datadog monitors, or a subset based on a query.
Setup
Configuration
Select one of the three summary types:
Monitor,GrouporCombined- The
Monitorsummary type lists statuses and names of monitors matching the monitor query. Multi alert monitors have only one row in the results list and their status is the multi alert monitor’s overall status. The Status Counts are the number of matching monitors with each status type.
- The
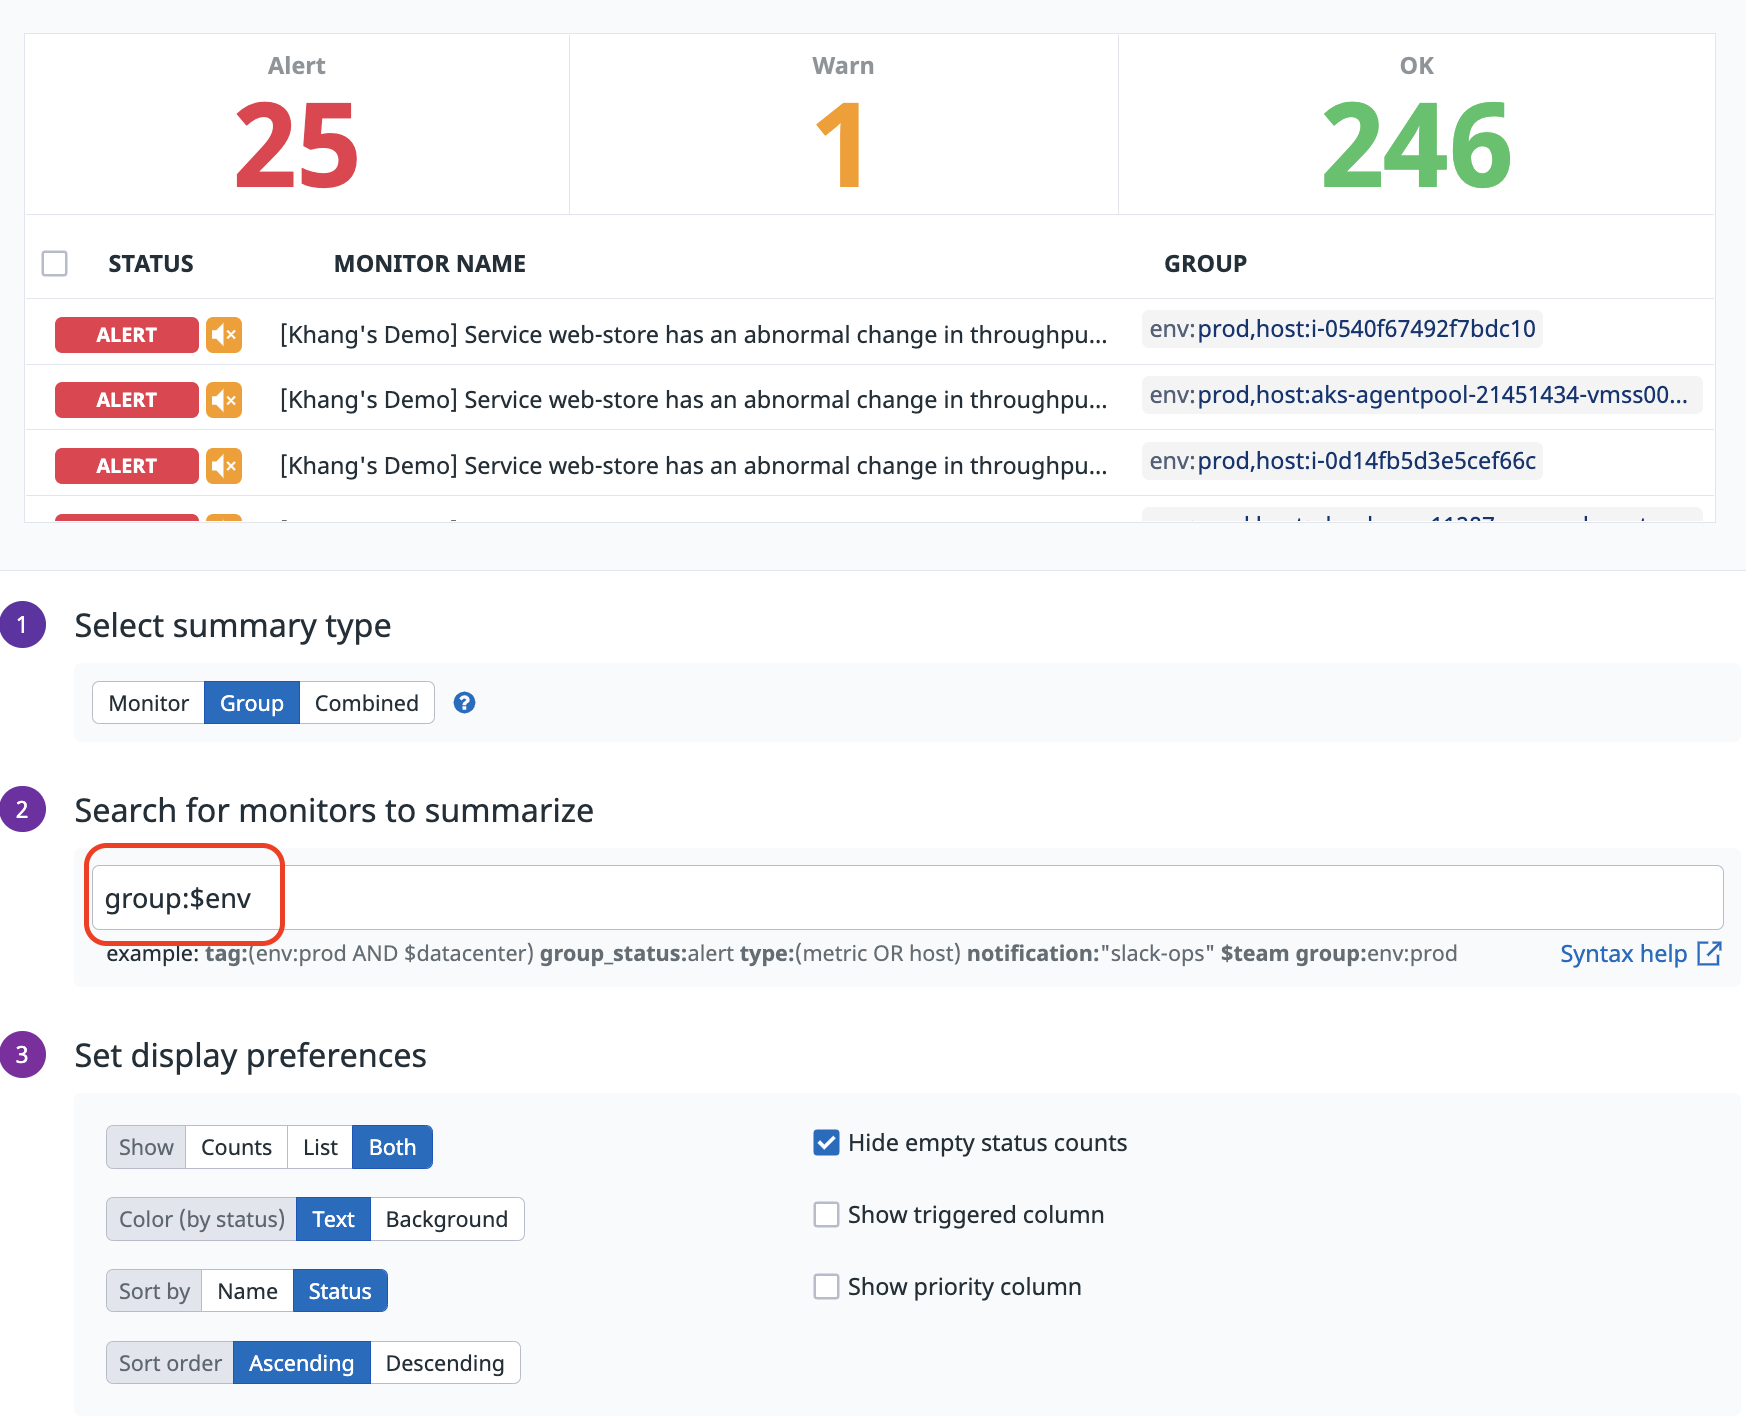
Groupsummary type lists statuses, names, and groups of monitors matching the monitor query. Multi alert monitors are broken into several rows in the results list and correspond to each group and that group’s specific status in the multi alert monitor. TheGroupsummary type also supportsgroupandgroup_statusfacets in its monitor query similar to the Triggered Monitors page. The Status Counts are the number of matching monitor groups with each status type.
- The
Combinedsummary type lists the number of group statuses and names of the monitors matching the monitor query. Multi alert monitors have only one row in the results list like in theMonitorsummary type but the groups column displays the number of groups in each status type instead of the monitor’s overall status. Similar to theGroupsummary type, theCombinedsummary type also supports thegroupandgroup_statusfacets in its monitor query. The Status Counts still show the count of overall monitor statuses like in theMonitorsummary type.
- The
Enter a monitor query to display the monitor summary widget over a subset of your monitors.
Note In addition to the facets listed in the link above, the
GroupandCombinedsummary types also support thegroupandgroup_statusfacets for group-level searching, similar to the Triggered Monitors page.
Template variables
To use template variables created in your dashboard in the monitor summary search query, follow the same query format as the Manage Monitor page.
Example
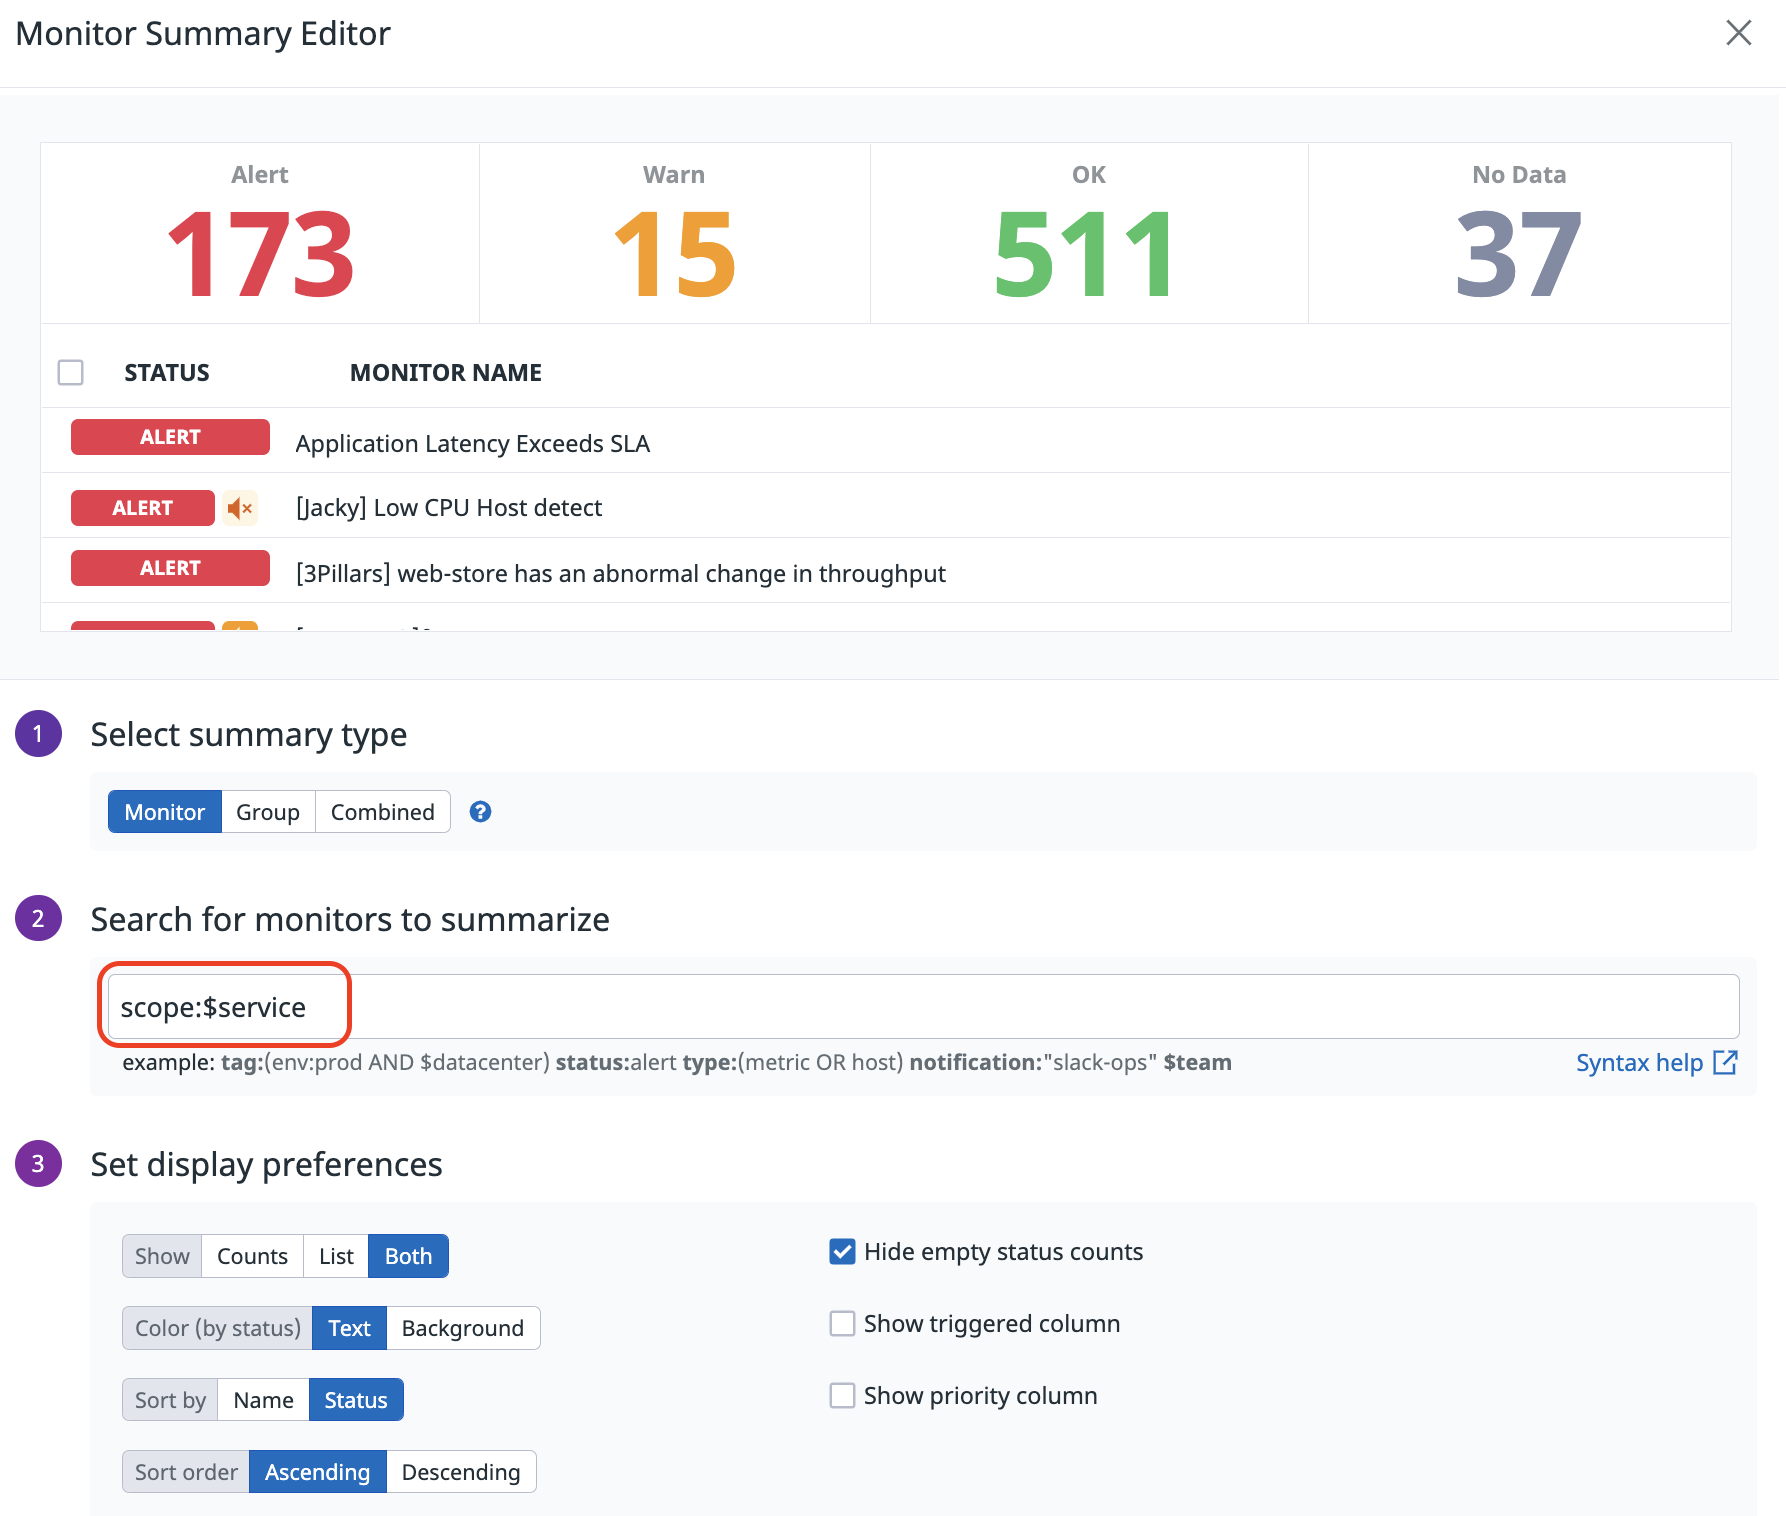
Filtering on Monitor
scopewith a$servicetemplate variable.To leverage
scopein the manage or triggered monitor page, you have to doscope:service:web-store. Therefore in the widget you have to doscope:$serviceto then apply the template variable value to the widget.Filtering on Monitor
groupwith a$envtemplate variable.To leverage
groupin the manage or triggered monitor page, you have to dogroup:env:prod. Therefore in the widget you have to dogroup:$envto then apply the template variable value to the widget.
Options
Display preferences
Choose to show only the Count of monitors per monitor status type, a List of monitors, or Both. The Text and Background options specify whether the status colors should be applied to the text or background of the Status Counts. The Hide empty Status Counts option, when enabled, only shows the Status Counts for statuses that have more than zero monitors in the result list.
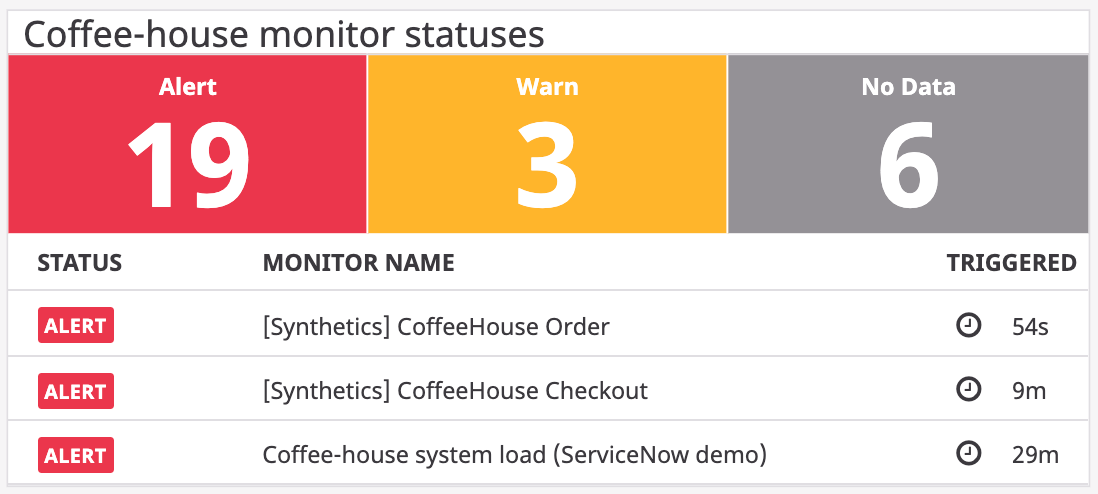
Selecting the Show triggered column option filters the results to monitors or monitor groups that are in a triggered state (Alert, Warn, or No Data) and sorts them from most recently triggered to least recently triggered. An additional column is added indicating the amount of time that has elapsed since the monitor/group last triggered.
API
This widget can be used with the Dashboards API. See the following table for the widget JSON schema definition:
{
  "color_preference": "string",
  "count": "integer",
  "display_format": "string",
  "hide_zero_counts": false,
  "query": "",
  "show_last_triggered": false,
  "show_priority": false,
  "sort": "name,asc",
  "start": "integer",
  "summary_type": "string",
  "title": "string",
  "title_align": "string",
  "title_size": "string",
  "type": "manage_status"
}
Further Reading
Additional helpful documentation, links, and articles:


