- Esenciales
- Empezando
- Datadog
- Sitio web de Datadog
- DevSecOps
- Serverless para Lambda AWS
- Agent
- Integraciones
- Contenedores
- Dashboards
- Monitores
- Logs
- Rastreo de APM
- Generador de perfiles
- Etiquetas (tags)
- API
- Catálogo de servicios
- Session Replay
- Continuous Testing
- Monitorización Synthetic
- Gestión de incidencias
- Monitorización de bases de datos
- Cloud Security Management
- Cloud SIEM
- Application Security Management
- Workflow Automation
- CI Visibility
- Test Visibility
- Intelligent Test Runner
- Análisis de código
- Centro de aprendizaje
- Compatibilidad
- Glosario
- Atributos estándar
- Guías
- Agent
- Uso básico del Agent
- Arquitectura
- IoT
- Plataformas compatibles
- Recopilación de logs
- Configuración
- Configuración remota
- Automatización de flotas
- Actualizar el Agent
- Solucionar problemas
- Detección de nombres de host en contenedores
- Modo de depuración
- Flare del Agent
- Estado del check del Agent
- Problemas de NTP
- Problemas de permisos
- Problemas de integraciones
- Problemas del sitio
- Problemas de Autodiscovery
- Problemas de contenedores de Windows
- Configuración del tiempo de ejecución del Agent
- Consumo elevado de memoria o CPU
- Guías
- Seguridad de datos
- Integraciones
- OpenTelemetry
- Desarrolladores
- Autorización
- DogStatsD
- Checks personalizados
- Integraciones
- Crear una integración basada en el Agent
- Crear una integración API
- Crear un pipeline de logs
- Referencia de activos de integración
- Crear una oferta de mercado
- Crear un cuadro
- Crear un dashboard de integración
- Crear un monitor recomendado
- Crear una regla de detección Cloud SIEM
- OAuth para integraciones
- Instalar la herramienta de desarrollo de integraciones del Agente
- Checks de servicio
- Complementos de IDE
- Comunidad
- Guías
- API
- Aplicación móvil de Datadog
- CoScreen
- Cloudcraft
- En la aplicación
- Dashboards
- Notebooks
- Editor DDSQL
- Hojas
- Monitores y alertas
- Infraestructura
- Métricas
- Watchdog
- Bits AI
- Catálogo de servicios
- Catálogo de APIs
- Error Tracking
- Gestión de servicios
- Objetivos de nivel de servicio (SLOs)
- Gestión de incidentes
- De guardia
- Gestión de eventos
- Gestión de casos
- Workflow Automation
- App Builder
- Infraestructura
- Universal Service Monitoring
- Contenedores
- Serverless
- Monitorización de red
- Coste de la nube
- Rendimiento de las aplicaciones
- APM
- Términos y conceptos de APM
- Instrumentación de aplicación
- Recopilación de métricas de APM
- Configuración de pipelines de trazas
- Correlacionar trazas (traces) y otros datos de telemetría
- Trace Explorer
- Observabilidad del servicio
- Instrumentación dinámica
- Error Tracking
- Seguridad de los datos
- Guías
- Solucionar problemas
- Continuous Profiler
- Database Monitoring
- Gastos generales de integración del Agent
- Arquitecturas de configuración
- Configuración de Postgres
- Configuración de MySQL
- Configuración de SQL Server
- Configuración de Oracle
- Configuración de MongoDB
- Conexión de DBM y trazas
- Datos recopilados
- Explorar hosts de bases de datos
- Explorar métricas de consultas
- Explorar ejemplos de consulta
- Solucionar problemas
- Guías
- Data Streams Monitoring
- Data Jobs Monitoring
- Experiencia digital
- Real User Monitoring
- Monitorización del navegador
- Configuración
- Configuración avanzada
- Datos recopilados
- Monitorización del rendimiento de páginas
- Monitorización de signos vitales de rendimiento
- Monitorización del rendimiento de recursos
- Recopilación de errores del navegador
- Rastrear las acciones de los usuarios
- Señales de frustración
- Error Tracking
- Solucionar problemas
- Monitorización de móviles y TV
- Plataforma
- Session Replay
- Exploración de datos de RUM
- Feature Flag Tracking
- Error Tracking
- Guías
- Seguridad de los datos
- Monitorización del navegador
- Análisis de productos
- Pruebas y monitorización de Synthetics
- Continuous Testing
- Entrega de software
- CI Visibility
- CD Visibility
- Test Visibility
- Configuración
- Tests en contenedores
- Búsqueda y gestión
- Explorador
- Monitores
- Flujos de trabajo de desarrolladores
- Cobertura de código
- Instrumentar tests de navegador con RUM
- Instrumentar tests de Swift con RUM
- Detección temprana de defectos
- Reintentos automáticos de tests
- Correlacionar logs y tests
- Guías
- Solucionar problemas
- Intelligent Test Runner
- Code Analysis
- Quality Gates
- Métricas de DORA
- Seguridad
- Información general de seguridad
- Cloud SIEM
- Cloud Security Management
- Application Security Management
- Observabilidad de la IA
- Log Management
- Observability Pipelines
- Gestión de logs
- Administración
- Gestión de cuentas
- Seguridad de los datos
- Sensitive Data Scanner
- Ayuda
Gráficos integrables con variables de plantilla
Los gráficos integrables creados con la API aceptan variables de plantilla. En el siguiente ejemplo se utiliza Python para consultar avg:system.cpu.user{$var}. En este ejemplo, $var es la variable de plantilla. Nota: Este método sólo admite gráficos con visualización de series temporales.
from datadog import initialize, api
import json

# Initialize request parameters with Datadog API/APP key
options = {
    'api_key': '<DATADOG_API_KEY>',
    'app_key': '<DATADOG_APPLICATION_KEY>'
}

initialize(**options)

# Create an embed graph definition as a dict and format as JSON
graph_json = {
    "requests": [{
        "q": "avg:system.cpu.user{$var}"
    }],
    "viz": "timeseries",
    "events": []
}
graph_json = json.dumps(graph_json)

api.Embed.create(
    graph_json=graph_json,
    timeframe="1_hour",
    size="medium",
    legend="no"
)
Ejemplo de respuesta:
{
  'embed_id': '<EMBED_ID>',
  'revoked': False,
  'template_variables': ['var'],
  'html': '<iframe src="https://app.datadoghq.com/graph/embed?token=<EMBED_TOKEN>&height=300&width=600&legend=false&var=*" width="600" height="300" frameBorder="0"></iframe>',
  'graph_title': 'Embed created through API',
  'dash_url': None,
  'shared_by': 734258,
  'dash_name': None
}
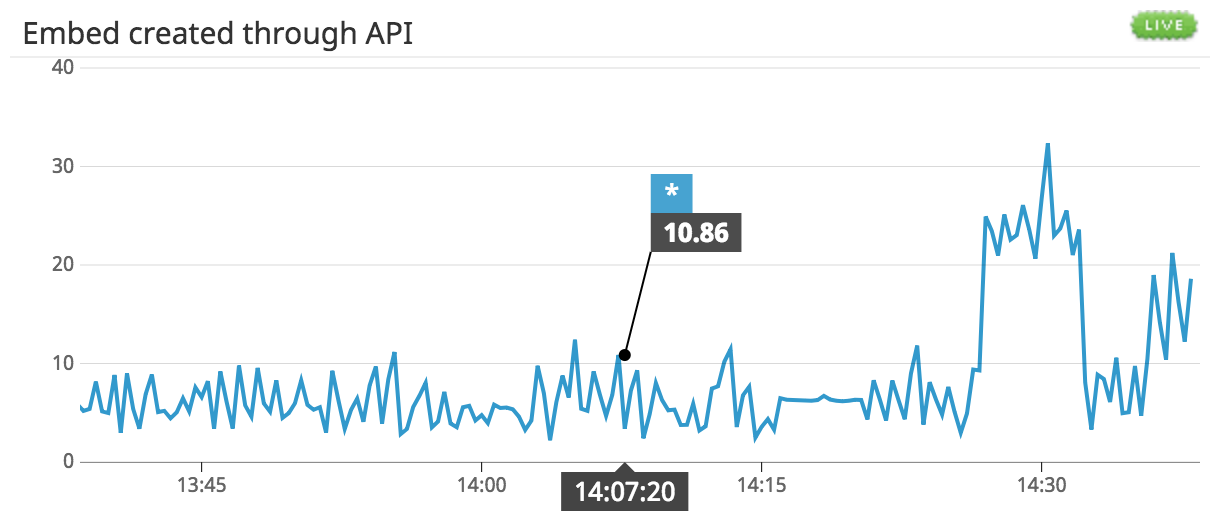
Muestra el gráfico integrado en un sitio web utilizando el HTML en el objeto de respuesta. Observa que la variable de plantilla $var se establece en * por defecto en la URL del iframe. Esto equivale a la consulta avg:system.cpu.user{*}.
<iframe src="https://app.datadoghq.com/graph/embed?token=<EMBED_TOKEN>&height=300&width=600&legend=false&var=*" width="600" height="300" frameBorder="0"></iframe>
Ejemplo de integración:
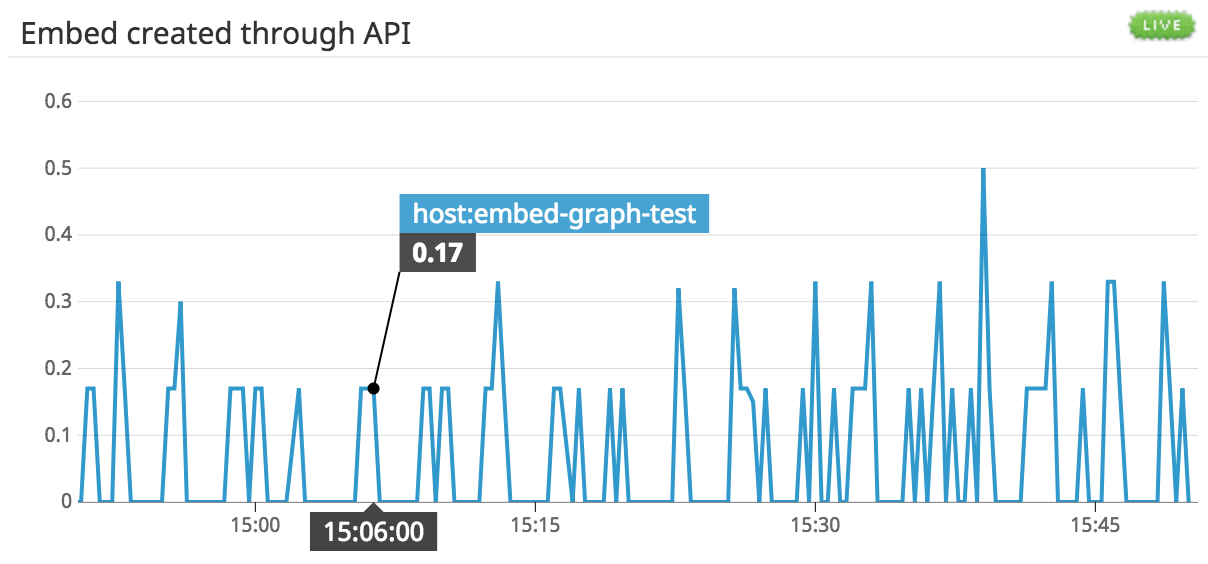
Utiliza la variable de plantilla para cambiar el gráfico actualizando la URL del iframe para definir un filtro. En el siguiente HTML, * se sustituye por host:embed-graph-test.
<iframe src="https://app.datadoghq.com/graph/embed?token=<EMBED_TOKEN>&height=300&width=600&legend=false&var=host:embed-graph-test" width="600" height="300" frameBorder="0"></iframe>
Ejemplo de integración:
Leer más
Más enlaces, artículos y documentación útiles:


