- Principales informations
- Getting Started
- Datadog
- Site Datadog
- DevSecOps
- Serverless for AWS Lambda
- Agent
- Intégrations
- Conteneurs
- Dashboards
- Monitors
- Logs
- Tracing
- Profileur
- Tags
- API
- Service Catalog
- Session Replay
- Continuous Testing
- Surveillance Synthetic
- Incident Management
- Database Monitoring
- Cloud Security Management
- Cloud SIEM
- Application Security Management
- Workflow Automation
- CI Visibility
- Test Visibility
- Intelligent Test Runner
- Code Analysis
- Learning Center
- Support
- Glossary
- Standard Attributes
- Guides
- Agent
- Intégrations
- OpenTelemetry
- Développeurs
- Authorization
- DogStatsD
- Checks custom
- Intégrations
- Create an Agent-based Integration
- Create an API Integration
- Create a Log Pipeline
- Integration Assets Reference
- Build a Marketplace Offering
- Create a Tile
- Create an Integration Dashboard
- Create a Recommended Monitor
- Create a Cloud SIEM Detection Rule
- OAuth for Integrations
- Install Agent Integration Developer Tool
- Checks de service
- IDE Plugins
- Communauté
- Guides
- API
- Application mobile
- CoScreen
- Cloudcraft
- In The App
- Dashboards
- Notebooks
- DDSQL Editor
- Alertes
- Infrastructure
- Métriques
- Watchdog
- Bits AI
- Service Catalog
- API Catalog
- Error Tracking
- Service Management
- Infrastructure
- Universal Service Monitoring
- Conteneurs
- Sans serveur
- Surveillance réseau
- Cloud Cost
- Application Performance
- APM
- Profileur en continu
- Database Monitoring
- Agent Integration Overhead
- Setup Architectures
- Configuration de Postgres
- Configuration de MySQL
- Configuration de SQL Server
- Setting Up Oracle
- Setting Up MongoDB
- Connecting DBM and Traces
- Données collectées
- Exploring Database Hosts
- Explorer les métriques de requête
- Explorer des échantillons de requêtes
- Dépannage
- Guides
- Data Streams Monitoring
- Data Jobs Monitoring
- Digital Experience
- RUM et Session Replay
- Product Analytics
- Surveillance Synthetic
- Continuous Testing
- Software Delivery
- CI Visibility
- CD Visibility
- Test Visibility
- Exécuteur de tests intelligent
- Code Analysis
- Quality Gates
- DORA Metrics
- Securité
- Security Overview
- Cloud SIEM
- Cloud Security Management
- Application Security Management
- AI Observability
- Log Management
- Pipelines d'observabilité
- Log Management
- Administration
Datadog Extension for Visual Studio Code
Cette page n'est pas encore disponible en français, sa traduction est en cours.
Si vous avez des questions ou des retours sur notre projet de traduction actuel, n'hésitez pas à nous contacter.
Si vous avez des questions ou des retours sur notre projet de traduction actuel, n'hésitez pas à nous contacter.
Overview
The Datadog extension for Visual Studio Code (VS Code) integrates with Datadog to accelerate your development.
It packs several features, including:
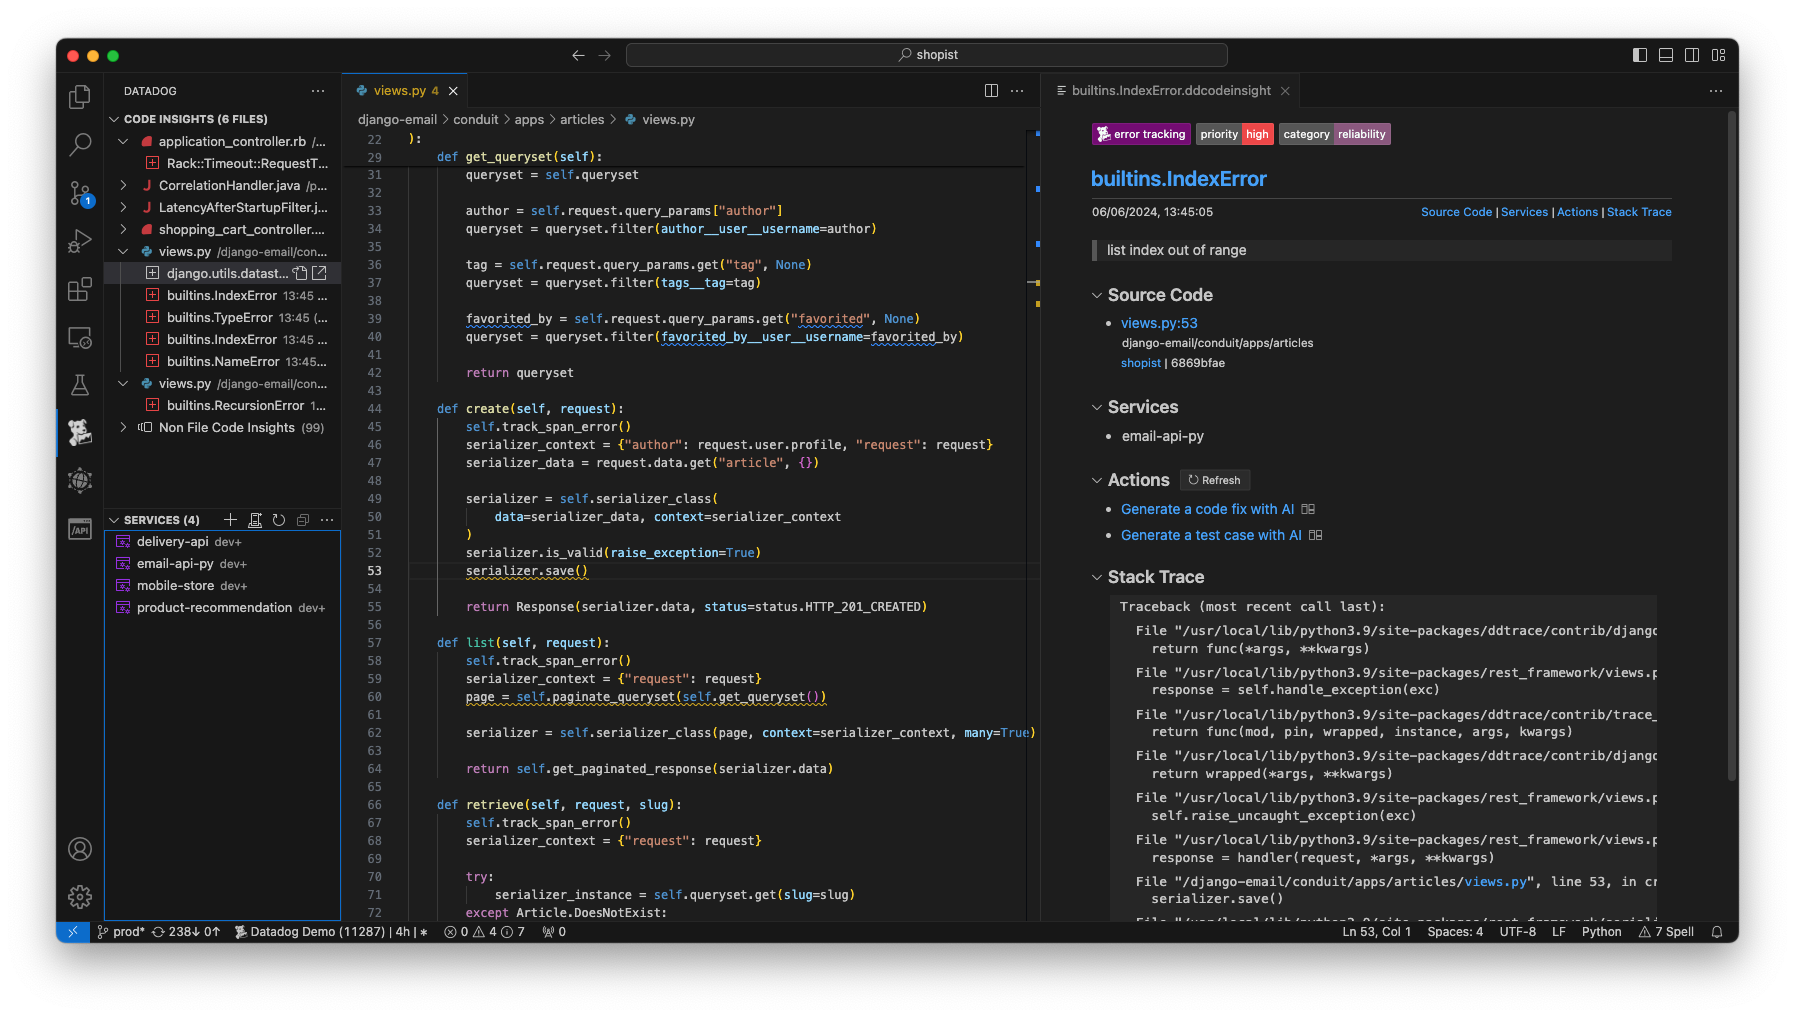
Code Insights to keep you informed about
- Issues from Error Tracking
- Reports by Application Vulnerability Management
- Flaky tests detected by CI Visibility
Synthetic Tests to provide quality assurance during development by allowing you to run existing Synthetic Tests against local servers.
View in VS Code to directly go from your file references on the Datadog platform to your source files.
Logs Navigation to allow you to search for logs from your code.
Code Delta to more accurately map observability data to your files in VS Code.
Static Analysis to detect and fix problems even before you commit changes.
Exception Replay to help you debug your production code.
Requirements
A Datadog account: The extension requires a Datadog account (except when using Static Analysis features). If you’re new to Datadog, go to the Datadog website to learn more about Datadog’s observability tools and sign up for a free trial.
VS Code Git: The extension works better when VS Code Git integration is enabled. You can ensure that the integration is enabled by checking the
git.enabledsetting.
Setup
Install the Datadog Extension from the Visual Studio Marketplace.
Code Insights
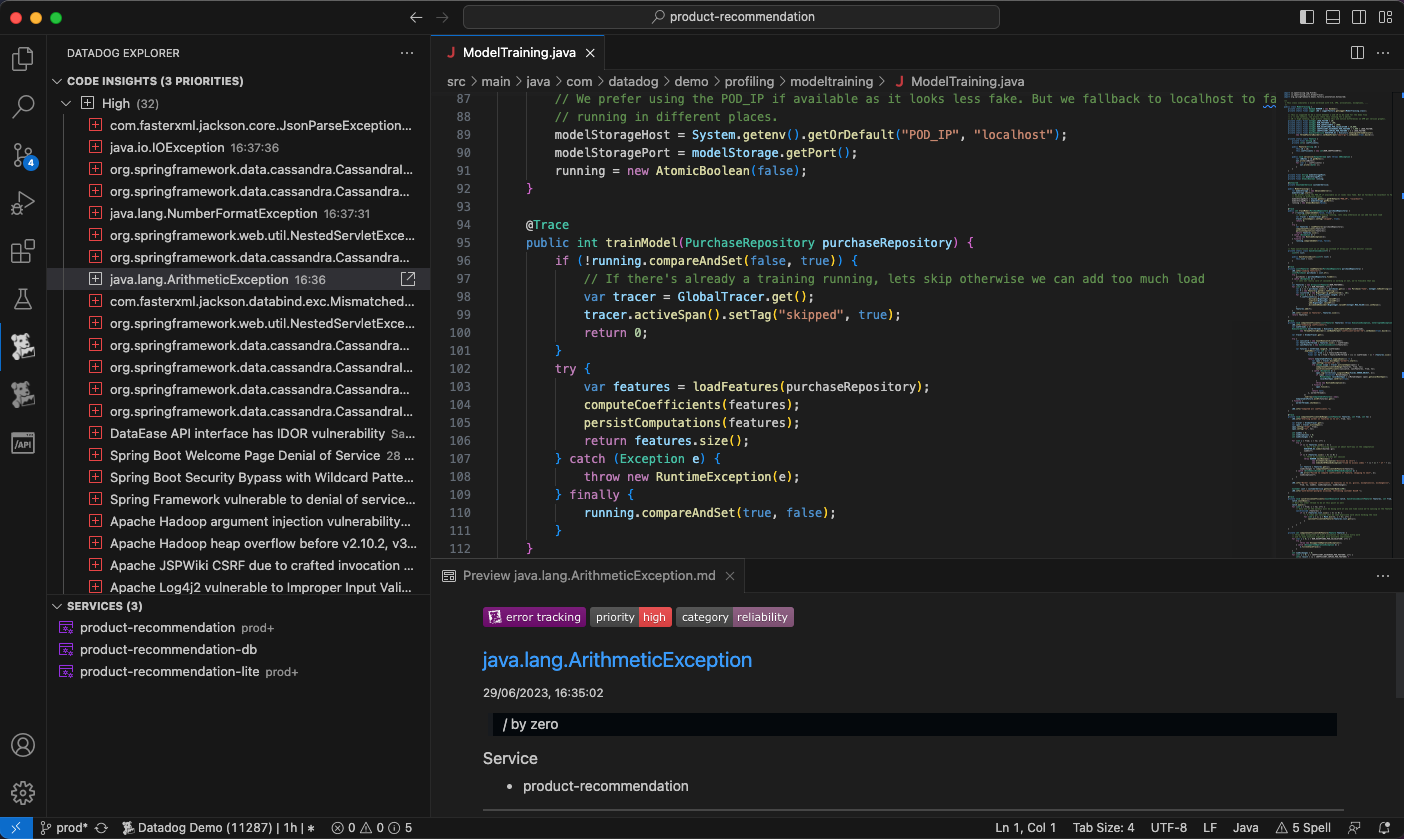
The Code Insights tree displays insights generated by the Datadog platform that are relevant to your code-base. The insights are grouped into three categories: performance, reliability, and security.
Code Insights include a detailed description for each issue, and links to:
- The related source code location
- The Datadog platform for additional information
You can dismiss individual Code Insights and set filters to view the ones you are most interested in.
Synthetic Tests
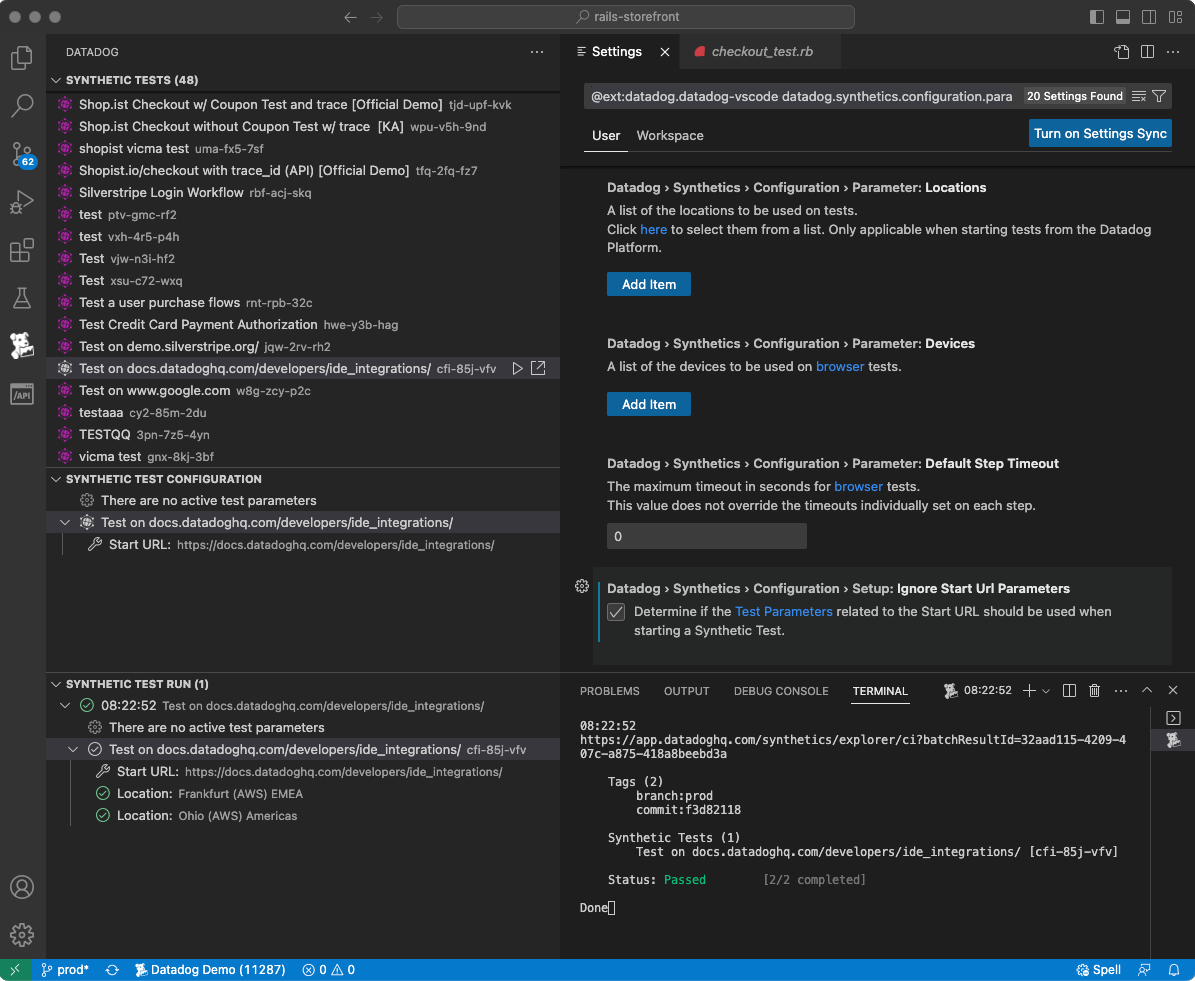
The Datadog extension enables you to run Synthetic HTTP tests and browser tests on local environments directly in VS Code. You can identify and address potential issues resulting from code changes before they are deployed into production and impact your end users.
We support HTTP API tests and Browser tests.
Run Synthetic tests locally
- Select a Synthetic test to execute. You can search for specific tests by clicking the Search icon.
- Change the test’s configuration to convert the start URL and specify a
localhostURL on the Settings page. - Run the test.
If you haven’t set up Synthetic tests already, create a test in Datadog. For more information about running tests on a local environment, see Getting Started with API Tests, Getting Started with Browser Tests, and the Continuous Testing documentation.
Permissions
By default, only users with the Datadog Admin and Datadog Standard roles can create, edit, and delete Synthetic HTTP and browser tests. To get create, edit, and delete access to Synthetic HTTP and browser tests, upgrade your user to one of those two default roles.
If you are using the custom role feature, add your user to any custom role that includes synthetics_read and synthetics_write permissions.
View in VS Code
The View in VS Code feature provides a link from Datadog directly to your source files. Look for the button next to frames in stack traces displayed in the UI (for example, in Error Tracking):
To use this feature, first configure source code integration for your service.
Logs navigation
You can navigate to the Log Explorer on the Datadog platform directly from your source code files.
If you’re using a supported logging library, the extension is able to show you code lenses on the lines where it has detected log patterns that match the Datadog platform records:
The supported logging libraries are:
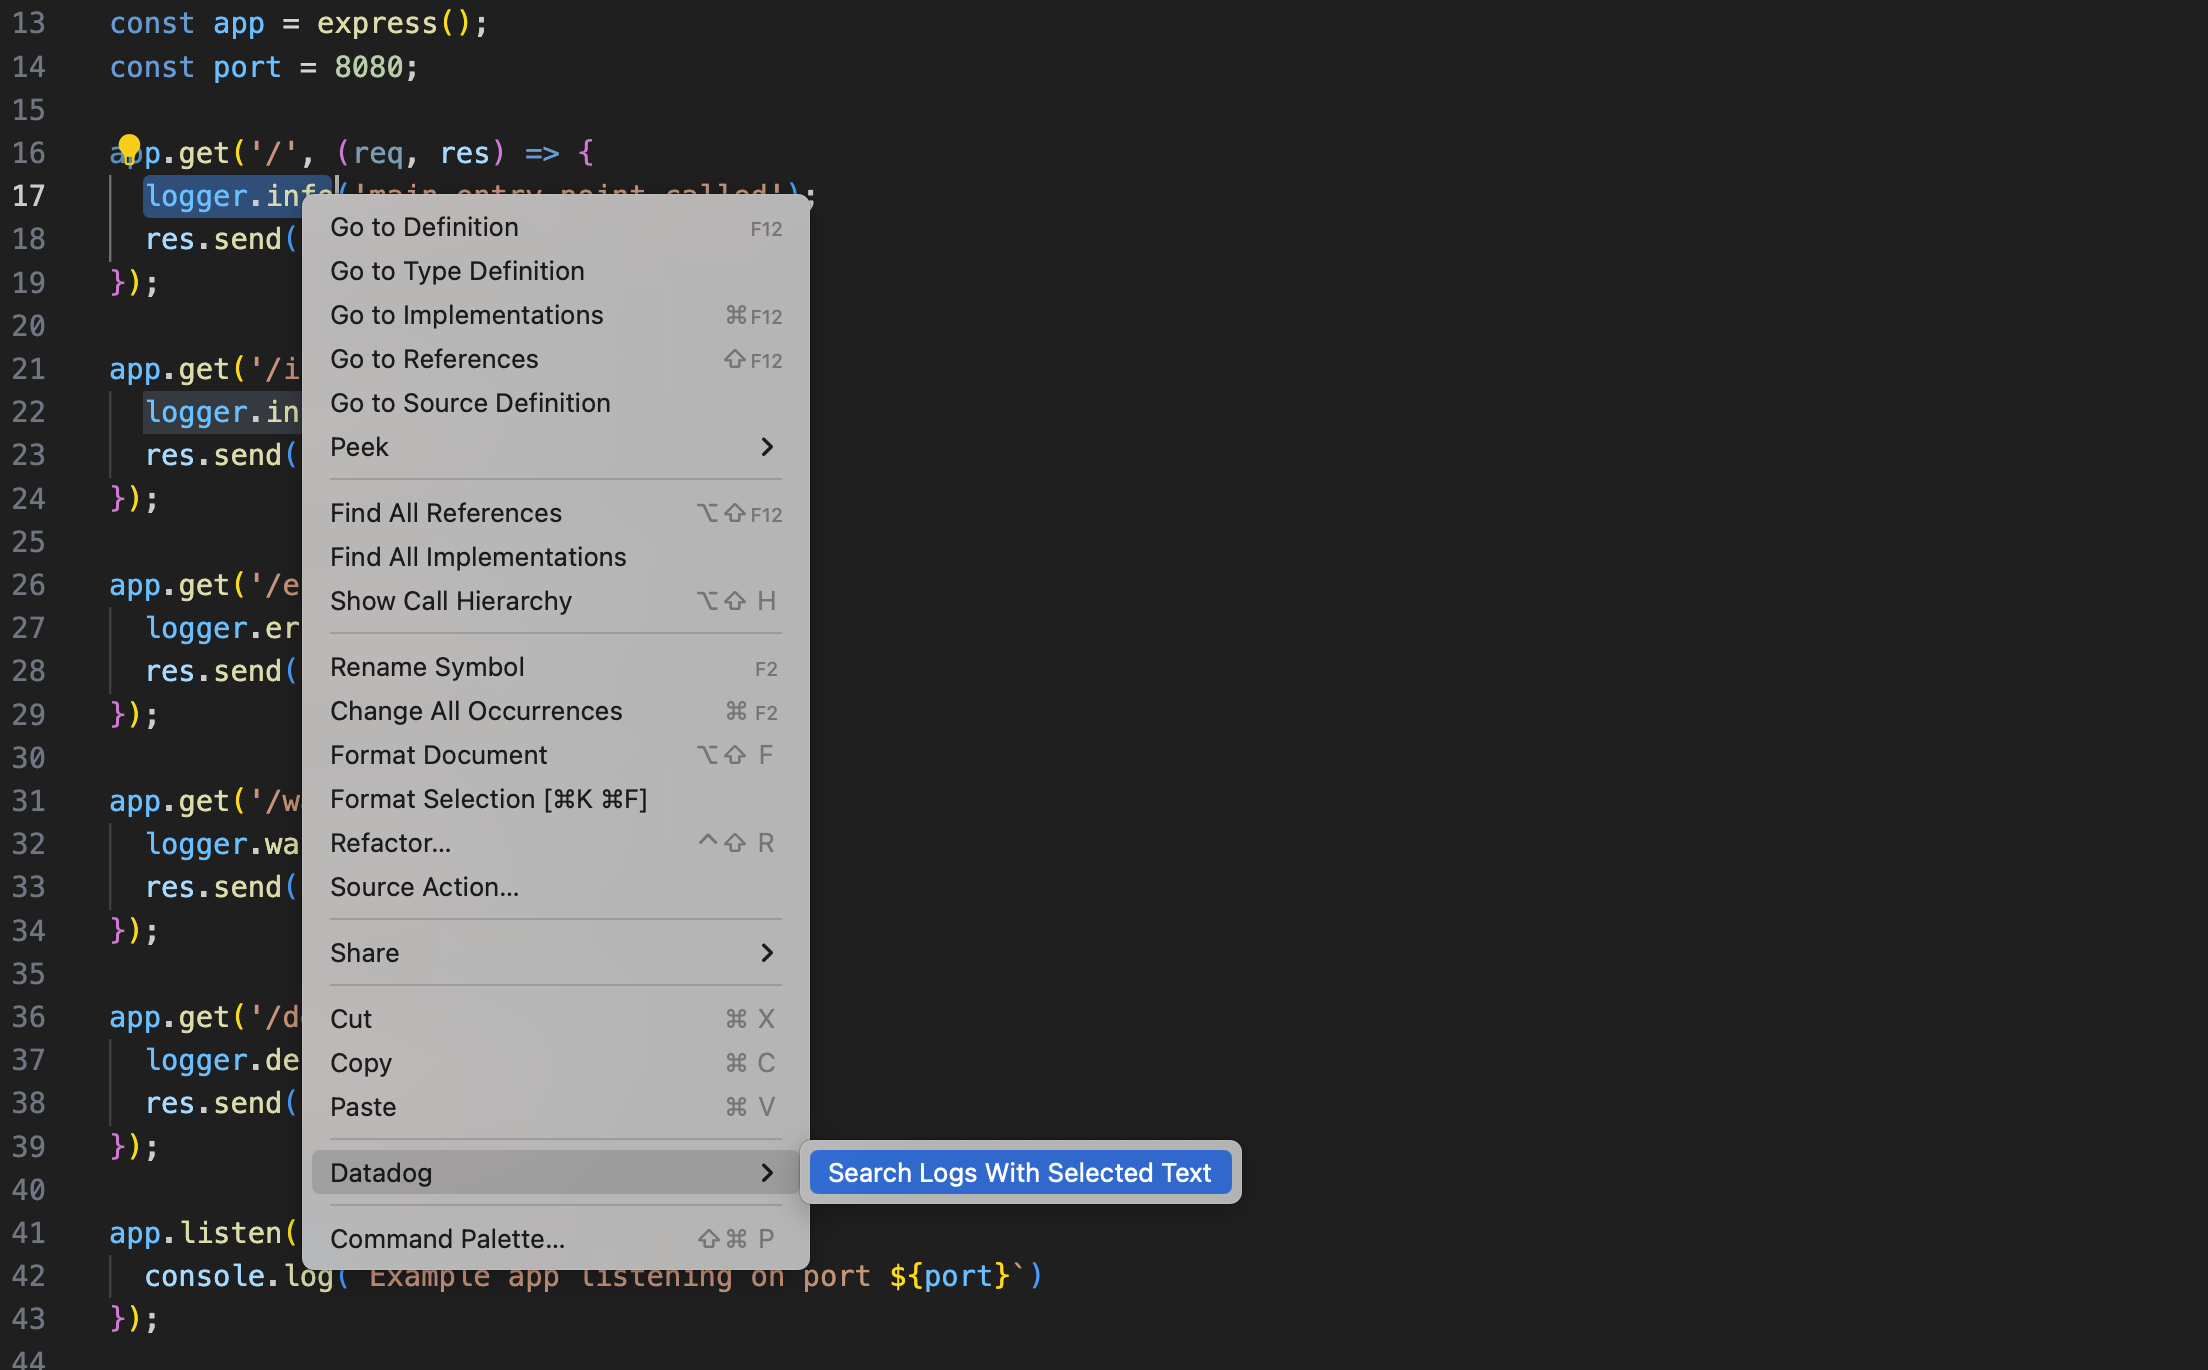
Alternatively, you can select some text in your source code, right click on them, and look for the Datadog > Search Logs With Selected Text option.
Code Delta
Code Delta matches the line numbers included in Datadog telemetry to the line numbers of the files you are currently working on in VS Code.
For example, all View in VS Code links on the Datadog platform encode runtime version info, and the extension uses that to compute the corresponding line of code in your editor, taking into account version changes.
You can tweak the Code Delta settings to change how the matching algorithm works. In particular, you can modify the Minimum Affinity value, which determines the degree of confidence required to match lines.
Static Analysis
The Static Analysis integration analyzes your code (locally) against predefined rules to detect and fix problems.
The Datadog extension runs Static Analysis rules on the source files you have open in your Workspace. The goal is to detect and fix problems such as maintainability issues, bugs, or security vulnerabilities in your code before you commit your changes.
Static Analysis supports scanning for many programming languages. For a complete list, see Static Analysis Rules. For file types belonging to supported languages, issues are shown in the source code editor with the VS Code inspection system, and suggested fixes can be applied directly.
Getting started
When you start editing a source file, the extension checks for static-analysis.datadog.yml at your source repository’s root. It prompts you to create it if necessary.
Once the configuration file is created, the static analyzer runs automatically in the background.
The Static Analysis feature does not require a Datadog account, as source files are analyzed locally.
Exception Replay
Exception Replay allows you to navigate through the stack trace frames of any Error Tracking code insight and get information about the values of the variables of the code running in production.
In order to get access to this feature, you have to enable Error Tracking Exception Replay on Datadog.
After the feature has been enabled, you can see an Exception Replay button next to the stack trace section of any instrumented Error Tracking code insight. If you click over it, you can:
- access all the information Datadog has about the different frames
- navigate through the production code
- review the value of the different variables involved
Select an Error Tracking code insight from the Code Insights view. Go to the stack trace and click the Exception Replay button. VS Code shows a new activity with two new views:
- Variables: It shows the variables related to a particular stack trace frame.
- Stack Trace: It allows you to navigate through the different stack trace frames.
Select a stack trace frame and inspect the values of all the variables that Datadog captured from your production code.
License
Please read this End-User License Agreement carefully before downloading or using the Datadog Visual Studio Code Extension.
Data and telemetry
Datadog anonymously collects information about your usage of this IDE, including how you interact with it, whether errors occurred while using it, and what caused those errors, in accordance with the Datadog Privacy Policy and Datadog’s VS Code extension EULA.
If you don’t wish to send this data to Datadog, you can opt out at any time in the VS Code extension settings: Datadog > Telemetry > Setup > Enable Telemetry and select disabled.
The Datadog extension also honors the VS Code telemetry telemetry setting.
Help and feedback
To share your feedback, email team-ide-integration@datadoghq.com or create an issue in the extension’s public repository.
Check out the issues section to discover known issues.
Further Reading
Documentation, liens et articles supplémentaires utiles:


