- Essentials
- Getting Started
- Datadog
- Datadog Site
- DevSecOps
- Serverless for AWS Lambda
- Agent
- Integrations
- Containers
- Dashboards
- Monitors
- Logs
- APM Tracing
- Profiler
- Tags
- API
- Software Catalog
- Session Replay
- Synthetic Monitoring and Testing
- Incident Management
- Database Monitoring
- Cloud Security Management
- Cloud SIEM
- Application Security Management
- Workflow Automation
- Software Delivery
- Code Security
- Learning Center
- Support
- Glossary
- Standard Attributes
- Guides
- Agent
- Integrations
- Developers
- Authorization
- DogStatsD
- Custom Checks
- Integrations
- Create an Agent-based Integration
- Create an API Integration
- Create a Log Pipeline
- Integration Assets Reference
- Build a Marketplace Offering
- Create a Tile
- Create an Integration Dashboard
- Create a Monitor Template
- Create a Cloud SIEM Detection Rule
- OAuth for Integrations
- Install Agent Integration Developer Tool
- Service Checks
- IDE Plugins
- Community
- Guides
- OpenTelemetry
- Administrator's Guide
- API
- Datadog Mobile App
- CoScreen
- CoTerm
- Cloudcraft
- In The App
- Dashboards
- Notebooks
- DDSQL Editor
- Reference Tables
- Sheets
- Monitors and Alerting
- Metrics
- Watchdog
- Bits AI
- Software Catalog
- Error Tracking
- Change Tracking
- Service Management
- Actions & Remediations
- Infrastructure
- Resource Catalog
- Universal Service Monitoring
- Hosts
- Containers
- Processes
- Serverless
- Network Monitoring
- Cloud Cost
- Application Performance
- APM
- Continuous Profiler
- Database Monitoring
- Agent Integration Overhead
- Setup Architectures
- Setting Up Postgres
- Setting Up MySQL
- Setting Up SQL Server
- Setting Up Oracle
- Setting Up Amazon DocumentDB
- Setting Up MongoDB
- Connecting DBM and Traces
- Data Collected
- Exploring Database Hosts
- Exploring Query Metrics
- Exploring Query Samples
- Exploring Recommendations
- Troubleshooting
- Guides
- Data Streams Monitoring
- Data Jobs Monitoring
- Digital Experience
- Real User Monitoring
- Product Analytics
- Synthetic Testing and Monitoring
- Continuous Testing
- Software Delivery
- CI Visibility
- CD Visibility
- Test Optimization
- Quality Gates
- DORA Metrics
- Security
- Security Overview
- Cloud SIEM
- Cloud Security Management
- Application Security Management
- Sensitive Data Scanner
- Code Security
- AI Observability
- Log Management
- Observability Pipelines
- Log Management
- Administration
Instrument a custom method to get deep visibility into your business logic
8 minutes to complete
Note: This page describes using OpenTracing to custom instrument applications. OpenTracing is deprecated. The concepts presented here still apply, but follow the Custom Instrumentation with OpenTelemetry instructions and examples for your language instead.
To provide you with deep visibility into your business logic, Datadog APM allows you to customize the spans that make up your traces based on your needs and implementation. This empowers you to trace any method in your codebase and even specific components within methods. You can use this to optimize and monitor critical areas of your application at the granularity that works for you.
Datadog instruments many frameworks out-of-the-box, such as web services, databases, and caches, and enables you to instrument your own business logic to have the exact visibility you need. By creating spans for methods, you can optimize timing and track errors using the APM flame graph and monitors.
Instrumenting your code
Follow the example to get your code instrumented.
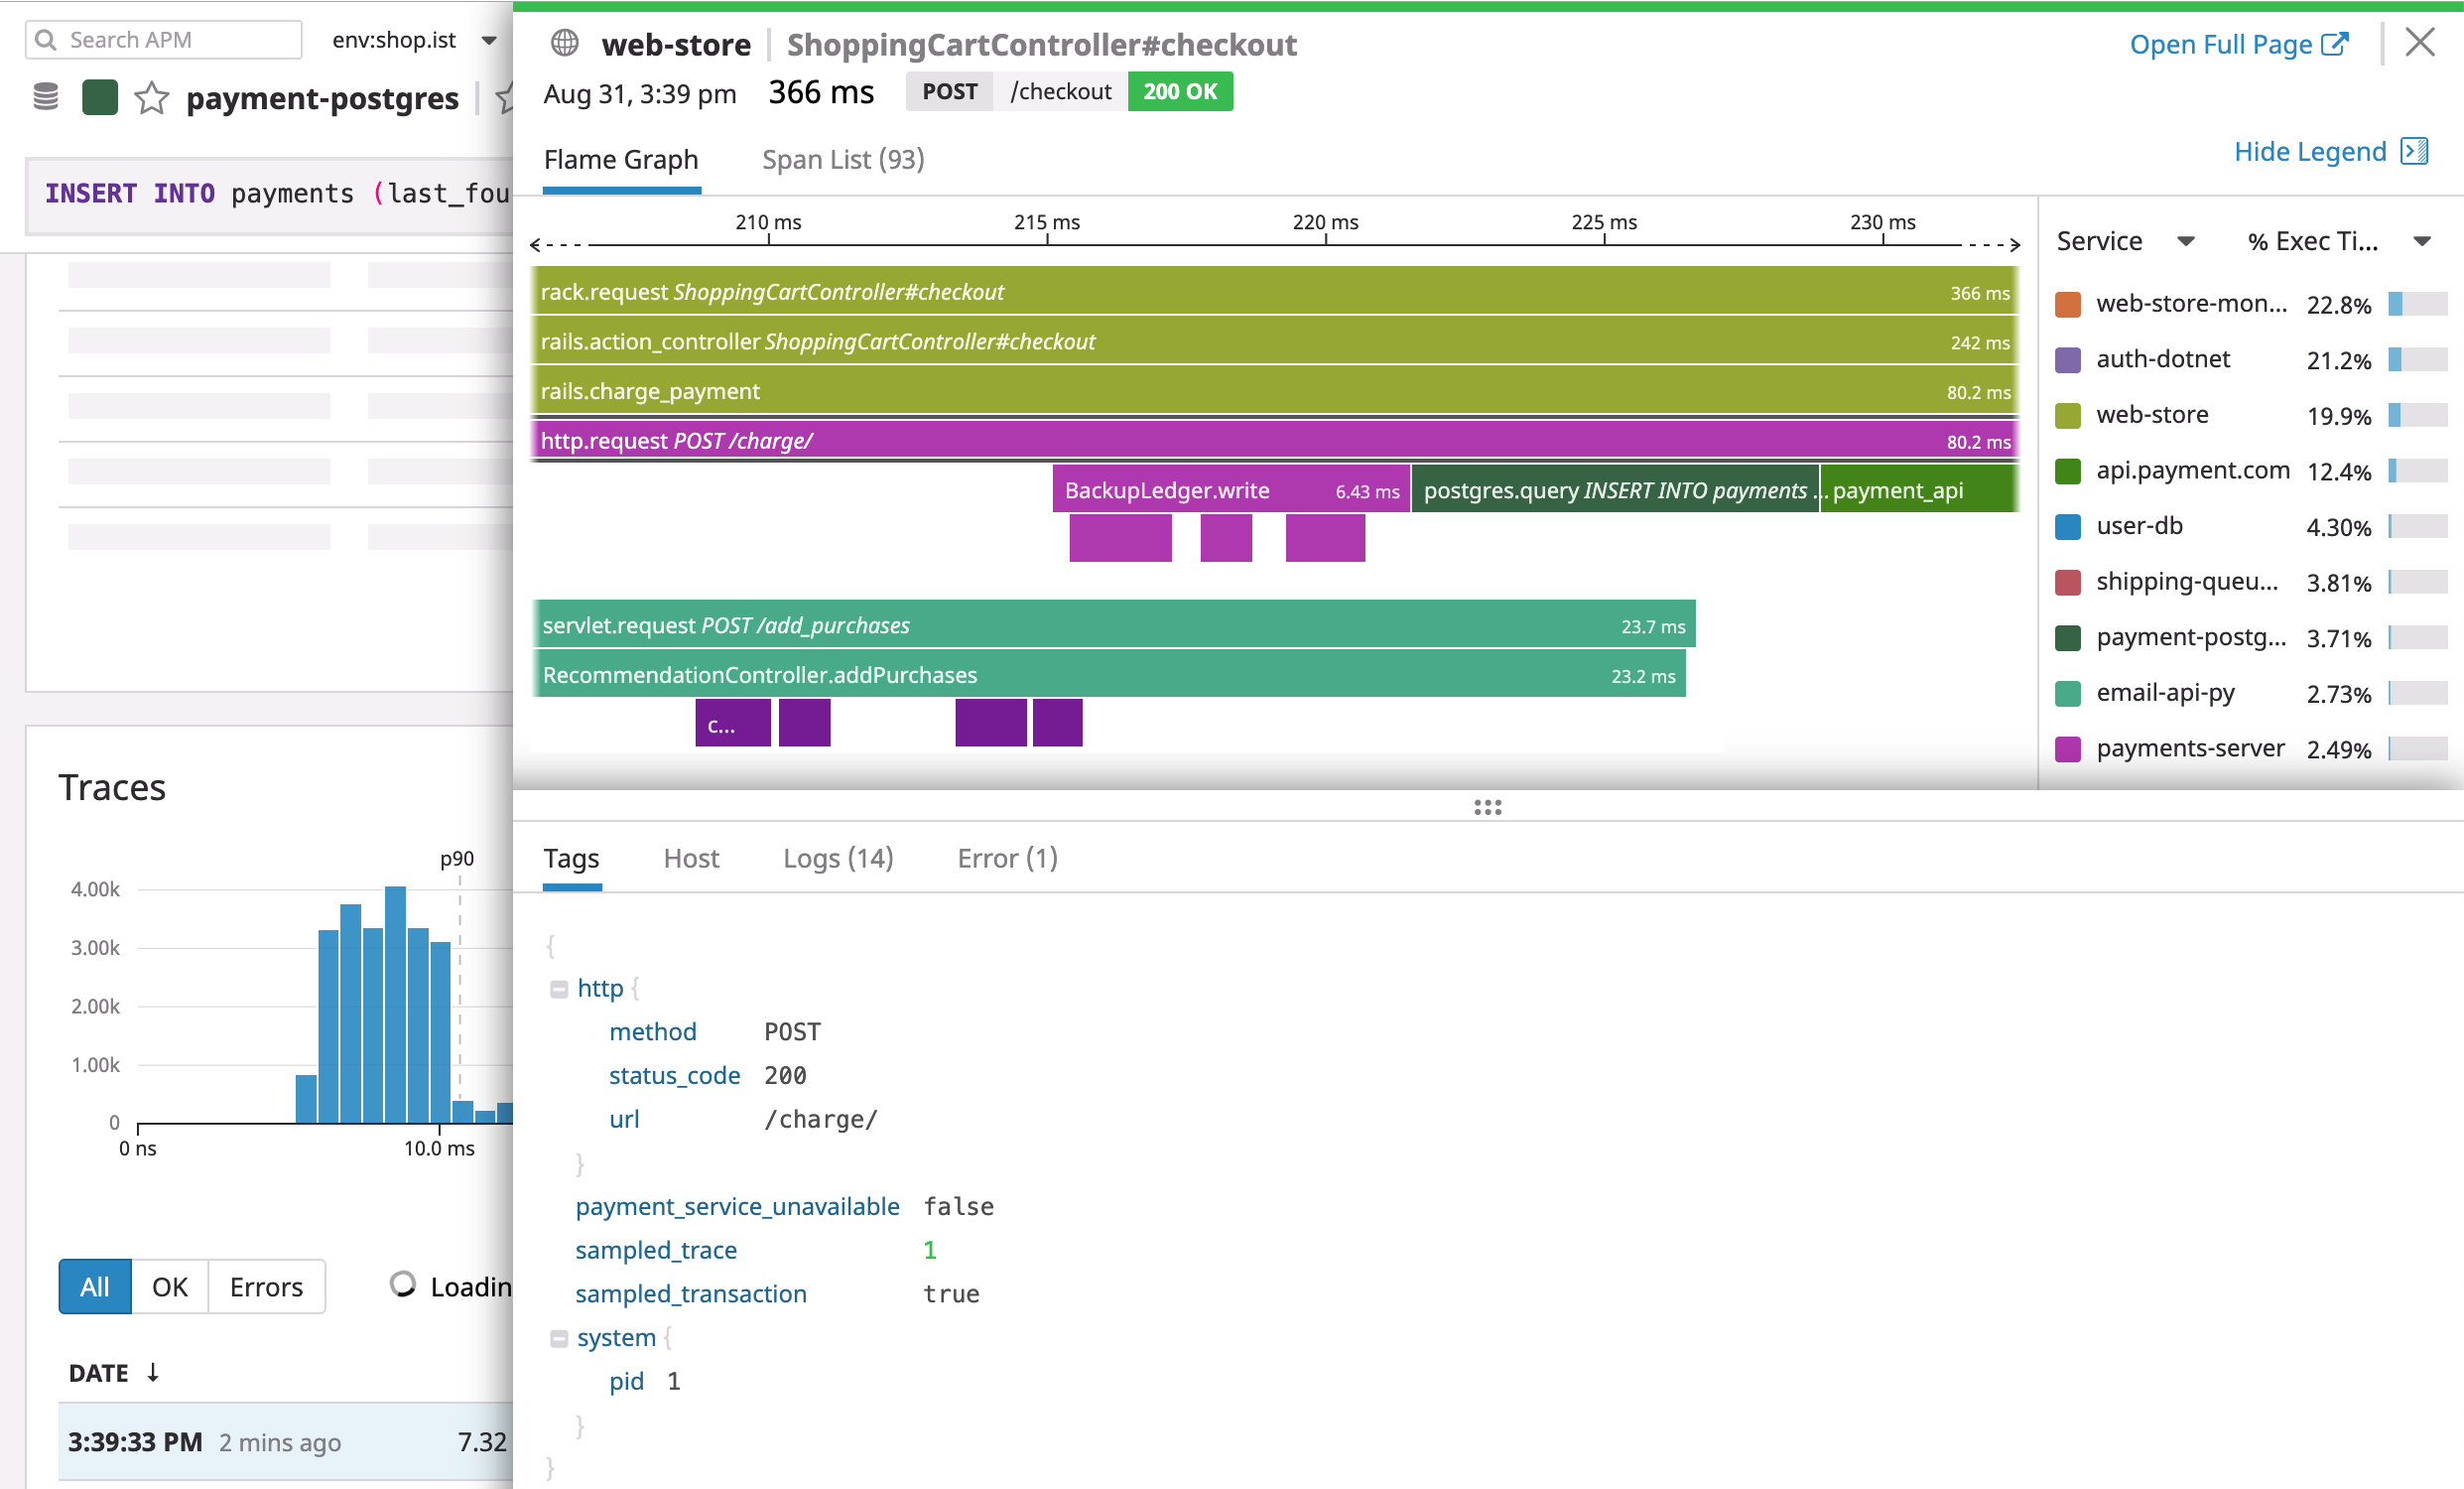
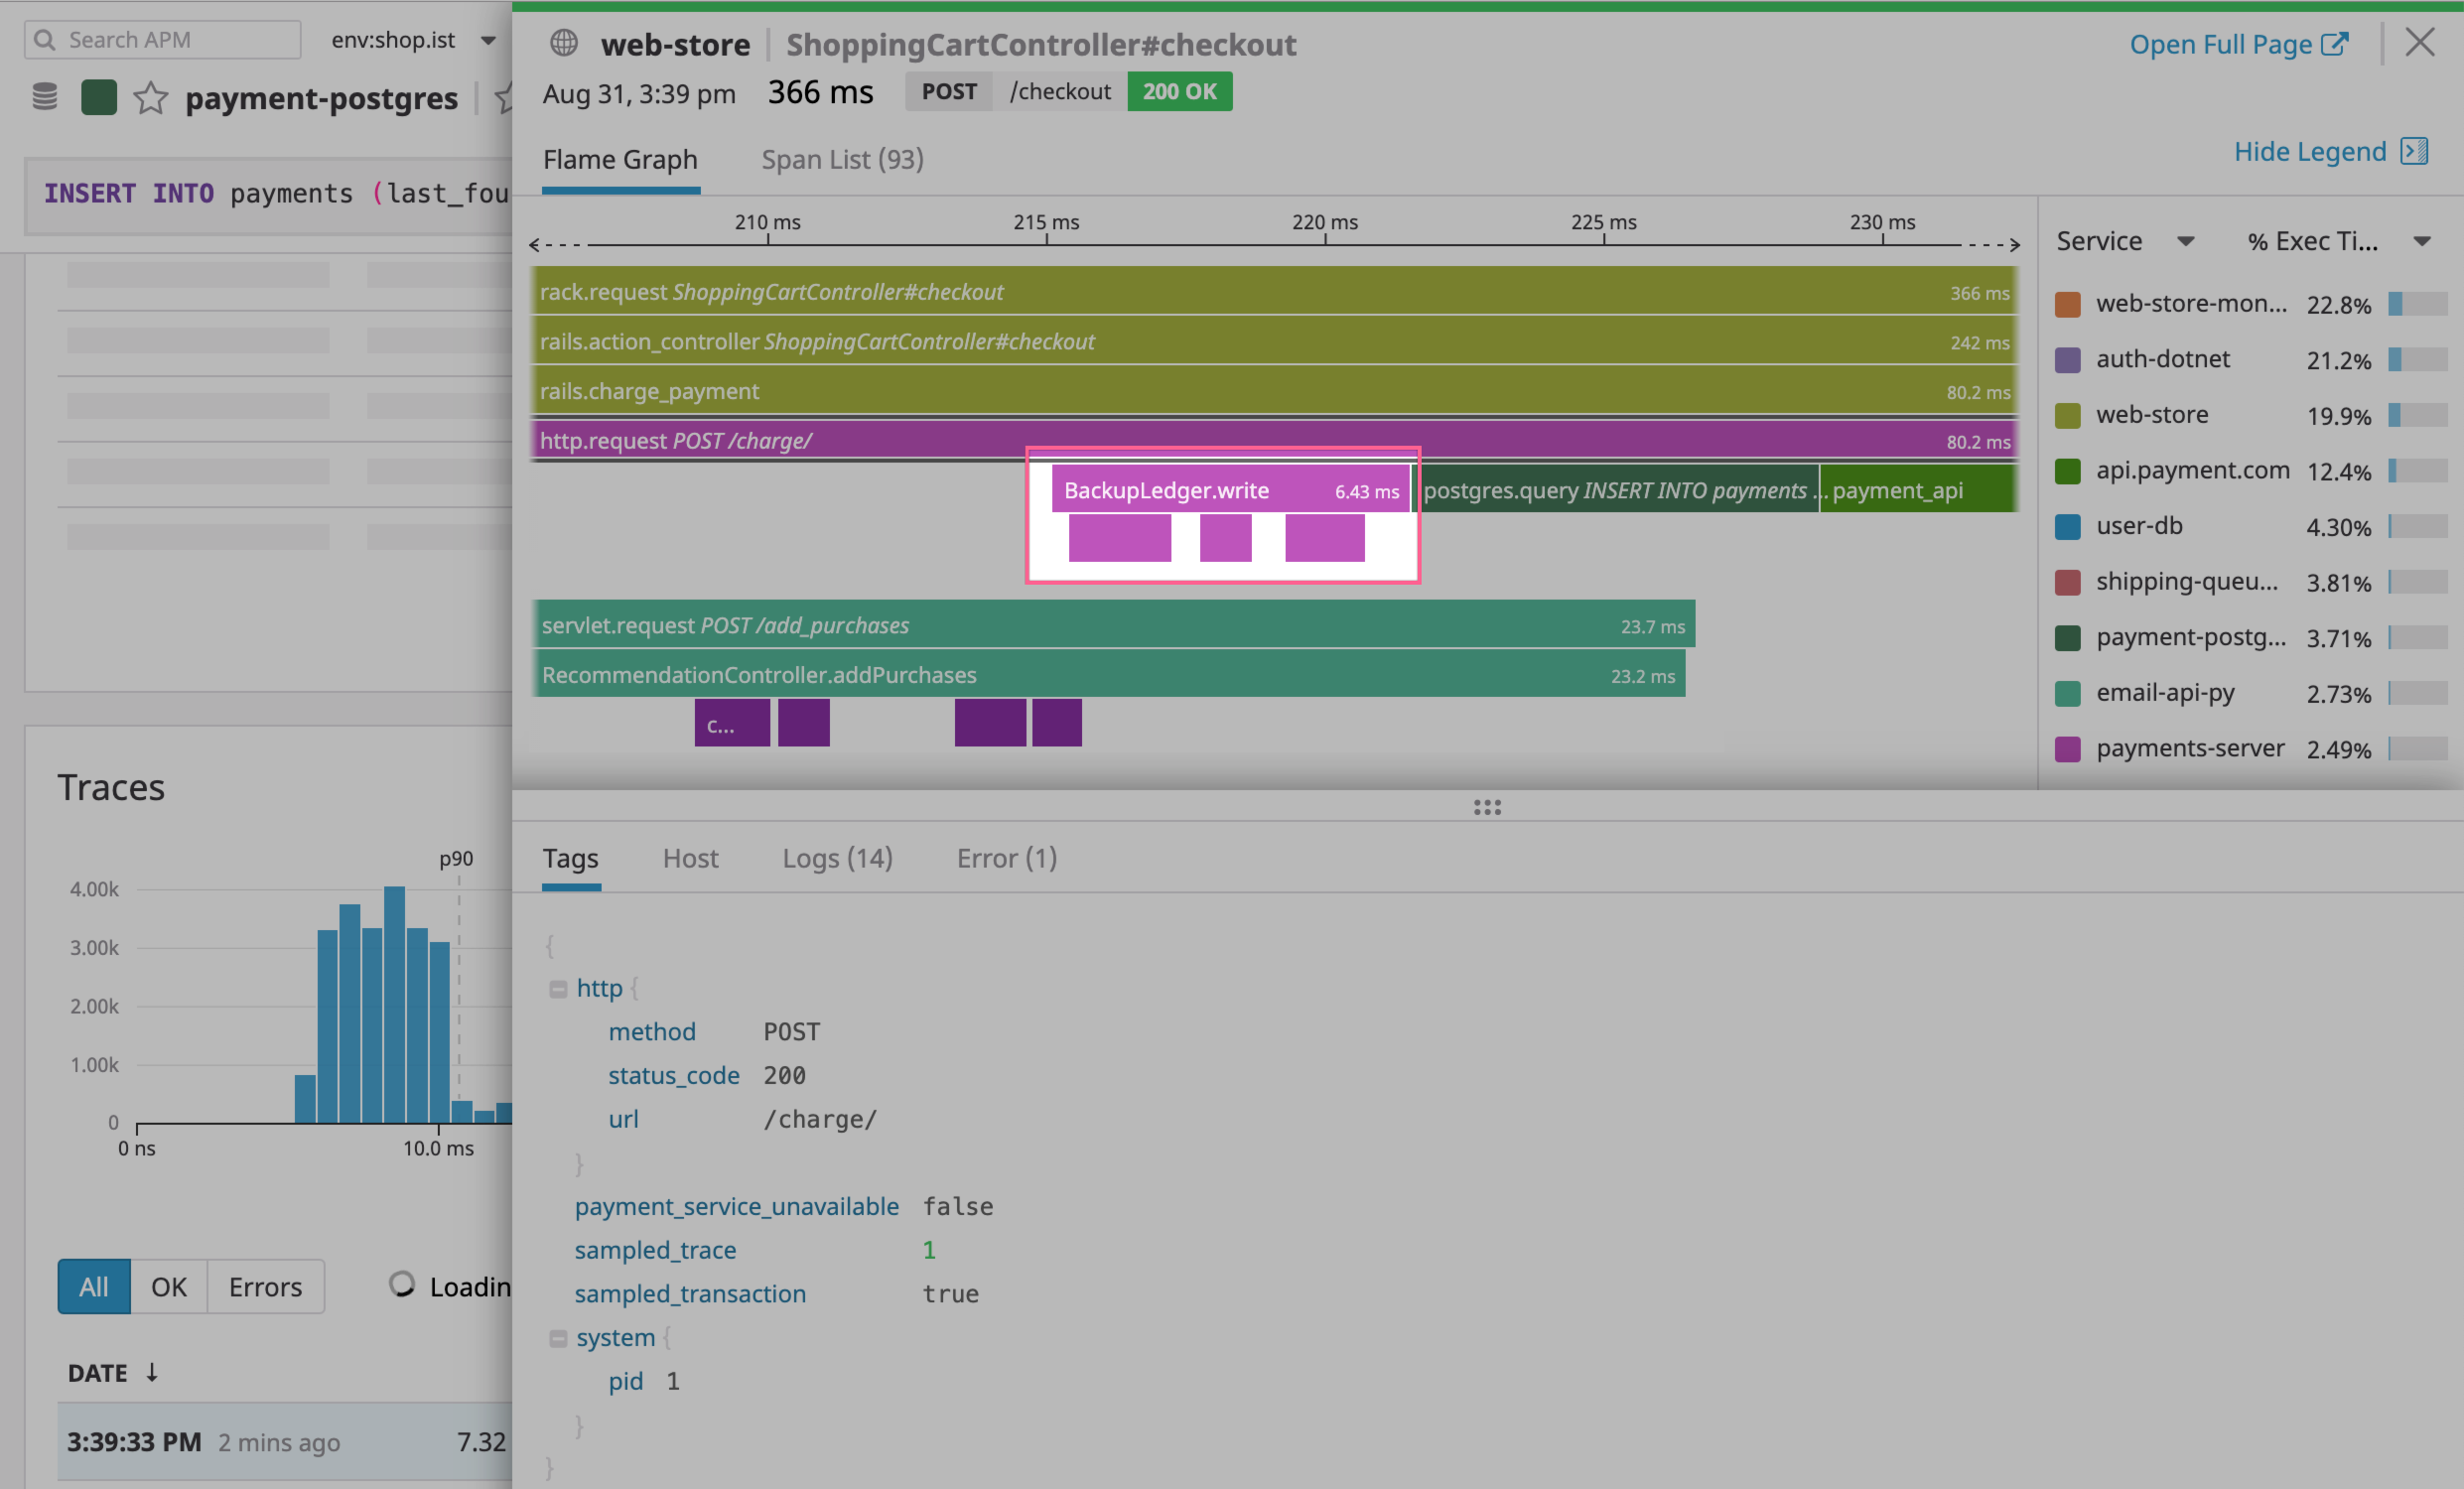
These examples walk through tracing the entire BackupLedger.write method to measure its execution time and status. BackupLedger.write is an action that saves the current state of a transaction ledger in memory before making a call to a payments database to post a new customer charge. This happens when the charge endpoint of the payments service is hit:
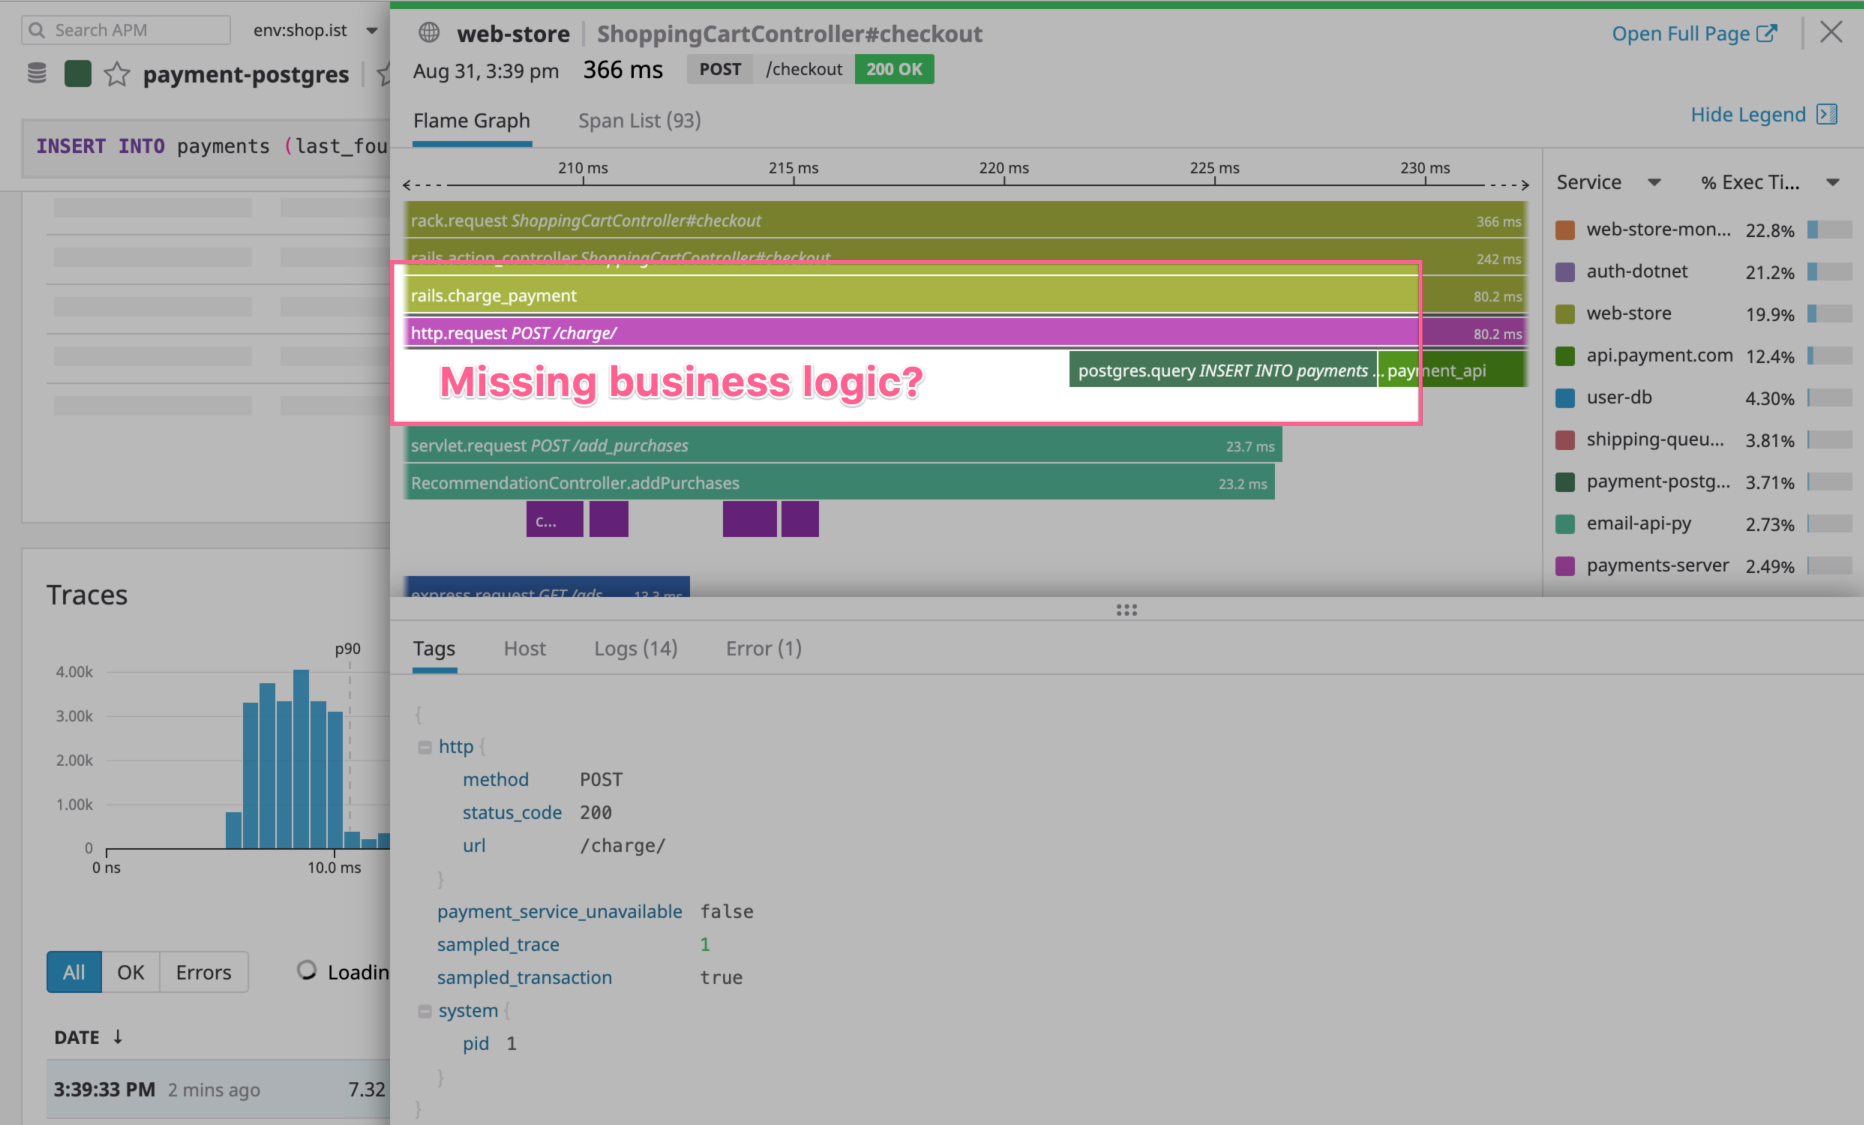
The http.request POST /charge/ span is taking a lot of time without having any direct child spans. This is a clue that this request requires further instrumentation to gain better insights into its behavior. Depending on the programming language you are using, you need to decorate your functions differently:
In Node.js, Datadog APM allows you to instrument your code to generate custom spans by instrumenting specific code blocks.
This example creates a new span for the call to the BackupLedger.write method and a child span for every transaction posted to the ledger with a custom tag with the specific transaction ID.
const tracer = require('dd-trace')

function write (transactions) {
  // Use `tracer.trace` context manager to trace blocks of inline code
  tracer.trace('BackupLedger.write', () => {
    for (const transaction of transactions) {
      tracer.trace('BackupLedger.persist' , (span) => {
        // Add custom metadata to the "persist_transaction" span
        span.setTag('transaction.id', transaction.id)
        this.ledger[transaction.id] = transaction
      })
    }
  })

  // [...]
}
Leverage the Datadog UI to see your new custom spans
Now that you have instrumented your business logic, it’s time to see the results in the Datadog APM UI.
Go to the Software Catalog, and click the service you added custom spans to, to open its service page. On the service page, click on the specific resource you added, change the time filter to
The past 15 minutes, and scroll down to the span summary table:
The span summary table provides aggregate information about the spans that make up your traces. Here you can identify spans that repeat an abnormal amount of times indicating some looping or database access inefficiency (like the n+1 issue).
Scroll down to the Traces list and click into one of your traces.
You’ve now successfully added custom spans to your codebase, making them available on the flame graph and in App Analytics. This is the first step towards taking full advantage of Datadog’s tools. You can now add custom tags to your spans to make them even more powerful.
Further Reading
Additional helpful documentation, links, and articles:


